STUDY OF NUTRITIONAL STATUS IN ELDERLY IN INDIAN POPULATION
*
Meena Shivraj, Singh V
Department of Medicine, SP Medical College, Bikaner Rajasthan
ARTICLE INFO ABSTRACT
Introduction
definite evidence that malnutrition is more common in geriatric population but it is undere diagnostic and therapeutic procedures.
Objective
≥65 years.
Material and
subjects from urban and 37% subjects from rural area). Nutritional status assessment was done by using 18 items (30 points) Mini nutritional assessment (MNA) scale.
Results:
malnutrition and only 42.4% were well nourished. Malnutrition and risk of malnutrition was more common in rural 104 (52.21%) , 47 (25.41%) than urban 126 (40%), 11 (
malnutrition according to literacy status as Illiterate, literature, primary, middle, secondary, college and professional was 26.03%, 8.47%, 0%,6.15%, 3.89%, 2.06% and 0% respectively. Prevalence of malnutrition according to financial
17.48% respectively. Prevalence of malnutrition in relation to BMI <19, 19 (47.11%), 9 (9.67%), 0 (0%) respectively.
Conclusion:
elderly was better than nutritional status of rural elderly. Illiteracy depended on other by financial status and low BMI worsen the nutritional status significantly in elderly, Nutritional evaluation should be a par
Copyright © 2014 Meena Shivraj et al. This is an open access article distributed under the Creative Commons Att distribution, and reproduction in any medium, provided the original work is properly cited.
INTRODUCTION
The number of elderly is on the increase, both in developed and developing countries (Kinsella and Suzman,
associated with various physiological changes and needs, which make elderly people vulnerable to malnutrition (Meydani, 2001). Malnutrition is both a common co
serious health problem among the elderly. It increases morbidity (Sullivan and Walls, 1995) and mortality
et al., 2002) among the elderly, is often accompanied by
anorexia, and it is also a risk factor for osteoporotic fracture
(Guigoz et al., 1996 and Gerber et al., 2003
of malnutrition varies considerably depending on the population studied and the criteria used for the diagnosis
(Joosten et al., 1999). Available data for malnutrition
worldwide shows that the prevalence of malnutrition as rated by the Mini Nutritional Assessment short form (MNA among the elderly is the following: 0–8% for those living community, 0–30% among the non-institutionalized elderly
*Corresponding author: Meena Shivraj
Departments and institutions Department of Medicine, SP Medical College, Bikaner Rajasthan, India
ISSN: 0975-833X
Vol. 6, Issue, 11, pp.10253
Article History:
Received 10th August, 2014
Received in revised form
23rd September, 2014
Accepted 27th October, 2014
Published online 30th November,2014
Key words:
Nutritional, Elderly,
Mini Nutritional Assessment, BMI.
RESEARCH ARTICLE
STUDY OF NUTRITIONAL STATUS IN ELDERLY IN INDIAN POPULATION
Meena Shivraj, Singh V. B, Meena B. L, Singh Kusum, Meena Neelam
Sharma Dayal, Beniwal Sanjay
Department of Medicine, SP Medical College, Bikaner Rajasthan
ABSTRACT
Introduction: Nutrition is an important factor contributing to health and functional ability. There is definite evidence that malnutrition is more common in geriatric population but it is undere
diagnostic and therapeutic procedures.
Objective: The present study was carried out to assess nutritional status in elderly population aged ≥65 years.
Material and Methods: It was a cross sectional study of 500 elderly subjects of age
subjects from urban and 37% subjects from rural area). Nutritional status assessment was done by using 18 items (30 points) Mini nutritional assessment (MNA) scale.
lts: Present study revealed that 11.6% elderly were malnourished while 46% were at risk of malnutrition and only 42.4% were well nourished. Malnutrition and risk of malnutrition was more common in rural 104 (52.21%) , 47 (25.41%) than urban 126 (40%), 11 (
malnutrition according to literacy status as Illiterate, literature, primary, middle, secondary, college and professional was 26.03%, 8.47%, 0%,6.15%, 3.89%, 2.06% and 0% respectively. Prevalence of malnutrition according to financial status, self dependent and depend on others was 6.85% and 17.48% respectively. Prevalence of malnutrition in relation to BMI <19, 19
(47.11%), 9 (9.67%), 0 (0%) respectively.
Conclusion: Nutritional status declines further as the age advances. Nutritional status of our urban elderly was better than nutritional status of rural elderly. Illiteracy depended on other by financial status and low BMI worsen the nutritional status significantly in elderly, Nutritional evaluation should be a part of clinical assessment of elderly.
is an open access article distributed under the Creative Commons Attribution License, which permits distribution, and reproduction in any medium, provided the original work is properly cited.
the increase, both in developed and , 1992). Aging is associated with various physiological changes and needs, which make elderly people vulnerable to malnutrition . Malnutrition is both a common condition and serious health problem among the elderly. It increases
and mortality (Persson among the elderly, is often accompanied by anorexia, and it is also a risk factor for osteoporotic fracture 2003). The prevalence of malnutrition varies considerably depending on the ria used for the diagnosis Available data for malnutrition worldwide shows that the prevalence of malnutrition as rated by the Mini Nutritional Assessment short form (MNA-SF) 8% for those living in a institutionalized elderly
Departments and institutions Department of Medicine, SP Medical
and 0–74% for the hospitalized and institutionalized elderly (Guigoz, 2006). Although good nutrition is beneficial both for health and the ability to resist and recover from disease, malnutrition leads to dependency
Dependency interferes with the health and quality of life, not only for the elderly, but also for relatives and health
providers (Millán-Calenti et al
evidence that malnutrition is more common in geriatric population but it is underestimated in
therapeutic procedures. A number of studies have pointed out that physicians often overlook this problem and so fail to treat malnutrition in elderly patients. Reversible causes of malnutrition such as depression and medication induced anorexia are usually under recognized and under treated
(Baweja et al., 2008).
The MNA-SF is a validated questionnaire for simple and rapid assessment of the nutritional status of elderly people.
easy to administer and non-invasive, and is widely used to detect those who could be assisted by early nutritional intervention. Therefore, it should be integrated into a comprehensive geriatric assessment
International Journal of Current Research
Vol. 6, Issue, 11, pp.10253-10257 November,2014
STUDY OF NUTRITIONAL STATUS IN ELDERLY IN INDIAN POPULATION
L, Singh Kusum, Meena Neelam,
Department of Medicine, SP Medical College, Bikaner Rajasthan, India
: Nutrition is an important factor contributing to health and functional ability. There is definite evidence that malnutrition is more common in geriatric population but it is underestimated in
: The present study was carried out to assess nutritional status in elderly population aged
It was a cross sectional study of 500 elderly subjects of age ≥65 years (63% subjects from urban and 37% subjects from rural area). Nutritional status assessment was done by using 18 items (30 points) Mini nutritional assessment (MNA) scale.
Present study revealed that 11.6% elderly were malnourished while 46% were at risk of malnutrition and only 42.4% were well nourished. Malnutrition and risk of malnutrition was more common in rural 104 (52.21%) , 47 (25.41%) than urban 126 (40%), 11 (3.49%) respectively. malnutrition according to literacy status as Illiterate, literature, primary, middle, secondary, college and professional was 26.03%, 8.47%, 0%,6.15%, 3.89%, 2.06% and 0% respectively. Prevalence of status, self dependent and depend on others was 6.85% and 17.48% respectively. Prevalence of malnutrition in relation to BMI <19, 19-23, >23kg/m2 was 49
vances. Nutritional status of our urban elderly was better than nutritional status of rural elderly. Illiteracy depended on other by financial status and low BMI worsen the nutritional status significantly in elderly, Nutritional evaluation
ribution License, which permitsunrestricted use,
74% for the hospitalized and institutionalized elderly Although good nutrition is beneficial both for health and the ability to resist and recover from disease,
malnutrition leads to dependency (Ghisla et al., 2007).
s with the health and quality of life, not only for the elderly, but also for relatives and health-care
et al., 2000). There is definite
evidence that malnutrition is more common in geriatric population but it is underestimated in diagnostic and therapeutic procedures. A number of studies have pointed out that physicians often overlook this problem and so fail to treat malnutrition in elderly patients. Reversible causes of malnutrition such as depression and medication induced exia are usually under recognized and under treated
SF is a validated questionnaire for simple and rapid
assessment of the nutritional status of elderly people.5, 8 It is
invasive, and is widely used to detect those who could be assisted by early nutritional intervention. Therefore, it should be integrated into a comprehensive geriatric assessment (Vellas and Guigoz, 1995).
The present study was carried out to assess nutritional status in elderly. Population aged 65 years or above and to study the impact of age related patho-physiological changes on nutritional status.
MATERIAL AND METHODS
It was a cross sectional study of 500 elderly subjects of age 65 years or above (63% subjects from urban area and 37 % subjects from rural area). This study was conducted in the Geriatric clinics during September 2009 to march 2011. Most of the elderly persons visited the clinics; however camps were made in Bikaner city and rural area for those who were unable to attend it. A door to door survey was carried out by geriatric social workers in the randomly selected wards and a list of households having individuals aged ≥65 was prepared using voter’s ID list. Individuals to be interviewed and sampled will be selected by systematic random sampling method i.e. every 2nd individual from the list of all individual aged 65 and above. The house to house survey was conducted in the selected households. Consent from patients was also taken before filling Performa on consent form. For this study, permission also taken from medical ethics board of the medical
college. Nutritional status assessment (Guigoz et al., 1994) was
done by using 18 items (30 points) Mini nutritional assessment (MNA) scale which included questions regarding appetite, Weight, mobility, acute and chronic illness, medication history, dietary history, anthropometric measurements (BMI, MAC, MCC) and self perception of nutritional status and health. Interpretation of scores was done as follows:
Score <17: Malnourished
Score 17-23.5: At risk of malnutrition Score - 23-5: Well nourished.
All the subjects were interviewed for demographic profile, present, past, occupational, family, personal and social history, thorough clinical examination was performed. Anthropometric measurements like weight, height, mid arm circumference (MAC) and maximum calf circumference (MCC) were recorded and BMI was calculated. Sample size- sample size calculation was done by calculator of open epi statical website.500 sample was taken in this study.
Statistical analysis
Data was statistically analyzed using SPSS for windows version 10. Z-test was performed to evaluate normality of distribution. Chi-squared test or χ² test was used for comparing groups of data. A p value of <0.05 was taken to indicate statistical significance.
RESULTS
[image:2.595.304.564.69.103.2]The present study shows that 500 subjects in which 58 (11.6%) elderly were malnourished 230 (46%) were at risk of malnutrition and only 212 (42.4%) were well nourished and male were 315 and female were 183 (Table 1). Prevalence of malnutrition and risk of malnutrition was more common in female 90 (48.64%), 28 (15.13%) than male 140 (44.44%), 30 (9.52%) respectively. (Table 2.) Urban and rural patients
Table 2. Prevalence of nutritional status male and female…
No malnutrition (%)
At risk of malnutrition (%)
Malnourished (%)
Male (316) 146(46.34) 140(44.44) 30(9.52)
Female (184)
66(35.67) 90(48.64) 28(15.13)
Total (500) 212(42.40) 230(46.0) 58(11.6)
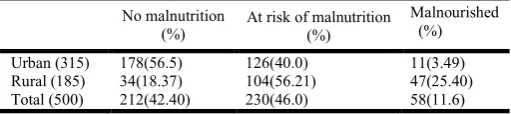
Table 3. Prevalence of nutritional status urban and rural…
No malnutrition (%)
At risk of malnutrition (%)
Malnourished (%)
Urban (315) 178(56.5) 126(40.0) 11(3.49)
Rural (185) 34(18.37) 104(56.21) 47(25.40)
Total (500) 212(42.40) 230(46.0) 58(11.6)
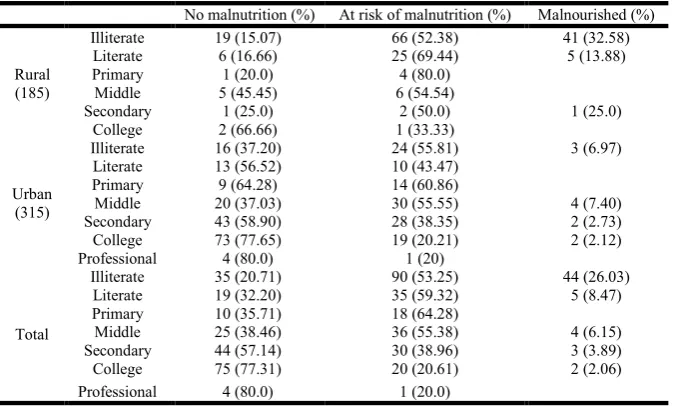
were 315 and 185 respectively. Malnutrition and risk of malnutrition was more common in rural 104 (52.21%), 47 (25.41%) than urban 126 (40%), 11 (3.49%) respectively. (Table 3) Malnourished was more in lower class (BPL) 28 (36.84%) than upper class (lower middle) 5 (10.20%) (χ²=10.87, p=0.03). At risk of malnutrition was increasing with decreasing socio economic classes significantly (χ²=40.80 P=0.001). Prevalence of malnutrition in smokers, ex-smokers, tobacco- chewers and non-addicts was 20.25%, 13.38%,0% and 8.30% respectively . At risk malnutrition in smokers , ex-smokers , tobacco-chewers and non addicts was 48.10% , 47.88%,50.0% and 44.40% respectively .Smokers were more at risk of malnutrition compared to non-smokers (χ²=9.11 P=0.01). Prevalence of malnutrition according to financial status, self dependent and depend on others was 6.85% and 17.48% respectively which was significant. (χ²=13.42 P=0.0001). (Table 4) Malnutrition according to occupation as cultivator, labour, skilled labour, own business, service and other was 25.0%, 14.28%, 3.12%,2.77%,3.70%,and 0% respectively which was significantly (χ²=45.37 P=0.001). At risk of malnutrition according to occupation as cultivator, labour, skilled labour, own business, service and other was 55.26%,58.44%, 53.12%, 55.55%, 25.92% and 40.0% respectively which was significantly difference (χ²=39.70 P=0.001). (Table 5) Prevalence of malnutrition according to literacy status as Illiterate, literature, primary, middle, secondary, college and professional was 26.03%, 8.47%, 0%,6.15%, 3.89%, 2.06% and 0% respectively which was significantly different (χ²=41.92 P=0.001). At risk of malnutrition according to literacy status as Illiterate, literature, primary, middle, secondary, collage and professional was 53.25%, 59.32%, 64.28%, 55.38%, 38.96%, 20.61%, and 20.0% respectively which was significantly difference (χ²=41.92 P=0.001). Malnutrition more in illiterate than educated. (Table 6). Prevalence of malnutrition in relation to
BMI <19, 19-23, >23kg/m2 was 49 (47.11%), 9 (9.67%), 0
[image:2.595.304.562.141.206.2](0%) respectively. Prevalence of at risk of malnutrition was 54 (51.92%), 46 (49.46%), 130 (42.90%). thus as BMI increases risk of malnutrition decreases. (Table 7).
Table 1. Prevalence of nutritional status
No Malnutrition (%)
At risk of Malnutrition (%)
Malnourished (%)
Total (500) 212(42.40) 230(46.0) 58(11.6)
[image:2.595.305.561.237.294.2]Table 4. Prevalence of nutritional status in relation to Financial status
No malnutrition(%) At risk of malnutrition (%) Malnourished (%)
Rural (185) Depend on others (132) Self dependent (53) 13 (24.53) 30 (56.60) 10 (18.86)
22 (16.66) 73 (55.30) 37 (28.03)
Urban (315) Self Dependent (224) 142 (63.39) 73 (32.58) 9 (4.01)
Depend on others (91) 36 (39.56) 53 (58.24) 2 (2.19)
Total (500) Self dependent (277) 155 (55.95) 103 (37.18) 19 (6.85)
Depend on others (223) 57 (26.00) 126 (56.50) 39 (17.48)
[image:3.595.122.475.214.389.2]χ²=18.85 P=0.0001 χ²=13.42 P=0.0001
Table 5. Prevalence of nutritional status in relation to occupation
No malnutrition (%) At risk of malnutrition (%) Malnourished (%)
Rural (185)
Cultivator 18 (13.95) 75 (58.13) 36 (27.90)
Labour 8 (23.52) 17 (50.0) 9 (26.47)
Skilled Labour 1 (33.33) 1 (33.33) 1 (33.33)
Own business 4 (28.57) 11 (71.42) 0 (00.0)
Service 3 (60.0) 1 (20.0) 1 (20.0)
Urban (315)
Cultivator 12 (52.17) 9 (39.13) 2 (8.69)
Labour 13 (30.23) 28 (65.11) 2 (4.65)
Skilled Labour 13 (44.82) 30 (51.72) 0(00.0)
Own business 26 (44.82) 30 (51.72) 2 (3.44)
Service 111 (70.70) 41 (26.11) 5 (3.18)
Other 3 (60.0) 2 (40.0) 0 (00.0)
Total (500)
Cultivator 30 (19.73) 84 (55.26) 38 (25.0)
Labour 21 (27.27) 45 (58.44) 11 (14.28)
Skilled Labour 14 (43.75) 17 (53.12) 1 (3.12)
Own business 30 (41) 40 (55.55) 2 (2.77)
Service 114 (70.37) 42 (25.92) 6 (3.70)
Other 3 (0.0) 2 (40.0) 0 (00.0)
χ² = 39.70 P=0.001 χ²= 45.37 P=0.001
Table 6. Prevalence of nutritional status in relation to education
No malnutrition (%) At risk of malnutrition (%) Malnourished (%)
Rural (185)
Illiterate 19 (15.07) 66 (52.38) 41 (32.58)
Literate 6 (16.66) 25 (69.44) 5 (13.88)
Primary 1 (20.0) 4 (80.0)
Middle 5 (45.45) 6 (54.54)
Secondary 1 (25.0) 2 (50.0) 1 (25.0)
College 2 (66.66) 1 (33.33)
Urban (315)
Illiterate 16 (37.20) 24 (55.81) 3 (6.97)
Literate 13 (56.52) 10 (43.47)
Primary 9 (64.28) 14 (60.86)
Middle 20 (37.03) 30 (55.55) 4 (7.40)
Secondary 43 (58.90) 28 (38.35) 2 (2.73)
College 73 (77.65) 19 (20.21) 2 (2.12)
Professional 4 (80.0) 1 (20)
Total
Illiterate 35 (20.71) 90 (53.25) 44 (26.03)
Literate 19 (32.20) 35 (59.32) 5 (8.47)
Primary 10 (35.71) 18 (64.28)
Middle 25 (38.46) 36 (55.38) 4 (6.15)
Secondary 44 (57.14) 30 (38.96) 3 (3.89)
College 75 (77.31) 20 (20.61) 2 (2.06)
Professional 4 (80.0) 1 (20.0)
χ² = 41.92 P=0.001 χ²= 46.70 P=0.001
Table 7. Prevalence of nutritional status in relation to BMI
BMI (kg/m2 ) No malnutrition (%) At risk of malnutrition (%) Malnourished (%)
<19 1 (00.96) 54 (51.92) 49 (47.11)
19-23 38 (40.86) 46 (49.46) 9 (9.67)
>23 173 (57.09) 130 (42.90) 0 (0)
Total (500) 212 (42.40) 230 (46.00) 58 (11.60)
[image:3.595.132.469.434.637.2] [image:3.595.138.458.683.734.2]DISCUSSION
The present study analyzed the nutritional status of elderly people in the Indian population. The MNA score showed that approximately that 11.6% elderly were malnourished while 46% were at risk of malnutrition and only 42.4% were well nourished. The major reason for these findings may be attributed to the various causes of malnutrition in elderly patients which are also more prevalent in elderly and increases with age. An overall reduction in appetite, alteration in taste, smell and subsequent decrease in the intake of nutrients are parts of aging, In addition to its other factors malnutrition include oral health, physical impairments, early satiety, and chronic diseases; poor dentition and physical immobility can cause difficulty with food acquisition chewing food and swallowing, leading to a decrease in nutrient intake, early satiety and physiological appetite loss. Another study carried
out in Chinese Inpatients by Lei et al. (2009) using the 18
items of the MNA scale, found that 19.6 % of the elderly were malnourished (vs. 11.6% in the present study), with 53.2% at risk of malnutrition (vs. 46 % in the present study), and 27.2 % with a good nutritional status (vs. 42.4 % in the present study). Possible reasons for the discrepancy are that the socioeconomic conditions are quite different. Similar trends of malnutrition
were present in study by (Maliheh Aliabadi et al., 2008).
Present study revealed that prevalence of malnutrition and at risk of malnutrition was more common in female than male (15.13% vis 9.52%) and (48.64% vis 44.44%) respectively. More females were found with malnutrition than males. we strongly feel that the higher prevalence of malnutrition in women in the present study could partly be a result of the effect of the traditional habits of eating. In many families, men usually eat before women. Women first serve the men. Women are the last people to eat, and share the remaining food. As their portions are smaller, this might result in poor nutrition. Similar trends of malnutrition were present in study by
(Maliheh Aliabadi et al., 2008; Rodriguez et al., 2005).
Present study revealed that Rural elderly were more malnourished (25.4%) and at risk of malnutrition (56.21 %) than urban elderly (3.49% and 40.0% respectively). Similar trends of malnutrition were present in study by Aliabadi
et al. (Maliheh Aliabadi et al., 2008) and Baweja et al. (2008)
in western Rajasthan, Nutritional status of urban elderly population was comparable with that of developed countries while that of rural population was worse. We feel that rural population are more physical hardworking than urban and their diets are limited in variety. Present study revealed that prevalence of malnutrition and at risk of malnutrition was more common in those dependent on others than self dependent (17.56% v/s 6.94%) and (68.85% v/s 40.0%) respectively. There is mostly elderly are living in India are separately or living with family but avoid by their family members. Similar trends of malnutrition were present in study by (Maliheh
Aliabadi et al., 2008), and (Tamanna Ferdous et al., 2009)
Among elderly having BMI <19 significantly higher (p<0.0001) was the prevalence of malnutrition (47.11 %) than those having BMI 19 to < 23 (9.67%) or > 23 (0%). At risk of malnutrition were also more among those having BMI < 19 (51.92%) than those with BMI 19 to < 23 (49.46%) or > 23
(42.90%). Similar relationship between nutritional status and
BMI was also found by Baweja et al. (2008) in their studies.
This needs further studies and immediate attention in terms of lifestyle modification and health education.
Present study revealed that prevalence of malnutrition according to occupation as Cultivator, Labour, Skilled labour, own business, service and others were 25.0%, 14.28%, 3.12%, 2.77%, 3.70% and 0% respectively. Prevalence of at risk or malnutrition according to occupation as Cultivator, Labour, Skilled Labaur. Own business, Service and Others was 55.26%, 58.44%, 53.12%, 55.55%, 25.92% and 40.0 % respectively. More risk of malnutrition in Cultivator and Labour than others. Cultivator and labour are more physical hardworking and less aware to their diet than own business and service persons. Similar trends of malnutrition were present in study by
(Maliheh Aliabadi et al., 2008). Present study revealed that
prevalence of malnutrition according to literacy status as Illiterate, Literate, Primary, Middle, Secondary, College and Professional was 26.03%, 8.47%, 0%, 6.15%, 3.89%, 2.06% and 0% respectively). Thus prevalence of malnutrition more in illiterate than educated. Similar trends of malnutrition were
present in study by (Maliheh Aliabadi et al., 2008) and
(Tamanna Ferdous et al., 2009).
Conclusion
The overall prevalence of malnutrition and at risk of malnutrition in our study was 11.6% and 46% respectively. There was a difference in prevalence by gender (9.52% v/s 44.44%) were men and (15.13% vis 48.64%) were women. The overall prevalence of malnutrition and at risk of malnutrition in urban was (3.49% vis 40%) and in rural was (25.40% v/s56.21%) respectively. The prevalence tend to increase with age in our study. Prevalence tend to increase in depend on others than self dependent by financial status. Female sex, illiterate, cultivator, labour and low BMI were associated with higher prevalence of malnutrition in our study.
REFERENCES
Baweja, S., Agarwal, H., Mathur, A., Haldiya, K. R. and Mathur, A. Assessment of Nutritional Status and Related
Risk Factors in Community Dwelling Elderly Rajasthan. J.
Ind. Acad. Geriatr., 2008. 4:5-13.
Gerber, V., Krieg, M.A., Cornuz, J., Guigoz, Y., Burckhardt, P. Nutritional status using the Mini Nutritional Assessment questionnaire and its relationship with bone quality in a
population of institutionalized elderly women. J. Nutr.
Health. Aging., 2003. 7: 140–145.
Ghisla, M.K., Cossi, S., Timpini, A., Baroni, F., Facchi, E. and Marengoni, A. Predictors of successful rehabilitation in geriatric patients: subgroup analysis of patients with
cognitive impairment. Aging. Clin. Exp. Res., 2007; 19:
417–423.
Guigoz, Y. The Mini Nutritional Assessment (MNA) review of
the literature –what does it tell us? J. Nutr. Health Aging.,
2006. 10: 466–485.
Guigoz, Y., Vellas, B. and Garry, P.J. Assessing the nutritional status of the elderly: the Mini Nutritional Assessment as
part of the geriatric evaluation. Nutr Rev., 1996. 54: S59–
S65.
Guigoz, Y., Vellas, B. and Garry, P.J. Mini Nutritional Assessment: practical assessment tool for grading the nutritional state of elderly patients. Facts an Research in
Gerontology. Supplement, 1994. 2: 15-59.
Joosten, E., Vanderelst, B., Pelemans, W. The effect of different diagnostic criteria on the prevalence of malnutrition in a hospitalized geriatric population. Aging (Milano) 1999. 11:390–394.
Kinsella, K., Suzman, R., Demographic dimensions of
population aging in developing countries. Am. J. Hum.
Biol., 1992. 4: 3–8.
Lei, Z., D Qingyi, G Feng, W Chen, R Shoshana Hock, W Changli.Clinical Study of Mini-Nutritional Assessment for
Older Chinese In patients. J. Nutr. Health. Aging., 2009.
13 (10):871-875.
Maliheh Aliabadi, MSc 1, Masood Kimiagar, PhD5, Majid Ghayour- Mobarhan Mohammad Taghi Shakeri PhD3,
Mohsen Nematy MD PhD4, Ali Akbar IJaty MD1 et al.
Prevalence of malnutrition in free living elderly people in
Iran: a cross-sectional study Asia. Pac. J. Clin. Nutr.,
2008. 17 (2):285-289.
Meydani, M. Nutrition interventions in aging and
ageassociated disease. Ann N Y Acad. Sci., 2001. 928:
226–235.
Millán-Calenti, J.C., Gandoy-Crego, M., Antelo-Martelo, M., Mayán-Santos, J.M. Helping the family carers of Alzheimer’s patients: from theory to practice. A
Preliminary study. Arch Gerontol Geriatr., 2000. 30:
131–138.
Persson, M.D., Brismar, K.E., Katzarski, K.S. and
Nordenstrom, J., Cederholm, T.E. Nutritional status using mini nutritional assessment and subjective global
assessment predict mortality in geriatric patients. J. Am.
Geriatr. Soc., 2002. 50:1996–2002.
Rodrfguez, N., Hernimdez, R., Herrera, H., Barbosa, J.
Hernandez-Valera, Y. Nutritional status of
institutionalized Venezuelan elderly. Invest Clin., 2005.
Sep;46(3 ):219-28.
Sullivan, D.H., Walls, R.C. The risk of life-threatening complications in a select Population of geriatric patients:
the impact of nutritional status. J. Am. Coll. Nutr., 1995;
14: 29–36.
Tamanna Ferdous, Zarina Nahar Kabir, Ake Wahlin. Kim S, Tommy C. The multidimensional background of malnutrition among rural older individuals in Bangladesh -
a challenge for the Millennium Development Goal. Public
Health Nutr., 2009. Mar 4; 1-9.
Vellas, B., Guigoz, Y. Nutritional assessment as part of the geriatric evaluation. In: Rubenstein LZ, Bernabei R,Wieland D, eds. Geriatric Assessment Technology: State of the Art. Milano: Kurtiz Publishing Company, 1995. 179–194.