On Cost and Energy Efficiency of Security in Cloud
Computing
Thompson A. F.
Computer Science Department Federal University of Technology, Akure, Nigeria
Olofinlade F. V.
Security and Threat Intelligence Operations
www.esentry.xyz
Bello B.
Computer Science Department Federal University of Technology, Akure, Nigeria
ABSTRACT
Clouds are virtualized datacentres and applications offered as services. Cloud datacentre hosts hundreds of servers with software and hardware constituents that requires huge amount of energy for its operation. This poses energy consumption challenge, as well as server consolidation and data security due to the required technologies. This study, therefore, focuses on the cost effectiveness and energy efficiency of securing the cloud. Cost, in this context, is the continuous efforts made by cloud vendors in maintaining and ensuring that cloud infrastructures are equipped with state-of-the-art facilities that are energy efficient and conform to Power Usage Effectiveness (PUE), Service Level Agreements (SLAs) and Quality of Service (QoS) standards. Various factors that causes inefficiency in the cloud are considered in addition to conducts that ensure cost effective and energy efficient security in the cloud were evaluated using cloudsim and cloudreports, toolkits for modelling and simulating cloud environment as well as the feasibility of reducing the energy consumed in datacentres. The experimental results using Power Usage Effectiveness (PUE) and DataCentre Infrastructure Efficiency (DCIE) techniques for analyzing the energy consumed in datacentres demonstrates enhanced cloud productivity is achievable with reduced energy consumption in datacentres.
General Terms
Green Computing, Cloud computing, Cloud security
Keywords
Energy, Cost, Security, Quality of Service (QoS), Power Usage Effectiveness (PUE), DataCentre Infrastructure Efficiency (DCIE)
1.
INTRODUCTION
Energy efficiency and security are two dissimilar entity, yet they work in tandem to determine the efficient functionality of any datacentre. Major challenges experienced in cloud datacentres is minimizing the heat and energy used by cloud infrastructures as well as securing these infrastructures from threats. Apparently, Cloud computing has become an appealing model for managing and delivering services over the internet. It appeals to business owners due to its ability to eliminate recurring cost of running and maintaining computing resources such as networks, servers, storage. In addition, business owners are able to request for computing resources in small measure and then expand their resources as business service demand increases. The most recent appearance of Cloud computing has a meaningful and influential effect towards achieving utility computing model since it is strongly driven by cloud vendors that provide services on large-scale production. [1] opined that Cloud computing promises to deliver reliable services through
next-generation datacentres built on virtualized computer and storage technologies. Consequently, users are endowed with the right to access data and applications from the internet anywhere in the world following the pay-as-you-go financial model. Resource use can be controlled, monitored, and reported, ensuring transparency for both the provider and consumer of the utilized service [2].
Established cloud computing technologies of private, community, public and hybrid have been considered as the existing deployment models of cloud systems, to this end, energy efficiency and security (protection) of cloud datacentre infrastructures form the focus of this study. The composition of various technologies such as networks, databases, operating systems, virtualization, memory management, resource scheduling, concurrency control, load balancing, and transaction management contributes immensely to the numerous security issues in the cloud. [3] discussed that a cloud is safe only when the service vendor take necessary precautions to protect consumers data and cloud infrastructure. It implies that once the safety of a cloud is tampered with either at cloud user or cloud provider level, the integrity and privacy of sensitive data stored is affected. Thus, the need to prioritize protection. However, to ensure protection at user level, optimal security must be achieved to protect cloud infrastructures housed in datacentre.
Unauthorized persons are restricted from accessing datacentre using physical measure such as biometrics, access control, and Closed-Circuit Television (CCTV). Fault tolerance (in terms of hardware, data and time redundancy), risk assessment and risk mitigation should also be checked to ensure protection of datacentre infrastructures at service provider or vendor level. Security mechanism such as authentication (use of strong passwords), confidentiality, authorization, integrity, availability and non-repudiation can also be employed in protecting data at user level [4].
2.
ESSENTIALS OF COST AND
ENERGY IN CLOUD DATACENTRES
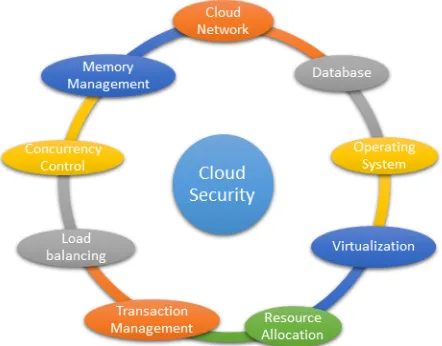
infrastructures which comprise of networks, servers, storage, network bandwidth, electric grid. According to [5], estimates shows that power consumption in datacentre has nearly quadrupled in the past decade, as more and increasingly powerful servers are used online to answer search queries, stream audio and video content, perform analysis and forecasting, and complete online transactions in almost every sector of the society. The use of cloud computing has increased inadvertently, giving concerns about an imminent datacentre energy and security crisis. [3] also pointed out some parameters that affects cloud security as shown in Fig. 1, putting cloud datacentre at risk if not properly handled.
Fig. 1: Parameters affecting Cloud security
Hence, efficient energy model is required for optimizing effective infrastructure in other to decrease operational costs while keeping in order the necessary conditions that ensures Quality of Service (QoS). Optimization of energy can be accomplished by putting resources together; such as efficient virtual network topologies current utilization, and thermal status of computing hardware and nodes [6].
2.1 Inefficiency in Datacentre
High rate of energy dissipated seems to be the major reason for inefficiency in datacentres, but, there are other factors and sources that causes these inefficiencies, which are:
2.1.1
Energy non-proportional servers
A datacentre comprises of thousands of server machines, working in tandem to provide services to the clients. Systems should ideally exhibit energy proportionality, [5], but servers, for instance, consume power in proportion to their load. Present servers are far from energy proportionality because they use up to 80% of peak power even at 20% utilization, contributing majorly to energy inefficiency in a datacentre. Facts from other researchers are that servers are often utilized between 10 to 50% of their peak load and that servers experience frequent idle times or rather short duration which increase this issue in the datacentres. In summary, energy non-proportionality in servers means that servers are not functioning up to their best most, comparing the trade-off points between power and performance, and that idle times in servers consume a big portion of the peak power [7].
2.1.2
Over-provisioned server and power
infrastructure
A typical datacentre is provisioned to handle peak workload, which occurs fairly infrequently, hence datacentres are always oversized. This custom causes underutilization of server hardware, which in turn contributes to the unusual power
consumption in datacentres. As a result, large fraction of the energy consumed by datacentre is due to resource overprovisioning. If servers were energy proportional, over-provisioning would not be a bottleneck. Peak power provisioning, demands that servers draw their maximum power at the same time, this has been known to cost a lot. In summary, provisioning as a basis for nominal ratings of servers greatly under-utilize power infrastructure [8].
2.1.3
Energy-inefficient server hardware
A written whitepaper by Dell Technology (2010), stated another key factor for energy inefficiencies in datacentres is because they are filled up with old server hardware that is inefficient in energy. Replacing obsolete facilities and equipment in datacentre with recent, improves the efficiency of energy in such datacentre. However, cloud providers avoid setting up new infrastructure, putting pressure on inefficient facilities.
2.1.4
Poor power management
Active servers may provide higher performance than its required workload contributing to energy inefficiencies in datacentres [5]. Unfortunately, performance (that is low latency or high throughput) is achieved at super linear cost in energy consumption. So servers working harder than they should can contribute to energy inefficiency. Power management is an important factor because of energy non-proportionality of recent servers. Also, allocation of server resources to clients or assigning of tasks to servers may result in server utilization inefficiencies.
2.1.5
Multiple power conversions and low
Uninterruptible Power Supply (UPS) efficiency
[5] justified that the need for multiple power conversions in a datacentre’s power distribution system is another reason for datacentres energy inefficiency. Particularly, Alternating Current (AC) coming from the grid is first connected to Direct Current (DC) so that it can be used to charge the battery backup system. The output of this electrical energy storage system then goes through an inverter to produce AC power, which is distributed throughout the datacentre. Finally, the AC power is converted to various DC volts to support various subsystems of a blade server. The conversions are required for the oversized and highly redundant UPS modules, deployed in datacentres for voltage regulation (i.e. to remove power spikes) and power backup (e.g. in case of power failure). Note that most UPS modules in a datacentre operate at 10-40% of their full load capacity only. Unfortunately, at these low load levels, the UPS conversion efficiency is quite low.
2.1.6
Energy
cost
of
cooling
and
air
conditioning units
2.2 Green Computing Techniques for
Energy Efficiency
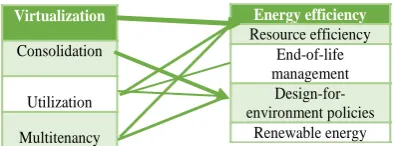
[image:3.595.63.260.188.261.2]Understanding ways in which power consumption impacts the “greenness” of any technology, specifically computing, is an essential step toward reducing consumption and educating others [10]. The consolidation of Virtual Machines, Virtual Machine migration, scheduling, demand projection, heat management and temperature-aware allocation, and load balancing are used as basic techniques for minimizing power consumption as represented in Fig. 2.
Fig. 2: Energy efficiency techniques
Consolidation helps to manage the trade-off between performance, resource utilization, and energy consumption, [10]. Similarly, Virtual Machine migration allows flexible and dynamic resource management while facilitating fault management and lower maintenance cost. Multiple levels of abstractions makes it hard to maintain deployment data of each virtual machine within a Cloud datacentre. Thus, various indirect load estimation techniques are used for consolidation of Virtual Machines.
Alternative techniques used to reduce power consumption and overcome datacentre inefficiency was identified by [11] and [5], which include:
i. Upgrading or replacing datacentre equipment with more powerful and energy efficient servers which uses more advance internal cooling systems, engineered to optimize airflow to cool internal components with less power consumption. These servers use front-to-back cooling with straight-through airflow, and their fan speeds are modulated by measured internal temperatures.
ii. Optimal power management and power distribution solutions.
iii. Maximizing cooling efficiency by deploying Computer Room Air Conditioning (CRAC) units, and air handling units such as chillers, chilled water pumps and cooling tower fans.
iv. Turning off equipment when not in use. v. Computer power saving modes. vi. Monitor sleep (stand by) mode. vii. Hard disk sleep mode. viii. System standby mode.
ix. Hibernate mode.
2.3 Related Works
A survey on energy efficiency in cloud computing reports that cloud computing-based can reduce IT capital costs and labour costs, as well as enhance productivity. However, [12] argued that energy consumption is not only determined by hardware efficiency, but also depends on the resource management system deployed and the efficiency of applications running in the system. Energy efficiency impacts end-users in terms of resource usage costs, determined by the Total Cost of Ownership (TCO) incurred by a resource provider. High power consumption, such as cooling system and power infrastructure, results in boosted electricity bills.
With the growth of computer components density, the cooling problem becomes crucial, as more heat has to be dissipated. The authors aimed to design, implement and evaluate a Green Scheduling Algorithm integrating a neural network predictor for optimizing server power consumption in Cloud computing. It is used to make decision to create and destroy virtual machines in servers, and turning servers off/on for energy savings. This mechanism saves up to 46.3% of power consumption. This paper also analyzed the resource provisioning and power or thermal management problems in datacentres. Also, reviews strategies that maximize the datacentre energy efficiency subject to total power consumption and thermal constraints meeting given Service Level Agreements (SLAs). [12] suggests that a more accurate datacentre efficiency metric should focus on estimating the actual amount of power used by the IT equipment to do useful work. This study proposed a simulation-driven methodology with the accurate energy model to verify its performance, and introduces a new resource scheduling algorithm Best-Fit-Decreasing-Power (BFDP) to improve the energy efficiency without degrading the Quality of Service of the system. The restraint of this study focused on the processor energy consumption but not the other components. Also, the Best-Fit-Decreasing-Power has the best performance in terms of efficiency but brings more Service Level Agreements violation, host shutdowns and Virtual Machine migrations. The paper proposed cloud computing with virtualization as a way forward to identify the main sources of energy consumption, and the significant trade-offs between performance, Quality of Service and energy efficiency. Considering the scale and complexity of Cloud data centres, [13] pointed out that reliability and energy efficiency are two major challenges that need careful attention and investigation. In cloud computing, failure occurs due to multiple reasons such as hardware failure, software failure etc. Hard disks failure is the most common failure that triggers the complete server failure. Alternatively, causes of software unavailability or failure are planned machine reboots, which includes the kernel version upgrades or other upgrades and reconfigurations. The electricity or energy consumption in cloud infrastructures is very inefficient and there are several types of wastes at different levels such as infrastructure level or system level. At the infrastructure level, half of the energy provided to a data centre is consumed by the cooling infrastructure and at system level, 50% of the energy is consumed when systems are in the idle state. This energy wastage in cloud based data centres can be harnessed by provisioning the resources in an energy efficient way. The existing techniques for reliability and energy efficiency was reviewed. It also identified the research gaps to combining the two metrics for resource provisioning in the cloud.
[14] proposed a scalable and flexible architecture for hybrid clouds with failure aware resource provisioning policies to decide whether the request from the user should be executed in the private cloud or public cloud to meet the Quality of Service (QoS) requirements. To deal with the resource failure during the execution, perfect check pointing fault tolerance mechanism was introduced so that the request is started from where it was left. [14] also proposed a cost-aware and failure-aware three step resource provisioning policy for hybrid clouds to enhance the capacity and performance of the local cluster in the presence of resource failure by decreasing the Average Weighted Response Time (AWRT). Tightly coupled applications such as Computational Fluid Dynamic (CFD) consisting of several tasks dependent on each other were used. Energy efficiency
Resource efficiency End-of-life management
Design-for-environment policies
Renewable energy
Virtualization
Consolidation
[13] only proposed solutions for reliability and energy efficiency of cloud computing platforms. The authors identified the need to propose a solution to reliability and energy efficiency of cloud services. The authors also identified the need of a reliability-aware and energy-aware resource provisioning policy to improve the availability of the services of cloud by reducing the energy consumption [13], it was concluded that the increase in the use of infrastructure and design complexity of clouds, result in high consumption of energy, leaving enormous carbon footprints. Thus, energy efficiency, reliability and scalability are among the foremost concerns in cloud computing these days. However, researchers are striving to optimize applicable solutions for the challenges.
Cloud computing technology can achieve communication, storage, processing, high performance, hosting and services on demand to cloud costumer. However, the combination of global warming and inconstant climate make the cost of energy a major challenge for the sustainability of Cloud Computing. [15] opined that data centre consumes energy and also produces carbon dioxide that riddles with IT inefficiencies and more power consumption requires more cooling, which affects the environment in a negative way by producing more carbon dioxide ( ). Data centre major components are thousands of server, however these servers consume huge energy without performing useful work. The main objective the research work focused on is increase in energy efficiency and reduction of emissions. To make cloud greener there are two ways, first improve energy efficiency of cloud, second use clean energy supply.
[15] used Power Usage Effectiveness (PUE) to measure if the data centre is green or not by measuring the efficiency of datacentre. PUE is calculated by dividing the total facility power by IT equipment power. The total facility power consists of power and cooling, while IT equipment power consists of server power, storage power and communication power. It was concluded from the literature review that previous techniques and approaches lack several features like Quality of Service and performance against energy efficiency. Additionally, the time complexity and the reduction of the energy consumption are not highly effective. This act as the limitation of this research work. However, an integrated datacentre energy efficiency framework which consider the social network applications as a vital factor in elevating energy consumption, as well as high potential for energy efficiency was suggested by [15]. The framework provides a platform on which the Green Cloud could be built. The required integrated datacentre energy efficiency framework should also be applicable in different types of datacentres including public, private and hybrid. In conclusion, energy efficient framework offers a great capability to deal with service levels, resources management and also improve scalability, elasticity, simplicity for management, delivery of cloud services and better reduction in datacentres energy consumption, even as it considers the Quality of Service for the users.
Supporting green cloud computing, providers need to minimize cloud infrastructure energy consumption while conducting the Quality of Service. One of the differences between cloud computing infrastructure and other computing infrastructures is the deployment of virtualization technology. Hence, the cloud has a virtualization layer, while the other computing systems (such as Grid computing) do not have such a layer [16]. Energy consumption model was proposed in this study for time-shared policy in virtualization layer. In the
proposed model, the cache interference costs were considered. These costs were based upon the size of data. The aim and objective of this research was to measure the cost and energy usage of time-shared policy and then model the cost in the CloudSim simulator. Based on the proposed model, various scenarios were simulated and the results indicated that the energy consumption is considerable. Hence, cloud providers have a trade-off between the response time and time-shared policy cost.
[3] defined Cloud Computing as the combination of a technology platform that provides hosting and storage service on the Internet. It shares resources on a larger scale which is cost effective and location independent. Its main goal is to provide scalable and inexpensive on-demand computing infrastructures with good quality of service levels. Cloud Computing architecture involves multiple cloud components interacting with each other and the various data they are holding, thus helping the user to get the required data at a faster rate. Cloud is more focused on front and back ends. The front end is the user who requires the data, whereas the back end is the numerous data storage device, server which makes the Cloud. Various parameters affecting cloud security includes cloud network, database, operating system, virtualization, resource allocation, transaction management, load balancing, concurrency control, and memory management. Security issues faced by cloud computing include data issues, secrecy issues, infected application and security issues at user and vendor level. Using a layered framework, [3] stated that this framework consists of four layers which assures security in cloud computing environment.
First Layer: Secure Virtual Machine Layer
Second Layer: Cloud Storage Layer, which has a storage infrastructure that integrates resources from multiple cloud service providers to build a massive virtual storage system. Third Layer: Cloud Data Layer
Fourth Layer: Virtual Network Monitor Layer. This handles problem such as logger examining by combining both hardware and software solutions in virtual machines.
Research should be centred on these gaps, differences and its removal; virtualization paradigm in cloud computing results in several security concerns, therefore mapping the virtual machines to the physical machines has to be carried out securely; encrypting data for data security as well as ensuring that appropriate policies are enforced for data sharing. In addition, resource allocation and memory management algorithms have to be secure. Finally, data mining techniques may be applicable to malware detection in clouds. Therefore, the cloud service providers and the cloud users should have a mutual understanding and the responsibility to ensure that the [17] provided a cost model for computing in different environments and also derived a dollar cost of primitives such as CPU cycles, storage and network transfers. Using this model, cloud end-to-end outsourcing was evaluated to derive the threshold principle defining when computing-related savings outweigh costs of networking. In addition, the authors modelled CPU cycles by exploring the cost of running computing at different levels or environments. The differences between cost of CPU cycles when outsourcing to single-client and multi-client was also considered.
hardware, energy, service, network hardware, and floor space). Major services offered by cloud providers include computation, network and storage. Observation discovered is that existing secure outsourced data query mechanisms are mostly cost-unfeasible because today’s cryptography simply lacks the expressive power to efficiently support outsourcing to untrusted clouds.
Using the datacentres in United States as a case study, [18] stated that datacentre owners are eager to save energy in any way to reduce their operational costs and global carbon emissions. This is because these datacentres consume about 1.5% of the total electricity generated, which is equivalent to the annual energy consumption of 5.8 million households and power costs of 4.5 billion per year. The authors therefore proposed some energy saving techniques and solutions that can be adopted to save energy in cloud datacentres. The methodology employed for saving energy in cloud datacentre includes workload prediction, Virtual machine placement, workload consolidation and resource over commitment. Workload prediction involves using clustering techniques to classify requests into multiple categories. This allows estimating and predicting future cloud workloads so as to appropriately decide whether and when physical machines need to be put to sleep and when they need to be awaken to accommodate new virtual machine requests. Virtual machine placement and workload consolidation allows placement of multiple requests coming from different clients on the same physical machine which enables to consolidate workloads on fewer servers, resulting in saving energy by turning to sleep as many servers as possible. Finally, resource over-commitment as a technique allocates virtual machine resources to physical machines in excess of their actual capacities, expecting that these actual capacities will not be exceeded since Virtual Machines are not likely to utilize their reserved resources fully. The limitation of this research is that each energy saving techniques proposed have some problems which may affect the goal of reducing power consumption in cloud datacentre. This technique offers opportunities as well as challenges to cloud computing.
Applying low-cost computing devices, high-performance network resources, huge storage capacity, semantic web technology, service oriented architecture, usage of application programming interfaces etc. have helped in the swift growth of cloud technology. The high demand for cloud based services resulted in the establishment of enormous data centres consuming high amount of electrical power. [6] therefore majored on energy efficient infrastructure model as well as considered performance bottlenecks for cloud datacentres. PUE and DCIE metrics were employed to calculate the amount of energy consumed by datacentre. The authors pointed that energy efficiency should not only be considered for host machines but all the components that makes up a complete cloud infrastructure. The researchers also asserted that power consumption can be reduced by the usage of energy efficient hardware, energy efficient resource scheduling, energy efficient clusters of servers, and energy efficient network infrastructure as this helps in reducing the impact of carbon footprint in the environment. However, the research work only consolidated areas of power management in cloud infrastructure leaving out scheduling algorithm, cluster configuration and energy-aware network protocols for further research.
3.
CLOUD DATACENTRE
[image:5.595.316.549.72.305.2]ARCHITECTURE
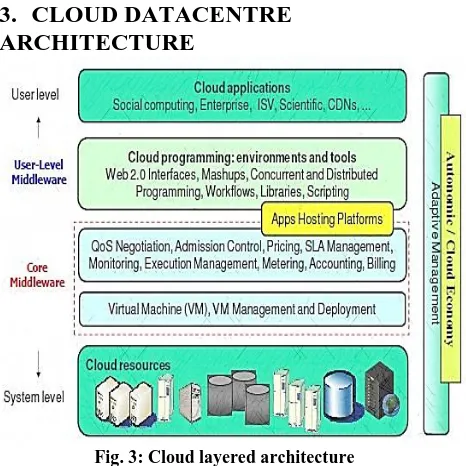
Fig. 3: Cloud layered architecture
User-Level Middleware: This layer includes the software frameworks such as Web 2.0 (Fig. 3) Interfaces (Ajax, IBM Workplace) that help developers in creating rich, cost-effecting user-interfaces for browser-based applications. It provides programming environments and composition tools that ease the creation, deployment, and execution of applications in clouds.
Core Middleware: Platform level service is implemented, providing runtime environment enabling Cloud computing capabilities to application services built using User-Level Middleware. Core services at this layer includes Dynamic SLA Management, Accounting, Billing, Execution monitoring and management, and Pricing. The well-known examples of services operating at this layer are Amazon EC2, Google App Engine.
System Level: Computing power in Cloud computing environments is supplied by a collection of datacentres, which are typically installed with hundreds to thousands of servers. At this level, there exist massive physical resources (storage servers and application servers) that power the datacentres. These servers are transparently managed by the higher level virtualization services and toolkits that allow sharing of their capacity among virtual instances of servers. These Virtual Machines (VMs) are isolated from each other, which aid in achieving fault tolerant behaviour and isolated security context.
3.1
Cloud Datacentre Components
[image:5.595.327.531.610.731.2]An alternate experiment with real infrastructure is utilizing simulation tools, opening possibilities of evaluating the hypothesis prior to software development in an environment where one can reproduce tests. In the case of cloud computing, where access to infrastructure incurs payments in real currency, simulation-based approaches allow evaluation of different kinds of resource leasing scenarios under varying load and pricing distributions. Such studies could aid providers in optimizing the resource access cost with focus on improving profits [19].
3.2
Cloudsim Design and Components
A. DataCenter: It models core infrastructure level services (hardware, software) offered by resource providers in a Cloud computing environmentB. Datacenter Broker: It models a broker that mediate between users and service providers depending on users’ QoS requirements and deploys service tasks across Clouds. C. SAN Storage: It models a storage area network commonly available to Cloud-based data centres for storing large chunks of data. .
D. Virtual Machine (VM): It models an instance of a VM, whose management during its life cycle is the responsibility of the host component.
E.
Cloudlet: It models the Cloud-based application services (content delivery, social networking, business workflow), commonly deployed in data centres. CloudSim represents the complexity of an application in terms of its computational requirements.
F. Cloud Coordinator: This abstract class provides federation capacity to a datacentre. It communicate with other peer CloudCoordinator services and Cloud Brokers (DataCenterBroker).
G. BandWidth Provisioner: It is an abstract class that models the provisioning policy of bandwidth to VMs that are deployed on a Host component.
H. Memory Provisioner: It is an abstract class that models the provisions of policy that allocate physical memory spaces to competing VMs.
I. Virtual Monitor Provisioner: This abstract class provision a policy that allocates VMs to Hosts by selecting available host in a datacentre, which meets the memory, storage, and availability requirement for a VM deployment. J. Virtual Machine Monitor Allocation Policy: It’s an abstract class implemented by a Host component to model policies (space-shared, time-shared) required for allocating processing power to VMs.
3.3
Cloudsim Simulation Procedure and
Data Flow
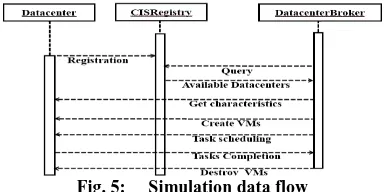
[image:6.595.332.525.71.167.2]At the beginning of the simulation, each datacenter entity registers itself with the Cloud Information Service (CIS) registry, as shown in Fig. 6. CIS provides database match-making services that maps user requests to suitable Cloud providers. Brokers acting on behalf of users consult the CIS service for list of Clouds offering infrastructure services that matches user’s application requirements. If there is a match, broker deploys the application with the Cloud that was suggested by the CIS. This communication flow relates to basic flow in a simulated experiment. Variations in this flow is possible depending on policies. For example, messages from Brokers to Datacentres may require a confirmation, from the part of the Datacentre, about the execution of the action, or the maximum number of VMs a user can create may be negotiated before VM creation.
Fig. 5: Simulation data flow
Computing the quantity of power consumed by data centres, two metrics, PUE and DCIE established by Green Grid [20], is adopted in this study. The formula for PUE and DCIE are given:
……….eq. (1)
The IT equipment power is the load provided to all computing hardware resources such as bandwidth, storage, memory, etc. while the total facility power includes energy facilities, power consumed by resources. A node with its parallel processing units, network topology, storage capacity and power supply unit in cloud infrastructure is often referred to as to as general multicore server. As a result of the cost and complexity involved in experimenting with real life environment of datacentre and in this study, random numbers were generated using mid-square algorithm. These random numbers are used for IT equipment power and total facility power, thus evaluating PUE and DCIE. The uniformity of these random numbers is done using Kolmogorov-Smirnov uniformity test.
4.
SYSTEM SIMULATION AND
EVALUATION
The components of the simulation are:
i. CloudSim: supports both system and behaviour modelling of Cloud system components such as data centres, virtual machines and resource provisioning policies. The CloudSim simulation layer provides support for modelling and virtualized Cloud-based data centre environments including dedicated management interfaces for VMs, memory, storage, and bandwidth. The simulator version used is cloudsim 3.0.3.
ii. CloudReports: provides an easy-to-use GUI and a rich reporting module. CloudReport is best used to simulate and evaluate cost of implementation, measuring resource utilization and power consumption. It simulates Infrastructure as a service provider with arbitrary number of datacentres. Each datacentre can be customized as per need. The user can easily set the amount of computational hosts and their resource configuration, which includes processing capacity, amount of RAM, available bandwidth, power consumption and scheduling algorithms (Joshi & Ranbhise, 2014).
Fig. 6: CloudReports Resource Utilization Graph
Fig. 7: CloudReports Power Consumption Graph
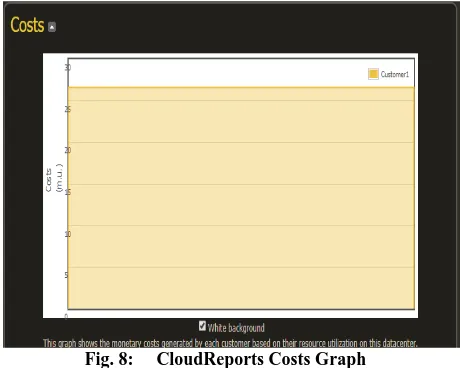
Fig. 8: CloudReports Costs Graph
4.1 SYSTEM EVALUATION
In CloudReports, user can create datacentre, number of hosts with capacity (MIPS), RAM. CloudReports generates HTML reports of each simulation and raw data files that can be easily imported by third-party applications. Users can also create simulation environments which consists of hosts with processing capacity (MIPS), RAM (Mb), and bandwidth (Mbps) of desired configuration. Figures 6-8, show the graph
of resource utilization, power consumption and cost respectively in cloud reports, which is the main focus of this study.
4.1.1 Energy consumption analysis based on time
The results at a particular datacentre simulation analysis for ten host machines (servers) were generated. When users request for services (for example, SaaS) from the cloud, resources such as bandwidth, memory, storage etc. are also released. It was observed that the higher the number of cloudlets requested by users, the higher the time used in servicing these requests, leading to increase in the power consumption of the host machines. In summary, the analysis above proves energy efficiency is an important factor that cloud service providers need to consider when setting up host machine in datacentre.4.2.2 Energy Consumption analysis based on PUE
and DCIE
PUE and DCIE are metrics for measuring the efficiency of the energy used by cloud infrastructure in datacentre, especially the energy used by computing resources rather than cooling equipment, lighting, and other overhead. These metrics were put together by an association of IT professionals called The Green Grid. PUE is the ratio of total facility power to the IT equipment power, while DCIE is the inverse of PUE. According to research, an ideal PUE is 1.0 with DCIE of 100%, while an average PUE is btw 1.8 - 2.0 with DCIE of 55% - 50% respectively. Table 1 shows the level of efficiency for a range of PUE and DCIE values.
Table 1 PUE and DCIE range for determining Level of Efficiency
PUE DCIE Level of Efficiency
3.0 33% Very Inefficient
2.5 40% Inefficient
2.0 50% Average
1.5 67% Efficient
1.2 85% Very inefficient
PUE and DCIE metrics were applied in this study, though, it is used to evaluate real world experiment of datacentre by generating random numbers using mid-square algorithm written in C language. Generating random numbers makes it possible and easy to experiment without disturbing the real system.
[image:7.595.315.543.400.535.2] [image:7.595.54.284.483.667.2]Table 2 PUE and DCIE analysis
S/N Total Facility
Power (kw)
Total IT Equipment
Power (kw) PUE DCIE
Level Of Efficiency
Host
1 9657 5335 1.81012183 55% Average
Host
2 9249 5212 1.77455871 56% Average
Host
3 8542 5110 1.67162426 60% Efficient
Host
4 7491 4622 1.62072695 62% Efficient
Host
5 6357 4487 1.41675952 70%
Very Efficient Host
6 5936 3628 1.63616317 61% Efficient
Host
7 4444 2576 1.72515528 58% Average
Host
8 3225 2304 1.39973958 71%
Very Efficient Host
9 3084 2082 1.48126801 68% Efficient
Host
10 2360 1150 2.05217391 49% Inefficient
Total 16.5882912
[image:8.595.59.280.78.290.2]Column 4 and 5 of table 13 above were evaluated using the formula in eq. (1) and eq. (2a or 2b).
Fig. 9: Graph of PUE and DCIE for 10 hosts
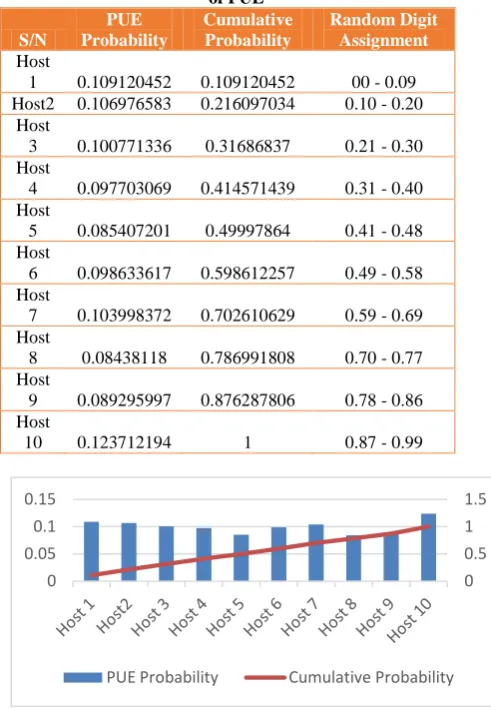
The result in Table 2, shows that the lower the PUE of the host machine, the higher the DCIE and vice versa. Increase in DCIE proves the energy efficiency of these host machines in the datacentre, while decrease in DCIE proves energy inefficiency. The graph of Table 2 is represented in Fig. 9. Column 2 and 3 of Table 3 in the next page represents the random and cumulative probability of the PUE. The probability is gotten by dividing the PUE of each host by the total PUE of the 10 host machines, while cumulative is gotten by adding the next probability with the previous. The total cumulative of these random probabilities must be 1, to confirm the properties of the random numbers generated. The properties include uniformity and independence. Random numbers are independent numbers, uniformly distributed over an interval [0, 1]. This means that each random number is an independent sample drawn from a continuous uniform distribution between the interval 0 and 1 as evaluated in column 3 of Table 3.
Table 3: Random probability and cumulative probability of PUE
S/N
PUE Probability
Cumulative Probability
Random Digit Assignment Host
1 0.109120452 0.109120452 00 - 0.09 Host2 0.106976583 0.216097034 0.10 - 0.20
Host
3 0.100771336 0.31686837 0.21 - 0.30 Host
4 0.097703069 0.414571439 0.31 - 0.40 Host
5 0.085407201 0.49997864 0.41 - 0.48 Host
6 0.098633617 0.598612257 0.49 - 0.58 Host
7 0.103998372 0.702610629 0.59 - 0.69 Host
8 0.08438118 0.786991808 0.70 - 0.77 Host
9 0.089295997 0.876287806 0.78 - 0.86 Host
[image:8.595.310.556.89.444.2]10 0.123712194 1 0.87 - 0.99
Fig. 10: Graph of PUE probability and cumulative probability
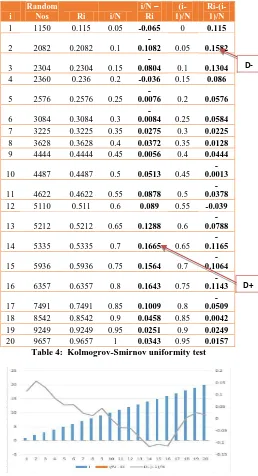
Another means of affirming the uniformity of random numbers is the use of Kolmogrov-Smirnov uniformity test. Given a level of significance, , the critical value for a function of N (in this case N = 20) is compared with the maximum numbers in column 5 ( ) and column 7 ( ) respectively as shown in Table 4.
In Table 4, column 3 shows the random numbers, column 4 shows the empirical distribution, column 5 shows the difference between column 3 and 4 (this is where D+ is chosen, which is the maximum number in column 5) and lastly, column 7 shows the deviation which is calculated by subtracting column 6 from column 3. The maximum number represented by D- is chosen from column 7.
Using = 0.10 and 0.5, where N = 20, the critical value of D can be obtained from Kolmogrov-Smirnov critical value table. The table gives the critical value of to be 0.264 and to be 0.294. The maximum numbers represented by D+
and D- in Table 4 are max (0.1665, 0.1582) which is less than 0.264 and 0.294. Hence, the random numbers generated to calculate the PUE and DCIE are uniform with level of significance = 0.10 and 0.5. Note that, column 3 (Ri) was obtained by dividing the random numbers in column 2 by 10,000 so as to obtain the decimal of the random numbers needed to carry out the uniformity test.
0 20 40 60 80
0 1 2 3
PUE DCiE
0 0.5 1 1.5
0 0.05 0.1 0.15
[image:8.595.308.562.90.439.2] [image:8.595.53.289.328.450.2]i
Random
Nos Ri i/N
i/N – Ri
(i-1)/N
Ri-(i-1)/N
1 1150 0.115 0.05 -0.065 0 0.115
2 2082 0.2082 0.1
-0.1082 0.05 0.1582
3 2304 0.2304 0.15
-0.0804 0.1 0.1304
4 2360 0.236 0.2 -0.036 0.15 0.086
5 2576 0.2576 0.25
-0.0076 0.2 0.0576
6 3084 0.3084 0.3
-0.0084 0.25 0.0584
7 3225 0.3225 0.35 0.0275 0.3 0.0225
8 3628 0.3628 0.4 0.0372 0.35 0.0128
9 4444 0.4444 0.45 0.0056 0.4 0.0444
10 4487 0.4487 0.5 0.0513 0.45
-0.0013
11 4622 0.4622 0.55 0.0878 0.5
-0.0378
12 5110 0.511 0.6 0.089 0.55 -0.039
13 5212 0.5212 0.65 0.1288 0.6
-0.0788
14 5335 0.5335 0.7 0.1665 0.65
-0.1165
15 5936 0.5936 0.75 0.1564 0.7
-0.1064
16 6357 0.6357 0.8 0.1643 0.75
-0.1143
17 7491 0.7491 0.85 0.1009 0.8
-0.0509
18 8542 0.8542 0.9 0.0458 0.85 0.0042
19 9249 0.9249 0.95 0.0251 0.9 0.0249
[image:9.595.48.306.71.547.2]20 9657 0.9657 1 0.0343 0.95 0.0157 Table 4: Kolmogrov-Smirnov uniformity test
Fig. 11: Graph of Kolmogrov-Smirrnov uniformity test
5.
CONCLUSION
Failure in proper security of datacentres could result in higher cost of reinstating and potential loss of users’ data, thus eliminating the benefits of cloud computing. Therefore, maximum security mechanisms should be provided for cloud infrastructures, users, and personnel working within and outside the datacentre. The purpose of ensuring cost effective and energy efficient security in cloud datacentres is to meet Quality of service (QoS), Power Usage Efficiency (PUE), Service Level Agreements (SLAs) requirements. Also helps in reducing the overhead cost of operating datacentre and most importantly protect cloud users’ data. Cloud infrastructures needs the highest level of security at host level, network level, storage level, and the entire cloud facilities. Security mechanisms for host (server), network and storage facilities include virtualization, fault tolerance, risk assessment and mitigation. Under-floor intrusion detection is another security mechanism useful inside the datacentre. The cooling and air-conditioning system dissipating high energy is another form
of security. Higher level security includes access control, biometrics, badge readers and extensive camera monitor should be provided to guard against unauthorized access into the datacentre. The use of CCTV, integrated alarm systems is also essential to provide high level of security within the datacentre. Simple physical security measure for admitting personnel into the premises of the datacentre is the use of pre-authorized access such as perimeter fencing, and security officers. At user level, authentication (strong passwords), confidentiality, authorization, integrity, availability and non-repudiation can be used in protecting data. Hard drive decommissioning is a way of getting rid of highly sensitive data that are no longer needed. This is the routine destruction of hard drive so that users’ data are not leaked to third parties. Future work will look into the metrics vis-a-vis the emerging architecture of Cloud infrastructure to empirically establish factors that could enhance performance.
6.
REFERENCES
[1] Shawish, A., & Salama, M. (2014). Cloud Computing: Paradigms and Technologies. In F. Xhafa & N. Bessis (Eds.) Inter-cooperative Collective Intelligence: Techniques and Applications, (pp 39–68). Berlin, Heidelberg: Springer. https://doi.org/10.1007/978-3-642-35016-0_2.
[2] Mell, P., & Grance, T. (2011). The NIST definition of cloud computing. NIST Special Publication, 800-145,
Retrieved from
http://nvlpubs.nist.gov/nistpubs/Legacy/SP/nistspecialpu blication800-145.pdf.
[3] Jain, P. (2012). Security Issues and their Solution in Cloud Computing. International Journal of Computing & Business Research, ISSN (2229-6166). Retrieved from http://www.researchmanuscripts.com/isociety2012/1.pdf. [4] Ramgovind, S., Eloff, M., & Smith, E. (2010, September). The Management of Security in Cloud Computing. Conference: Information Security for South Africa, (pp 1-7). Sandton, Johannesburg: UNISA Institutional Repository.
[5] Pedram, M. (2012). Energy-Efficient Datacentres. IEEE Transactions on Computer-Aided Design of Integrated Circuits and Systems, 31, 1465-1484. doi:10.1109/TCAD.2012.2212898.
[6] Banerjee, A., Agrawal, P., & Iyengar, N. C. S. N. (2013). Energy Efficiency Model for Cloud Computing. International Journal of Energy, Information and
Communications, 4(6), 29–42.
https://doi.org/10.14257/ijeic.2013.4.6.04.
[7] Barroso, L.A. & Holzle, U. (2009). The Datacentre as a Computer: An Introduction to the Design of Warehouse-Scale Machines. Morgan & Claypool Publishers. doi:10.2200/S00193ED1V01Y200905CAC006.
[8] Fan, X., Weber, W., & Barroso, L.A. (2007). Power provisioning for a warehouse-sized computer. 34th annual International symposium on Computer Architecture, (pp. 13-23). New York, USA: Association for Computing Machinery.
[9] Rasmussen, N. (2007). Calculating Total Cooling Requirements for Datacentres. American Power Conversion, white paper number 25, Revision 2.
Retrieved from
https://www.scribd.com/document/4854383/Calculating-Total-Cooling-Requirements-for-Data-Centers.
[10]Kaur, E. S. (2014). Comparative Analysis upon Energy Efficiency between Cloud Computing and Green Computing. International Journal of Advance Research in Computer Science and Software Engineering
(IJARCSSE), 4(9), 818–821.
http://ijarcsse.com/Before_August_2017/docs/papers/Vol ume_4/9_September2014/V4I9-0353.pdf.
[11]Jacob, J., (2014). Green Computing Strategies for Improving Energy Efficiency in IT Systems. International Journal of Scientific Engineering and Technology, (ISSN: 2277-1581), 3(6) (pp 715-717).
Retrieved from
http://ijset.com/ijset/v3s6/IJSET_2014_603.pdf.
[12]Backialakshmi, M., & Hemavathi, N. (2015). Survey on Energy Efficiency in Cloud Computing. Journal of Information Technology & Software Engineering, 6(1). Ddoi:10.4172/2165-7866.100164.
[13]Sharma, Y., Javadi, B., & Si, W. (2015). On the Reliability and Energy Efficiency in Cloud Computing. 13th Australasian Symposium on Parallel and Distributed Computing (AusPDC 2015), Parramatta, Sydney, Australia, (111-114). Parramatta, N.S.W: Australian Computer Society.
[14]Javadi, B., Abawaiy, J. & Buyya, R. (2012). Failure Aware Resource Provisioning for Hybrid Cloud
Infrastructure. Journal of Parallel and Distributed Computing, 72(10) 1318-1331.
[15] Elgelany, A., & Nada, N. (2013). Energy Efficiency for Data Centre and Cloud Computing: A Literature Review. International Journal of Engineering and Innovative Technology (IJEIT), 3(4), 16–20. Retrieved from http://www.ijeit.com/archive/24/volume-3issue-4-october-2013.html.
[16] Horri, A., & Dastghaibyfard, G. (2015). A Novel Cost Based Model for Energy Consumption in Cloud Computing. The Scientific World Journal, 2015(Article ID 724524), 1–10. https://doi.org/10.1155/2015/724524. [17] Chen, Y., & Sion, R. (2014). Costs and security in
Clouds. In Jajodia, S., Kant, K., Samarati, P., Singhal, A., Swarup, V., & Wang, C. (Eds), Secure Cloud Computing (pp 31-56). New York, USA: Springer. [18] Dabbagh, M., Hamdaoui, B., Guizani, M., & Rayes, A.
(2015). Towards energy-efficient cloud computing: Prediction, consolidation, and over commitment. IEEE
Network, 29(2), 56-61.
doi:10.1109/MNET.2015.7064904.
[19] Buyya, R., Ranjan, R., & Calheiros, R. N. (2009). Modelling and Simulation of Scalable Cloud Computing Environments and the CloudSim Toolkit: Challenges and
Opportunities. IEEE Xplore.
doi:10.1109/HPCSIM.2009.5192685.