Accepted Article
www.batteries-supercaps.org
A Journal of
Title:Formation of the Solid Electrolyte Interphase at Constant Potentials: a Model Study on Highly Oriented Pyrolytic Graphite
Authors:Byron Konstantinos Antonopoulos, Filippo Maglia, Felix Schmidt-Stein, Jan Philipp Schmidt, and Harry Ernst Hoster This manuscript has been accepted after peer review and appears as an Accepted Article online prior to editing, proofing, and formal publication of the final Version of Record (VoR). This work is currently citable by using the Digital Object Identifier (DOI) given below. The VoR will be published online in Early View as soon as possible and may be different to this Accepted Article as a result of editing. Readers should obtain the VoR from the journal website shown below when it is published to ensure accuracy of information. The authors are responsible for the content of this Accepted Article.
To be cited as: Batteries & Supercaps 10.1002/batt.201800029
Formation of the Solid Electrolyte Interphase at Constant Potentials: a Model Study on Highly Oriented Pyrolytic Graphite
Byron Konstantinos Antonopoulosa, Dr. Filippo Magliaa, Dr. Felix Schmidt-Steina, Dr. Jan Philipp
Schmidta, Prof. Dr. Harry Ernst Hosterb,c
a BMW Group, Petuelring 130, 80788 München, Germany
b Dep. of Chemistry, Lancaster University, Lancaster, LA1 4YB, UK
c ALISTORE European Research Institute, CNRS FR 3104, Hub de l'Energie, Rue Baudelocque,
80039 Amiens, France
Corresponding author: [email protected]; +44 7842 831633
Co-Author Addresses:
Keywords:
SEI Formation; Highly Oriented Pyrolytic Graphite; Outer Sphere Reaction; Model Electrode Surface;
Reaction Rate Constant.
Accepted
Abstract:
The solid electrolyte interphase (SEI) on graphite anodes is a key enabler for rechargeable lithium ion
batteries (LIBs). It ensures that only Li+ ions and no damaging electrolyte components enter the anode
and hinders electrolyte decomposition. Its growth should be confined to the initial SEI formation
process and stop once the battery is in operation to avoid capacity/power loss. In technical LIB cells,
the SEI is formed at constant current, with the potential of the graphite anode slowly drifting from
higher to lower voltages. SEI formation rate, composition, and structure depend on the potential and
on the chemical properties of the anode surface. Here, we characterize SEIs formed at constant
potentials on the chemically inactive basal plane of highly oriented pyrolytic graphite (HOPG). X-ray
photoemission spectroscopy (XPS) detects carbonate species only at lower formation potentials.
Cyclic voltammetry (CV) and Electrochemical Impedance Spectroscopy (EIS) with Fc/Fc+ as an
electrochemical probe demonstrate how the formation potential influences ion transport and
electrochemical kinetics to and at the anode surface, respectively. Breaking the EIS data down to a
Distribution of Relaxation Times (DRT) reveals distinct kinetics and transport related peaks with
varying Arrhenius-type temperature dependencies. We discuss our findings in the context of previous
electrochemical studies and existing SEI models and of SEI formation protocols suitable for industry.
Accepted
Table of Contents entry:
Here, SEIs formed on basal-plane HOPG are characterized. XPS detects carbonate species only at
lower formation potentials. Electrochemical methods (CVs and EIS) with Fc/Fc+ as an electrochemical
probe demonstrate how the formation potential influences ion transport and electrochemical kinetics to
and at the anode surface, respectively. Breaking the EIS data down to a Distribution of Relaxation
Times reveals distinct kinetics and transport related peaks. The findings are discussed in the context of
existing SEI models and industrial SEI formation protocols.
Accepted
1.
Introduction
Li-ion batteries (LIB) have become a technologic and commercial success through the combination of
graphitic carbon and a transition metal oxide as negative and positive electrodes, respectively. Li
intercalated in graphite is thermodynamically slightly more stable than in metallic form: Li-ions
reversibly (de-)intercalate into/out of graphite at ~100 mV vs. Li/Li+. This helps to avoid Li dendrites.
An ideal LIB electrolyte would combine high ionic conductivity, diffusivity, broad temperature
stability, and stability against electrochemical decomposition at anode or cathode. Commercially
available electrolytes have been engineered to come close to those ideals, but do not quite reach all of
them simultaneously [1–5]. In particular, electrochemical decomposition at the negative electrode is
thermodynamically possible; hence only kinetic hindrances of those side reactions make the thousands
of charge/discharge cycles possible that can be achieved, e.g., with electrolytes consisting of alkyl
carbonates as solvents and LiPF6 as conducting salt [6,7]. Kinetic suppression of ongoing electrolyte
decomposition is achieved through the initial “formation” step applied to all commercial LIBs. In that
first negative polarization of the graphite anode, the electrolyte is decomposed in a controlled way into
a passivation layer that, once sufficient thickness is reached, will kinetically suppress ongoing
electrolyte decomposition [8,9]. Another key property gave this passivation layer the name “solid
electrolyte interphase” (SEI): It acts as solid electrolyte for Li+ transport between the liquid electrolyte
and the graphite electrode. Furthermore, it acts as a filter, preventing co-intercalation of other
electrolyte components (e.g. solvent), which would otherwise quickly destroy the graphite electrode
structure. In real systems, further electrolyte decomposition is not completely suppressed and
continues, yet at a small rate, which grows the SEI over time. The two most prominent negative effects
of this ongoing process are (i) increasingly sluggish Li+ transport kinetics through the SEI and (ii)
irreversible incorporation of Li+ into the SEI, thus lowering the cell capacity. Formation and further
development of the SEI depend on electrolyte and electrode composition and preparation, formation
parameters and contaminations including those produced during the cell life [8,10–21].
From an interfacial electrochemistry perspective the SEI can be handled as a nearly homogeneous
adlayer with conducting channels. Perpendicular to the electrode, one can imagine a sequence
electrode | SEI(compact layer) | SEI(porous part) | electrolyte.[22] The compact layer was found to
partially consist of inorganic (Li-containing) species, which were hypothesized to be formed only once
lower potentials are reached during the formation process, then consuming Li+ and parts of the organic
SEI components formed at higher potentials (“two-step mechanism” [16,23,24]). It is now well
accepted that the safe and reliable operation of rechargeable LIBs demands understanding and control
of side reactions, many of which are influenced by the electrode potential and the local surface
chemistry and structure. Hence, in analogy to fundamental research in the electrocatalysis community
Accepted
[25,26], deeper insights require studies at well-defined model surfaces under potentiostatic conditions,
and involving both electrochemical techniques as well as high resolution surface microscopy and
spectroscopy[19,21,27–35]. Particularly the SEI on Glassy Carbon (GC) was studied extensively by
Tang et al. [23,36,37] and others [38,39]. For commercial electrolyte, Fc/Fc+ as an electrochemical
probe for the effect of the SEI on ion transport and electrochemical kinetics revealed that SEI
formation can be broken down to two key steps at ~700 and ~400 mV vs. Li/Li+ [35]. More recently,
we and others studied the formation of LiF, a frequently observed SEI component, on smooth carbon
and metal single crystal surfaces and demonstrated the importance of surface electrocatalysis [40–42].
For the present study, we have chosen the basal plane of highly oriented pyrolytic graphite (HOPG) as
a model electrode, and using a cell setup that resembles the pressure conditions of LIB electrodes.
Since this surface exposes few chemically reactive sites (i.e., step edges and defects), it is
electrocatalytically virtually inert. Hence, surface reactions will be dominated by the availability of
reactants and the electrochemical potential. In analogy to studies on glassy carbon [38,39], the low
surface area of HOPG [35] allows applying potential steps followed by constant-potential periods,
which on technical high-surface area electrodes would cause high current peaks, long relaxation times,
and inhomogeneous potential distribution. In the electrochemical part of our experiments, we followed
the protocols that Tang et al. used in their model studies at glassy carbon: SEI formation at four
different potentials and probing the resulting SEI properties using cyclic voltammetry (CV) and
electrochemical impedance spectroscopy (EIS) of dissolved Fc/Fc+. Beyond that, we analyzed the
potential-dependent composition of the SEI by ex-situ X-ray photoelectron spectroscopy (XPS), and
we broke down the EIS data into a Distribution of Relaxation Times (DRT). We discuss the findings
of our multi-method study in the context of previous electrochemical model studies and existing SEI
models [22,23,35–39] and suggest how our findings may inform more efficient SEI formation
protocols in industry.
2.
Experimental
Basal plane HOGP (mosaic spread 0.8° ± 0.2°, Plano GmbH, Germany) was cleaned with adhesive
tape before being used as a model electrode surface. It was fully covered by PET tape (T 851, 3M,
USA) leaving exposed a well-defined basal circular area with 4 mm diameter to the electrolyte. The
sample was finally mounted on the sample holder and then dried at 60 °C for 12 h at a pressure ~10
-2 mbar in a vacuum oven (Glass Oven B-585 Drying, BÜCHI Labortechnik AG, Switzerland) before
being transferred without atmosphere contact into an Argon filled glove box. The other cell
components were cleaned with 2-propanol and demineralized water in an ultrasonic bath and then
dried at 60 °C before being transferred into the glove box for cell assembly. The glove box contained
< 0.1 ppm water and < 3 ppm oxygen.
Accepted
All experiments were performed several times in order to ensure reproducibility. Conspicuously
deviating results were not considered. This was particularly important as some of the manually
affected experimental side parameters (e.g. injection speed and position, sample preparation and
washing, position of single cell features etc.) can vary. Accuracy of quantitative values (number of
digits) given in this work is based on typical variances.
2.1.
Electrochemistry
We used a closed 3-electrode T-cell with the option to connect a further feature (designed and
manufactured by rhd instruments GmbH & Co. KG, Germany; see also their recently released “TSC
battery standard”). Li foil (ca. 500 μm, Alfa Aesar, UK) served as counter and reference electrode. The
sample was separated by a Whatman GF/A glass fiber separator (Sigma Aldrich, Germany) soaked in
75 μl BASF LP572 (EC:EMC 3:7, 1 M LiPF6, 2%wt VC, BASF, Germany). The CE and sample were
pressed against each other by a spring. The sample holder included a Pt100 temperature sensor for
sample temperature control. The second vertical connector (“syringe connector”) was used to connect
a Hamilton Gastight syringe (VWR, Germany) via a glass capillary. The syringe contained around
30 μl electrolyte enriched with 10 mMol ferrocene and ferrocenium hexafluorophosphate (Fc and Fc+,
respectively, both from Sigma Aldrich, Germany), of which 25 μl were injected into the cell, yielding
a Fc/Fc+ concentration of 2.5 mMol L-1. For SEI-free experiments, no syringe was connected and the
syringe connector was sealed with an appropriate plug. 100 μl of electrolyte with 2.5mMol Fc/Fc+
concentration was used.
The assembled cell was mounted on a Microcell HC cell holder connected to a Eurotherm temperature
controller (both rhd instruments GmbH & Co. KG, Germany). Unless otherwise mentioned, all
electrochemical experiments were performed at 20 °C. The electrochemical instrumentation was an
Autolab M101 Potentiostat with FRA32M impedance spectroscopy module controlled by the
manufacturer software Nova (Deutsche METROHM GmbH & Co. KG, Germany). CV experiments
consisted of 5 cycles, but only the fifth was processed. EIS experiments were obtained around OCP
with an amplitude of 10 mV using 50 logarithmically distributed frequencies in the range 500
kHz-0.1 Hz.
HOPG basal plane is a surface with large flat terraces, though the above described preparation method
cannot avoid inducing edge defect sites facilitating Li+ intercalation. To make sure that possibly
intercalated residuals from previous experiments were stripped off by the adhesive tape, we checked
the open curcuit potential (OCP) after cell assembly. The cell was discarded if OCP was below 3 V vs.
Li/Li+. All electrochemical potentials in this paper describe the potential of the working electrode in
the three-electrode setup and refer to the Li metal reference electrode, thus are given vs. Li/Li+. Due to
the high electronic conductivity of HOPG through-plane potential gradients lie in the sub-μV region
and are therefore neglected.
Accepted
2.2.
X-Ray Photoelectron Spectroscopy
The sample holder covered by double-sided XPS compatible adhesive tape was dried similar to the
HOPG. After electrochemical treatment the cells were disassembled in the glove box for further
spectroscopic analysis of the electrodes. Samples were rinsed with 1 ml dimethyl carbonate (DMC,
Sigma Aldrich, Germany) using a pipette and then fixed on the sample holder. To transfer the sample
from the glove box to the spectrometer it was introduced into a transfer vessel (Model 04-110A,
Physical Electronics GmbH, Germany) and sealed, which itself was further vacuum sealed into an
aluminum based pouch bag. The sample could be verifiably transferred into the analysis chamber
without any atmosphere contact. Spectra were recorded with a PHI 5000 spectrometer (Physical
Electronics GmbH, Germany) using Al Kα radiation (hν = 1486.6 eV) under ultrahigh vacuum
conditions. Sputtering was performed using an Ar+ gun with 0.5 kV and a 4x4 mm2 spot size, using a
current that correlates to 0.25 nm min-1 as calibrated on Si/SiO
2. Spectra were shifted based on the
C 1s graphite binding energy at 284.8 eV on pristine HOPG. Atomic concentrations were determined
via the analysis software Phi MultiPak.
3.
Results and Discussion
3.1.
Potentiostatic SEI Formation
To allow direct comparison with the results previously reported for GC electrodes [23], we formed
SEIs at 600, 450, 300 and 100 mV. Lower formation potentials were not considered, as no distinct
reactions take place at potentials <100 mV, whilst potentials >600 mV do not form a passivating SEI
on HOPG [28,29,35]. In order to achieve a comparable set of SEIs we defined three equipollent cutoff
parameters terminating the potentiostatic polarization step, namely the current density, charge density
and formation time at 4 μA cm-2, 10 mC cm-2 and 600 s, respectively.
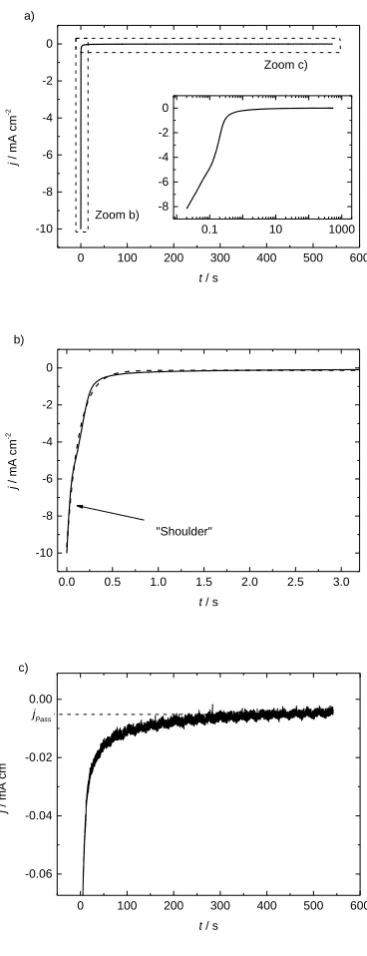
An exemplary reduction current density transient j after applying 100 mV is presented in Figure 1a.
The profiles looked very similar for the other formation potentials. For better visibility, Figure 1b and
c display two characteristic current density regimes. After the potential is applied we obtained a high
reductive current, which drops to less than 5% within the first 500 ms. The drop includes a shoulder at
50 ms (indicated by the arrow), though passivates after around 100 s. No systematic relation could be
found between the final passivation current jPass indicated in Figure 1c and the applied potential,
though the value was always below 10 μA cm-2. Figure 1b includes an exponential fit (dashed line)
with time constant 133 ms (corresponds to 7.5 s-1).
Accepted
0 100 200 300 400 500 600 -10 -8 -6 -4 -2 0 a) j / m A cm -2
t / s Zoom b)
Zoom c)
0.1 10 1000 -8
-6 -4 -2 0
0.0 0.5 1.0 1.5 2.0 2.5 3.0 -10 -8 -6 -4 -2 0 j / m A cm -2
t / s b)
"Shoulder"
0 100 200 300 400 500 600 -0.06 -0.04 -0.02 0.00 c) j / m A cm -2
t / s
[image:9.595.197.381.76.555.2]jPass
Figure 1: Current density j during a potentiostatic formation procedure on HOPG at 100 mV in neat electrolyte, inset with logarithmic abscissa. b) and c) are
detailed zooms of a). The dashed line in b) indicates the exponential fit with an exponential coefficient 7.5 s-1.
In contrast to composite carbon electrodes, which suffer from electrolyte decomposition even in later
cycles due to particle breathing [22], the non-intercalating HOPG electrode should be irreversibly
passivated during this first polarization. Apart from electrochemical electrolyte reduction, the current
response to the potentiostatic step may result from three further contributions: (i) charging of the
double layer capacitance, (ii) Li+ intercalation into the HOPG at step edges and (iii) other irreversible
side reactions (e.g. production of dissolved species). Although the setup is optimized in order to avoid
those current overlaps, we experimentally tested for their possible presence and significance. As
shown in more details in the Supplementary Information (SI), their contributions are negligible. For
instance, the characteristic time constants of double layer charging currents calculated in the SI would
Accepted
be in the order of magnitude of 10-6 s, which is significantly smaller than the 133 ms resulting from the
fit in Figure 1b. Hence, the 100s-scale relaxation in Figure 1c must reflect the increase of a
(quasi-)resistance, namely the expected and desired self-passivating nature of the electrochemical SEI
formation.
3.2.
XPS
Ex-situ X-ray photoelectron spectroscopy (XPS) was used to analyze the chemical compositions of
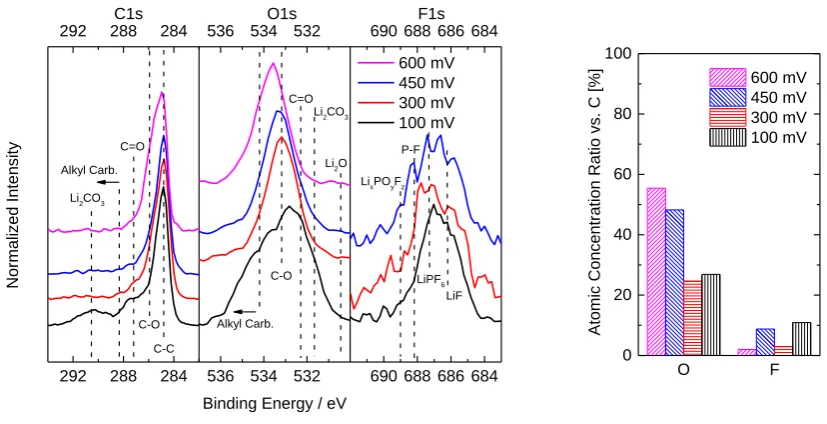
SEIs formed at 600, 450, 300 and 100 mV. Figure 2 shows spectra of the C1s, O1s and F1s regions.
Li1s spectra of all SEIs and F1s spectrum of 600 mV SEI were recorded but did not show any features
beyond noise and are therefore not shown. All plotted spectra belong to samples “as transferred”,
without any layers removed by Ar+ sputtering. Even three minutes of sputtering made the O1s signal
disappear completely, which is not surprising given that SEIs on basal planes are known to be
significantly thinner than on edge planes [21,27]. The peak positions in Figure 2 are in good
agreement with features in previous XPS analyses of SEI layers [43–57].
536 534 532
536 534 532
690 688 686 684 690 688 686 684
292 288 284
292 288 284
Alkyl Carb.
Li2O Li2CO3
C=O
C-O
Binding Energy / eV O1s
LixPOyFz
LiF LiPF6 P-F F1s C-C C-O C=O Alkyl Carb. Norm alized In ten sity 600 mV 450 mV 300 mV 100 mV C1s
Li2CO3
O F 0 20 40 60 80 100 Atomic Con cen tra tion Ratio
vs. C [%]
[image:10.595.100.514.339.551.2]600 mV 450 mV 300 mV 100 mV
Figure 2: XPS C1s, O1s and F1s spectra and elemental concentrations for SEIs formed at indicated potentials. Dashed lines mark standard SEI species bindings
at respective binding energies. The 600 mV SEI did not show any significant counts in the F1s region. The concentrations are given as a ratio vs. carbon.
Looking at the C1s region, both lower potential (300 and 100 mV) SEIs show a stronger response in
the C=O region as compared to the high-potential SEIs (600 and 450 mV). Li2CO3 related features are
only distinctive for the 100 mV SEI. The 600 mV SEI appears to have a higher amount of C-O bonds.
Alkyl carbonates, which are typical solvent decomposition products [22,58–61], are not significant in
the C1s region. The O1s region shows a strong response at binding energies > 534 eV at all SEIs, thus
indicating the presence of alkylic species. O1s regions show no presence of Li2O, though indicate the
presence of Li2CO3 in both lower potential SEIs. The higher potential SEIs show no signs of Li2CO3.
The F1s region indicates the presence of LiF and residual LiPF6 in all SEIs, while the 450 mV SEI
exhibits higher fluorophosphate content. Figure 2 also shows the elemental percentages of oxygen and
Accepted
fluorine normalized with the carbon concentration for the different formation potentials. The oxygen
content suggests two distinct regimes: “low-potential” (<400 mV) and “high-potential” (>400 mV)
SEIs, where the high-potential SEIs contain about twice as much oxygen as the low-potential ones,
whereas only the latter exhibit carbonate features. Though, no trend is present in the fluorine content
with formation potential. Nevertheless, the absolute values < 10% indicate all fluorine containing
species to be present only in small amounts. Apart from residual LiPF6, we tentatively attribute these
fluorine concentrations to thin, non-passivating LiF films formed via HF reduction. We recently
demonstrated, that such films form at potentials >1 V [40], and that their formation requires
electrocatalytically active sites, of which HOPG has few .Hence our formation potential should have
little influence on them, so that no trend was to be expected in the first place.
In summary, the XPS measurements confirm an influence of the formation potential on the SEI
chemistry. Most obvious is the apparent segregation into a high (600 and 450 mV) and a low (300 and
100 mV) potential regime resulting in absence/presence of Li2CO3 and high/low oxygen
concentrations, respectively. Hence, on HOPG, the frequently assumed direct decomposition of EC to
Li2CO3 and ethylene – if at all – only takes place at <400 mV (in agreement with Aurbach et al. [62]).
3.3.
Electrochemical Investigations
3.3.1. Cyclic Voltammetry
We used cyclic voltammetry to investigate the electron and species transport properties of the different
SEIs. Fc/Fc+ served as a stable probe species in the absence of intercalating Li on HOPG [63]. The use
of Li0 reference and counter electrode is appropriate, since Fc/Fc+ shows good chemical stability at
low potentials [64,65]. We injected Fc/Fc+ enriched electrolyte after SEI formation. To ensure
sufficient equilibration we obtained 5 cycles per scan rate and only used the respective 5th cycle for
further analysis and comparison. Figure 3a exemplarily shows the data of a 100 mV SEI (trends of
CVs on different SEI are similar). Figure 3b presents the CVs on different SEIs as well as pristine
HOPG obtained at 100 mV s-1. The shapes generally indicate a fully reversible reaction. The peak
current densities are up to two orders of magnitude higher than the current densities in neat electrolyte
(see SI) and 1.5 orders of magnitude higher than the passivation currents at the end of the formation
procedure (Figure 1c), confirming that any background currents can be neglected in the presence of
the Fc/Fc+ couple. The current densities are consistent with previous findings for other
solvent/electrode systems [63,66–68].
With decreasing scan rate, the peaks get smaller (Figure 3a), as expected. However, the peak positions
are not constant for the different scan rates. This indicates that the underlying processes are more
complex than a Nernstian uninhibited behavior.
Comparing the CVs obtained after different formation potentials (Figure 3b), the CVs qualitatively
retain the same characteristic shape, but become smaller in amplitude in the presence of an SEI. The
Accepted
suppression is strongest for the 100 mV SEI, whereas SEIs formed at any of the three other formation
potentials yield rather similar CV amplitudes. Another obvious feature is the shift of the peak
potentials, which does not seem to follow any specific trend. These latter shifts highlight that the SEI
does more than just block parts of the electrochemically active surface area (ECSA) and obstruct the
diffusion transport of Fc/Fc+. This is discussed in more detail in the SI, where we demonstrate that CV
simulations only resemble the experimental trends if we not only allow for a variation of the ECSA
[image:12.595.194.384.224.526.2]and the effective diffusion coefficients, but also of the kinetic rate constant for the redox reaction.
Figure 3: CVs of HOPG covered by SEIs Fc/Fc+ environment. For every scan rate 5 cycles were obtained, only the fifth is shown. a) CVs with different scan
rates of an SEI formed at 100 mV. b) CVs at 100 mV s-1 on pristine HOPG and different SEIs.
In the following, we will derive the (apparent) diffusion coefficients and heterogeneous rate constants
from the trends in CV peak amplitudes and positions, respectively.
Diffusion coefficients from peak amplitudes. For a given SEI, information about how diffusion transport of Fc/Fc+ is hindered by the SEI can be determined from the scan-rate dependent peak
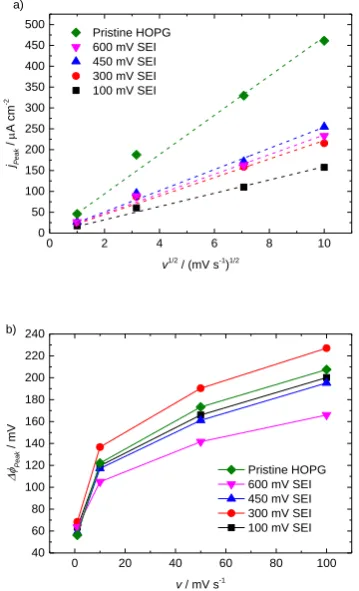
amplitude [69]. The anodic peak current densities jPeak of different SEIs as well as pristine HOPG
plotted against the square root of the scan rate ν are shown in Figure 4a. One can observe a linear
dependency of the peak current densities with 𝜈1 2⁄ , confirming the quasi-reversibility[69–71] of the
Fc/Fc+ reaction even in the presence of an SEI. For quasi-reversible reactions, the oxidative peak
current density 𝑗𝑃𝑒𝑎𝑘 depends on the scan rate and is described at 20 °C by the adjusted
Randles-Sevcik equation [69]:
Accepted
𝑗𝑃𝑒𝑎𝑘 = 3.04 ∙ 105 𝑛3 2⁄ 𝛼1 2⁄ 𝑐𝑅𝑒𝑑0 (𝜉 𝐷𝑟𝑒𝑑 𝜈)1 2⁄ in A cm-2 (1)
𝐷𝑟𝑒𝑑= effective diffusion coefficient (reduced species) = to be determined, n = transfer number = 1, α
= charge transfer coefficient = 0.3,[72]𝑐𝑅𝑒𝑑0 = concentration (reduces species) = 2.5 mMol,
respectively. The correction factor ξ is equal 1 for solutions where the oxidized species concentration
𝑐𝑜𝑥0 respects the boundary conditions 𝑐𝑜𝑥0 (𝑡 = 0) = 𝑐𝑜𝑥0 (𝑥 → ∞) = 0. Since in our experiments we
started with a non-zero concentration of the oxidized species, ξ must be derived from another method.
By comparison with EIS measurements (see SI), we find 𝜉 = 3.97. Data is fitted using linear fits with
y-intercepts equal zero. The slope is significantly higher on pristine HOPG and decreases with
lowered formation potential, indicating a reduced effective diffusion coefficient. The slopes of the
100 mV SEI is distinctly smaller, whilst the other three SEIs seem to have similar diffusion properties.
The analysis of the reductive peak currents leads to similar slopes, therefore they are not discussed
separately (see also Dinh-Nguyen et al.[39]). Though, they allow the conclusion that the oxidized and
reduced species effective diffusion coefficients Dox and Dred are similar too. The corresponding fit
slopes as well as the resulting effective diffusion coefficients 𝐷𝑒𝑓𝑓= 𝐷𝑟𝑒𝑑 ≈ 𝐷𝑜𝑥, calculated using eq.
(1), are presented in Table 1.
0 2 4 6 8 10
0 50 100 150 200 250 300 350 400 450 500
jPea
k / A cm -2 v1/2
/ (mV s-1
)1/2
Pristine HOPG 600 mV SEI 450 mV SEI 300 mV SEI 100 mV SEI a)
0 20 40 60 80 100 40 60 80 100 120 140 160 180 200 220 240 b) P ea k / m V
v / mV s-1
Pristine HOPG 600 mV SEI 450 mV SEI 300 mV SEI 100 mV SEI
Figure 4: a) CV anodic peak current densities jPeak obtained on pristine HOPG and different SEIs in Fc/Fc+ environment plotted vs. ν1/2 and respective linear fits
(dashed lines) for diffusion coefficient calculations. b) Peak potential differences ΔφPeak of CVs obtained on pristine HOPG and different SEIs in Fc/Fc+
environment.
Accepted
[image:13.595.201.381.411.707.2]The strong drop of diffusion coefficient between 300 and 100 mV resembles well the glassy carbon
rotating disk electrode (GC-RDE) limiting current results by Tang et al. [23]. Interestingly, that paper
has another set of data which – when analyzed appropriately –is also in good agreement with our
diffusion coefficients. Figure 5a reproduces a figure of ref. [23], which shows the OCP transient of
SEI covered GC-RDE during Fc/Fc+ injection. SEIs were formed at indicated potentials in a similar
way to our study. We reprocessed that data by shifting the moment of injection (arrows in Figure 5a)
to 𝑡 = 0.1 s and present the reprocessed data in Figure 5b. Since the OCP is directly correlated to the
Fc/Fc+ concentration at the electrode, the OCP slope and thus the time to reach a selected potential are
qualitative measures for the Fc/Fc+ diffusion speed. The durations for the OCP to reach 3.1 V are 0.46,
0.49, 14 and 142 s for the 600, 450, 300 and 100 mV SEI, respectively. That trend is fully compatible
with the diffusion coefficients in Table 1.
0 50 100 150 200 250 300 2.0
2.5 3.0
0.1 1 10
2.0 2.4 2.8 3.2
OCP / V vs. L
i/Li
+
t / s normalized to 0.1 s after injection 600 mV SEI 450 mV SEI 300 mV SEI 100 mV SEI b)
Figure 5: a) OCP transients after injection of Fc/Fc+ in different SEIs on Glassy Carbon in a RDE system (reproduced from ref. [23]; Journal of the
Electrochemical Society by Electrochemical Society. Reproduced with permission of Electrochemical Society in the format. Republish in a journal/magazine via
Copyright Clearance Center). b) Same data reprocessed by shifting the moment of injection to t=0.1 s. Inset presents data with logarithmic time axis for better
visibility of the initial phases.
a)
Accepted
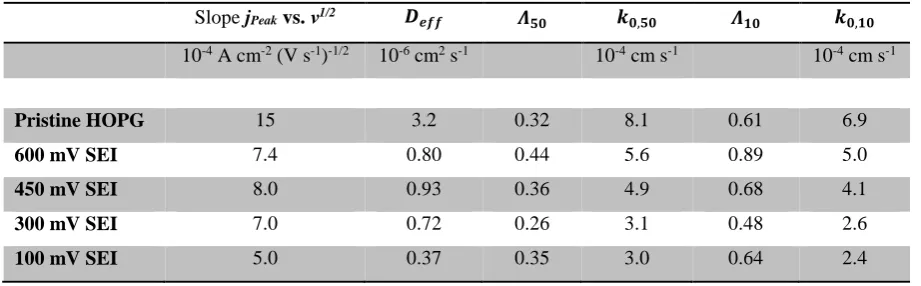
[image:14.595.203.383.293.584.2]Table 1: Electrochemical results extracted from CVs or calculated using equations (1) and (2).
Slope jPeak vs. ν1/2 𝑫𝒆𝒇𝒇 𝜦𝟓𝟎 𝒌𝟎,𝟓𝟎 𝜦𝟏𝟎 𝒌𝟎,𝟏𝟎
10-4 A cm-2 (V s-1)-1/2 10-6 cm2 s-1 10-4 cm s-1 10-4 cm s-1
Pristine HOPG 15 3.2 0.32 8.1 0.61 6.9
600 mV SEI 7.4 0.80 0.44 5.6 0.89 5.0
450 mV SEI 8.0 0.93 0.36 4.9 0.68 4.1
300 mV SEI 7.0 0.72 0.26 3.1 0.48 2.6
100 mV SEI 5.0 0.37 0.35 3.0 0.64 2.4
Heterogeneous rate constants from peak potentials. The peak potential differences in Figure 4b generally decrease with lowered scan rate and approach the theoretical value of 57 mV for a fully
reversible system [71]. Though, without an appropriate discussion of the electrochemical background,
the dependency trend of the peak potential difference on the SEI formation potential appears to be
rather random. As it was described by Matsuda and Ayabe, the heterogeneous rate constant 𝑘0 of a
quasi-reversible reaction can be determined from the peak potential difference as well as the effective
diffusion coefficient [69]:
𝑘0,𝜈 = 𝛬𝜈(∆𝜑𝑃𝑒𝑎𝑘) ∙ (𝐷𝑒𝑓𝑓𝑛𝐹
𝑅𝑇𝜈)
1 2⁄
(2)
where F is the Faraday constant and R the universal gas constant. 𝛬𝜈(∆𝜑𝑃𝑒𝑎𝑘) is a numerical function
of which a set of values is tabulated in the literature [71]. In theory, 𝑘0 is independent of ν, though
values based on experimental data can vary with scan rate, therefore the index ν is used to indicate the
respective scan rate. The 𝑘0,𝜈 values listed in Table 1 are calculated with eq. (2) by using 𝛬𝜈 values
interpolated from the tabulated data in order to derive rate constants for 50 and 10 mV s-1. The peak
potential differences of 100 and 1 mV s-1 are outside the tabulated 𝛬
𝜈 interval and can therefore not be
considered. Although diffusion coefficients determined in ref. [72] on glassy carbon vary significantly,
rate constants of pristine HOPG are consistent with values derived in the corresponding glassy carbon
experiments. The calculated rate constants in Table 1 slightly depend on the respective ν. Consistent
with our XPS results, a much more pronounced difference can be observed between the high (600 and
450 mV) and the low (300 and 100 mV) formation potentials regimes. Although the peak potential
differences did not reveal any trend with formation potential at first, a clear trend emerges for the
heterogeneous rate constants of the Fc/Fc+ outer sphere reaction whose calculations using eq. (2)
include the effective diffusion coefficients. Hence the formation potential not only changes the SEI’s
Accepted
transport properties for the probe species to reach the electrochemically active interface, but also the
kinetics of the electrochemical reaction itself.
3.3.2. Electrochemical Impedance Spectroscopy
In order to widen the understanding of the individual electrochemical features and their activation
energies and to obtain ionic movement coefficients, low and high-potential SEIs were investigated
using EIS. As representatives, we considered 450 and 300 mV as lowest/highest potential of the
high/low formation potential regime, respectively. The characteristics of SEIs formed at those two
potentials differ significantly, yet the two potentials are very close to each other. This underlines the
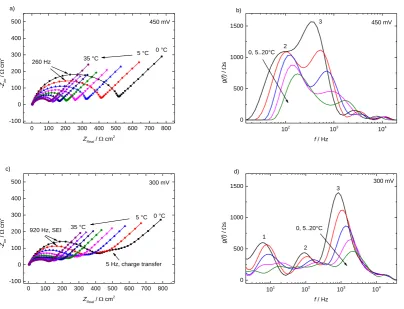
“step” characteristics of the changes between the two regimes. Figure 6 shows the Nyquist plots and
the Distribution of Relaxation Times (DRT) g(f), the latter calculated following the scheme from refs
[73] and [74]. g(f) is presented only in the regions where both real and imaginary residuals are
reasonably small. The DRT plots of all temperatures, DRT residuals and Bode phase plots can be
found in the SI. The spectra were recorded around OCP at 5 K steps starting from 0 °C up to 35 °C as
indicated by the arrows, though for better illustration DRT slopes above 20 °C are not shown. The
OCP remained constant in the entire temperature interval at ~3.23 V. The high frequency intercepts
decrease with rising temperature from 5 Ω cm2 down to 2.5 Ω cm2, which can be assigned to the
variation of the electrolyte bulk conductivity [75].
The high-potential SEI in Figure 6a and b exhibits the following features: The Nyquist plots consist of
a single distorted semicircle in the whole temperature interval. DRT plots in the shown frequency
region show two broad overlapping peaks assigned as numbers 2 and 3. The frequency at the Nyquist
semicircle maximum is at 260 Hz (indicated by the arrow), which lies in between the two DRT peak
maxima. As discussed in detail the SI, DRT peak 3 shifts faster with rising temperature. The distortion
of the Nyquist plot and the width of the DRT peaks both indicate the existence of two scattered
features with different activation energies. This implies that SEIs cannot be sufficiently modeled with
simple RC-containing equivalent circuits. Respective attempts usually lead to good simulation fits,
though lack of physical meaning (e.g. Levi et al. used several RC-elements [76]).
Accepted
0 100 200 300 400 500 600 700 800 -100 0 100 200 300 400
500 450 mV
-ZIm / cm 2
ZReal / cm2
35 °C 5 °C 0 °C 260 Hz a) 102 103 104 0 500 1000
1500 450 mV
2 g( f) / s
f / Hz 3
0, 5..20°C b)
0 100 200 300 400 500 600 700 800 -100 0 100 200 300 400
500 300 mV
5 Hz, charge transfer 35 °C 5 °C -ZIm / cm 2
ZReal / cm
2
0 °C
920 Hz, SEI c) 101 102 103 104 0 500 1000 1500 g( f) / s
f / Hz 1 2 3 0, 5..20°C 300 mV d)
Figure 6: a) and b) Temperature dependent impedance spectra of a high-potential SEI (450 mV) in Fc/Fc+ environment presented as Nyquist and DRT plots. c)
and d) Respective impedance spectra of a low-potential SEI (300 mV) presented as Nyquist and DRT plots.
For the low-potential SEI, temperature dependent Nyquist and DRT plots (Figure 6c and d) show more
features than for the high-potential SEI. Nyquist plots consist of a large distorted semicircle at high
frequencies, followed by a small distorted semicircle in the low frequency region. The smaller
semicircle disappears with rising temperature. It is common to assign low frequency semicircles to the
Li/Li+ charge transfer process, whilst high frequency semicircles are related to the ion migration
through the SEI [12,58,77,78]. Although the charge transfer in the system was Fc/Fc+ instead of
Li/Li+, the two distorted semicircles will be referred to as SEI and charge transfer semicircle,
respectively. The low frequency charge transfer semicircle shows a corresponding peak in the DRT
plot at ~5 Hz assigned as peak 1. The Nyquist maximum at around 920 Hz corresponds nicely with
DRT peak 3. DRT peak 2 frequencies resemble almost the values form the DRT analysis of the
high-potential SEI in Figure 6b. Both charge transfer and SEI impedances in the Nyquist plot decrease with
increasing temperature, as obvious from the shrinking semicircles, particularly the disappearing charge
transfer semicircle in Figure 6c as well as the DRT peak shift towards higher regions in Figure 6d. We
attribute this movement characteristics to mechanism-specific activation energies, which we discuss in
more detail in the SI.
For both SEIs, the DRT peaks are rather broad. On porous electrodes, such peak broadening is caused
by through-plane distributions [73], whereas on a flat electrode like HOPG we tentatively assign it
laterally inhomogeneous surface layer properties.
Accepted
[image:17.595.91.496.75.384.2]Both kinds of SEIs share the high frequency SEI Nyquist semicircle as a common feature with a
similar total ohmic resistance. In the DRT picture, this is reflected in similar peaks 2 and 3, while the
low-potential SEI includes another charge transfer feature (DRT peak 1). In both Nyquist and DRT
plots the charge-transfer related features can only be separated from migration (high frequency) and
diffusion (low frequency) when the charge transfer itself becomes slower, i.e., kinetically more
hindered. That is only the case for the low-potential SEI (Figure 6c and d) and only at lower
temperatures. The fact that it becomes distinguishable at all, however, is an important indicator that
the formation potential does not only influence the porosity and tortuosity (influence on ion migration
and diffusion) but also hinders the reaction kinetics (consistent with CV rate constants in Table 1).
Therefore, the slightly broader high frequency response of the 450 mV SEI in both Nyquist and DRT
plots (Figure 6a and b) is not to be confused with the actual Fc/Fc+ migration impedance as it probably
includes the respective charge transfer contribution (DRT peak 1).
EIS allowed the distinct separation of two mechanisms, the ionic movement and the charge transfer. In
the SI we analyze the temperature dependency of the two kinds of SEIs and calculate activation
energies of charge transfer and ionic movement. The activation energies for diffusion and migration of
Fc/Fc+ are significantly smaller than the value for charge transfer, indicating that electrons have to
overcome significant energy barriers, with notable effects in particular at low temperatures.
Furthermore, EIS showed that ionic movement is similar in the different SEIs, while the charge
transfer is significantly more hindered in the presence of low-potential SEIs as compared to
high-potential SEIs. Although EIS addresses completely different physical parameters, results qualitatively
replicate the findings from CV experiments.
3.4.
Discussion
We discuss our findings in the framework of the simplified two-layer model of the SEI, best
represented by this sequence electrode | SEI (compact layer) | SEI (porous layer) | electrolyte. This
neglects lateral inhomogeneities and reduces the SEI to a thin compact layer at the electrode surface
and a significantly thicker porous layer on the electrolyte side (see Figure 7). The compact layer is
quasi solid and Li+ conductive, while the porous layer is soaked with electrolyte. The desolvation of
Li+ takes place at the interface between compact and porous layer [36,37,45,49,53,79–83]. Inorganic
species like Li2CO3 are believed to arise close to the electrode surface, while porous organic species
are usually accumulated at the electrolyte side [22,45,49,84,85]. We suggest that SEI formation on
HOPG splits into the following steps, which will be justified in this chapter.
Accepted
> 700 mV Only negligible electrolyte reduction without an insulating surface
coverage. The formed species are soluble and stripped off when
re-increasing the potential.
First Step: ~700 mV Formation of a porous long-chained organic interphase affecting ionic
movement properties. Thin electronically insulating organic compact
layer on the surface passivates further electrolyte reduction. Second Step: ~400 mV Reduction of pre-formed organic compact SEI forms thicker
inorganic compact SEI at electrode surface. Shortening of organic chains leads to further reduces effective diffusion coefficient in porous
layer.
Starting with the compact layer: it is the substantial passivation factor, since it is supposed to be
impermeable and electronically insulating. While all investigated SEIs in this work are passivating
towards further electrolyte reduction, XPS results point out differences by means of elemental
concentrations, in particular Li2CO3 existence. Therefore, although passivating, the high-potential
compact layer must consist of organic species. On the other hand, XPS showed significant amounts of
inorganic species in low-potential SEIs, which consequently must be formed via reduction of the
pre-formed organic compact layer. This is in agreement with the findings of both Matsouka et al. and Tang
et al., who found CV reduction peaks at high potentials only in the first cycle, while the subsequent
cycles included only the second (low-potential) reduction peak [29,35].
Effective tunneling thickness of the compact layer. Obviously, the presence and kind of a passivated SEI affects the kinetics though does not fully inhibit the Fc/Fc+ reaction. The trend in
reaction rate constant k0,ν shown in Table 1 invites for a quantitative discussion of the Fc/Fc+ reaction
kinetics. The kinetics are strongly correlated to the formation potential, which allows us excluding two
hypotheses: Neither is the SEI re-oxidized or becomes conductive at ~3.2 V (where the Fc/Fc+
experiments were performed), nor is Fc/Fc+ able to migrate or diffuse to the electrode surface.
Otherwise we would have expected formation potential independent kinetics. Thus, independent of
their chemical properties, the compact layer microphases proposed by Peled et al. [85] must be
attached tightly so that the compact layer cannot be penetrated by the Fc/Fc+ species. We support the
hypothesis that electrons tunnel through the passivated SEI to react with Fc/Fc+ [30,86]. Since the
porous layer is soaked with electrolyte, the tunneling takes place through the compact layer. The
proposed total reaction mechanism is schematically shown in Figure 7.
Accepted
Figure 7: Proposed reaction mechanism of Fc/Fc+ at HOPG covered by an SEI. The electrons must tunnel through the insulating and impermeable compact layer
leading to an additional exponential term in the rate constant of the outer sphere reaction. The diffusion/migration limitation is determined by the outer porous
layer mainly consisting of organic compounds.
Fc/Fc+ is known to have an outer-sphere reaction, at which the electrons have to tunnel through a shell
surrounding the electrochemical active center [87,88]. If the shell radius being the minimum tunneling
distance is described as d0, in accordance with the Marcus theory the reaction rate constant k0 on
pristine HOPG is directly proportional to exp(−𝛾𝑑0). 𝛾 > 0 describes the tunneling probability and
depends among others on the tunneling energy barrier.
Assuming that the compact SEI layer does nothing more than adding a further tunneling barrier with a
thickness dSEI and a tunneling probability 𝛽 > 0, we get
𝑘0∝ exp(−𝛾𝑑0− 𝛽𝑑𝑆𝐸𝐼) (3)
for the rate constant proportionality on SEI covered HOPG. The rate constant calculated for pristine
HOPG, 𝑘0𝑃𝑟𝑖𝑠𝑡𝑖𝑛𝑒, corresponds to the special case where 𝑑𝑆𝐸𝐼= 0. It actually provides the
proportionality constant between the rate constant of an SEI covered sample and the compact layer
thickness:
𝑘0= 𝑘0𝑃𝑟𝑖𝑠𝑡𝑖𝑛𝑒exp(−𝛽𝑑
𝑆𝐸𝐼) (4)
⇒ 𝑑𝑆𝐸𝐼 = −1 𝛽ln (
𝑘0
𝑘0𝑃𝑟𝑖𝑠𝑡𝑖𝑛𝑒) with 𝑘0≤ 𝑘0𝑃𝑟𝑖𝑠𝑡𝑖𝑛𝑒 (5)
The factor β could not be determined in this study. Table 2 shows the resulting 𝛽 𝑑𝑆𝐸𝐼,𝜈 calculated
from 𝑘0,𝜈 values from Table 1. β should mainly depend on the energy levels of the tunneling barrier
neighborhood, therefore we assume β invariant. Thus, the presented “thicknesses” can be directly
compared. Although the SEI thicknesses of the 600 and 450 mV SEIs differ slightly, the switchover to
the low-potentials doubles the calculated compact layer thickness. The 450 mV, although being an
edge potential before the second formation step, might thermodynamically already enable second step
reactions in small rates [35]. This would be consistent with a slightly thicker compact layer of the
Accepted
450 mV SEI as compared to the 600 mV SEI. We would also like to be mention that a possibly
incorrectly defined Randles-Sevcik correction factor ξ in eq. (1) would have no effect on these
thickness values as ξ becomes obsolete in eq. (5).
Table 2: SEI thicknesses calculated using eq. (5) resulting from CVs at 50 and 10 mV s-1. The factor β could not be determined experimentally, though can be
assumed to be invariant.
600 mV 450 mV 300 mV 100 mV
𝜷 ∙ 𝒅𝑺𝑬𝑰,𝟓𝟎 0.38 0.50 0.96 1.0
𝜷 ∙ 𝒅𝑺𝑬𝑰,𝟏𝟎 0.32 0.51 0.99 1.0
Evolution of Transport Properties. Particular attention also needs to be paid on the Fc/Fc+ transport
properties, which are defined by the outer porous layer that mainly consist of organic compounds. The
diffusion coefficient (Table 1) is reduced significantly during the first formation step (at ~700 mV).
The further reduction between the 300 and 100 mV SEI could be caused by a reaction at ~400 mV,
which though is sluggish and demands a high overpotential to be activated (not sufficiently given at
300 mV). One may speculate, that the reaction step could consist of a shortening of the long chained
organic molecules in the porous layer. The resulting changes affect the SEI adsorption properties,
which lead to the change in diffusion activation energies (presented in SI) [89]. The intrinsic diffusion
coefficient is assumed to not be affected by the presence of surface layers. In agreement with Tang et
al., we suggest, that the shorter polymer chains form a tighter and less porous layer with higher
tortuosity and a reduced effective diffusion coefficient [37]. This hypothesis was also studied in more
detail and will be in the focus of a future publication [90].
Transferability to commercial electrode material. It is important to mention that both the obtained trends in kinetics and transport properties of Fc/Fc+ are not necessarily transferable to Li+ [91]. E.g. the
trend in effective diffusion coefficient is not expected to be relevant, since the actual transport
limitations are given by the Li+ migration through compact inorganic layer (which we consider
impermeable for Fc/Fc+). On the other hand, Li+ intercalation rate constant is not determined by
surface layers, but by other properties like the Li+ desolvation and the ratio of graphite surface
orientation [31,78]. Though, the ability of Fc/Fc+ to react via a tunneling is believed to be also possible
for other transition metal cations like Mn2+ (particularly under those high driving forces:
overpotentials > 1 V), which is important for longer-term cell degradation by side reactions like
ongoing SEI growth.
In our study we could show that, on HOPG, the low-potential compact SEI is a product of
high-potential SEI decomposition. Thus, having in mind commercial composite electrodes, the “optimal”
reaction conditions of the two reaction steps might differ significantly. We believe that particularly the
second step, which is located in the potential operation region of anodes, is crucial for the stability as
Accepted
well as physicochemical properties of the final SEI. On the other hand, since the second step reactions
depend on the quantity and quality of the high-potential SEI, formation protocols should be optimized
also in terms of improving the high-potential SEI properties. A first study validating this assumption
was recently published by our group [92].
3.5.
Conclusion
HOPG was used to study SEI formation at potentiostatic conditions, which are achievable without
strong cell polarization due to the low surface area of this sample. Furthermore, the basal plane of
HOPG is chemically inert, and Li+ intercalation is negligible. We studied SEIs formed at four different
potentials (600, 450, 300, 100 mV), analyzing their chemical composition by ex-situ XPS and their
electrochemical (transport) properties through the interaction with Fc/Fc+ as a probe species.
SEI formation is found self-terminating, hence self-passivating at all potentials investigated, which
implies the formation of an electronically insulating layer, which is also impermeable for SEI-forming
electrolyte components (thus: compact layer). XPS revealed Li2CO3 formation only for the two lower
formation potentials (300 and 100 mV), i.e. the high-potential compact SEI is essentially organic. This
also shows that, contrary to prevalent opinion, carbonate formation is not necessary for electrode
passivation. The SEI formation process in commercial cells makes use of galvanostatic conditions,
which leads to a slow potential sweep from higher to lower potentials. Given that our results indicate a
suppression of direct electrochemical electrolyte decomposition already by the high-potential SEI, we
conclude that the typical carbonate layers found after such galvanostatic SEI formation, which is
performed at least down to Li+ intercalation potentials (< 220 mV vs. Li/Li+), result from further
electrochemical decomposition of the pre-formed high-potential organic compact SEI.
The presence of a compact SEI after formation is also confirmed by Fc/Fc+ cyclic voltammetry and
corresponding EIS experiments. For all four potentials, those measurements revealed significant
inhibition of charge transfer kinetics through the SEIs as compared to pristine HOPG. In agreement
with the XPS observation of carbonate only for the low-potential (300 and 100 mV) SEIs, we also find
that the latter exhibit much more sluggish electron transfer kinetics than the high-potential (600 and
450 mV) SEIs. Based on a simple electron tunneling model, these observations allowed us to calculate
the factors by which the effective tunneling distances change, which we tentatively associate with the
thicknesses of the compact SEIs.
As a side result, the CV and EIS data also reveal some information about the ionic movement
(migration and diffusion) through the outer part of the SEI, the porous layer: effective permeability is
found to decrease with decreasing formation potential, which we tentatively assign to a shortening of
the organic polymer chains formed from ring-opening reactions of ethylene and vinylene carbonate.
Accepted
In summary, the previously described two-step process of SEI formation would start at ~700 mV with
the formation of an organic compact layer (covered by a porous one), which is then itself reduced to a
much thicker compact, yet inorganic (carbonate containing) layer once potentials drop (either in a CV
or due to galvanostatic control) to below ~400 mV. Knowing that, we conclude that by controlling the
chemical and physical properties of the high-potential SEI, one can significantly influence the
respective properties of the final low-potential SEI and thus influence the lifetime and conductivity
properties of SEIs in commercial cells.
4.
Acknowledgements
We gratefully acknowledge the fruitful discussions with Stefan Klink and Giorgia Zampardi (formerly
RU Bochum) on the stability of ferrocene complexes, with Sebastian Keller (BMW Group) on the
Laplace transformation and with Kevin Leung (Sandia National Lab) on the theoretical perspectives.
5.
References
[1] M. Winter, W.K. Appel, B. Evers, T. Hodal, K.-C. Möller, I. Schneider, M. Wachtler, M.R.
Wagner, G.H. Wrodnigg, J.O. Besenhard, Monatsh. Chem. 132 (2001) 473–486.
[2] J. Vetter, P. Novak, Wagner, C. Veit, K.-C. Möller, J.O. Besenhard, M. Winter, M.
Wohlfahrt-Mehrens, C. Vogler, A. Hammouche, J. Power Sources 147 (2005) 269–281.
[3] D.P. Abraham, J.L. Knuth, D.W. Dees, I. Bloom, J.P. Christophersen, J. Power Sources 170
(2007) 465–475.
[4] Y. Ein-Eli, B. Markovsky, D. Aurbach, Y. Carmeli, H. Yamin, S. Luski, Electrochim. Acta 39
(1994) 2559–2569.
[5] D. Andre, S.-J. Kim, P. Lamp, S.F. Lux, F. Maglia, O. Paschos, B. Stiaszny, J. Mater. Chem. A 3
(2015) 6709–6732.
[6] Y. Li, M. Bettge, B. Polzin, Y. Zhu, M. Balasubramanian, D.P. Abraham, J. Electrochem. Soc.
160 (2013) A3006-A3019.
[7] D. Aurbach, E. Zinigrad, Y. Cohen, H. Teller, Solid State Ionics 148 (2002) 405–416.
[8] P. Verma, P. Maire, P. Novak, Electrochim. Acta 55 (2010) 6332–6341.
[9] M.B. Pinson, M.Z. Bazant, J. Electrochem. Soc. 160 (2013) A243-A250.
[10] J.-Y. Eom, I.-H. Jung, J.-H. Lee, J. Power Sources 196 (2011) 9810–9814.
[11] H. Ota, Y. Sakata, A. Inoue, S. Yamaguchi, J. Electrochem. Soc. 151 (2004) A1659-A1669.
[12] D. Aurbach, K. Gamolsky, B. Markovsky, Y. Gofer, M. Schmidt, U. Heider, Electrochim. Acta
47 (2002) 1423–1439.
[13] B. Stiaszny, J.C. Ziegler, E.E. Krauß, J.P. Schmidt, E. Ivers-Tiffée, J. Power Sources 251 (2014)
439–450.
[14] M. Zhou, L. Zhao, S. Okada, J.-i. Yamaki, J. Electrochem. Soc. 159 (2011) A44-A48.
Accepted
[15] D. Aurbach, A. Zaban, Y. Ein-Eli, I. Weissman, O. Chusid, B. Markovsky, M. Levi, E. Levi, A.
Schechter, E. Granot, J. Power Sources 68 (1997) 91–98.
[16] W. Märkle, C.-Y. Lu, P. Novak, J. Electrochem. Soc. 158 (2011) A1478-A1482.
[17] E. Peled, D. Golodnitsky, C. Menachem, D. Bar-Tow, J. Electrochem. Soc. 145 (1998) 3482–
3486.
[18] A. Schechter, D. Aurbach, H. Cohen, Langmuir 15 (1999) 3334–3342.
[19] E. Peled, D. Bar Tow, A. Merson, A. Gladkich, L. Burstein, D. Golodnitsky, J. Power Sources 97
(2001) 52–57.
[20] S.S. Zhang, K. Xu, T.R. Jow, Electrochim. Acta 49 (2004) 1057–1061.
[21] E. Peled, D. Golodnitsky, A. Ulus, V. Yufit, Electrochim. Acta 50 (2004) 391–395.
[22] D. Aurbach, J. Power Sources 89 (2000) 206–218.
[23] M. Tang, S. Lu, J. Newman, J. Electrochem. Soc. 159 (2012) A1775-A1785.
[24] S. Zhang, M.S. Ding, K. Xu, J. Allen, T.R. Jow, Electrochem. Solid-State Lett. 4 (2001)
A206-A208.
[25] M. P. Mercer, H. E. Hoster, Nano Energy 29 (2016) 394–413.
[26] N.M. Markovic, Surf. Sci. Rep. 45 (2002) 117–229.
[27] D. Bar-Tow, E. Peled, L. Burstein, J. Electrochem. Soc. 146 (1999) 824–832.
[28] J. Ma, L. Seidl, W. Ju, E. Mostafa, L. Asen, S. Martens, U. Stimming, O. Schneider, ECS Trans.
64 (2014) 407–423.
[29] M. Tang, K. Miyazaki, T. Abe, J. Newman, J. Electrochem. Soc. 159 (2012) A634-A641.
[30] M. Tang, J. Newman, J. Electrochem. Soc. 159 (2012) A1922-A1927.
[31] Y. Yamada, Y. Iriyama, T. Abe, Z. Ogumi, Langmuir 25 (2009) 12766–12770.
[32] Y. Domi, M. Ochida, S. Tsubouchi, H. Nakagawa, T. Yamanaka, T. Doi, T. Abe, Z. Ogumi, J.
Phys. Chem. C 115 (2011) 25484–25489.
[33] G. Zampardi, F. La Mantia, W. Schuhmann, RSC Adv (2015).
[34] P. Lu, C. Li, E.W. Schneider, S.J. Harris, J. Phys. Chem. C 118 (2014) 896–903.
[35] O. Matsuoka, A. Hiwara, T. Omi, M. Toriida, T. Hayashi, C. Tanaka, Y. Saito, T. Ishida, H. Tan,
S.S. Ono, others, J. Power Sources 108 (2002) 128–138.
[36] M. Tang, J. Newman, J. Electrochem. Soc. 158 (2011) A530-A536.
[37] M. Tang, J. Newman, J. Electrochem. Soc. 159 (2012) A281-A289.
[38] R.R. Jaini, B.P. Setzler, A.G. Star, T.F. Fuller, J. Electrochem. Soc. 163 (2016) A2185-A2196.
[39] M.T. Dinh-Nguyen, C. Delacourt, J. Electrochem. Soc. 163 (2016) A706-A713.
[40] D. Strmcnik, I.E. Castelli, J.G. Connell, D. Haering, M. Zorko, P. Martins, P.P. Lopes, B.
Genorio, T. Østergaard, H.A. Gasteiger, F. Maglia, B.K. Antonopoulos, V.R. Stamenkovic, J.
Rossmeisl, N.M. Markovic, Nat Catal 1 (2018) 255–262.
[41] H.E. Hoster, Nat Catal 1 (2018) 236–237.
[42] C. Ashworth, Nat Rev Mater (2018).
Accepted
[43] D. Lu, M. Xu, L. Zhou, A. Garsuch, B.L. Lucht, J. Electrochem. Soc. 160 (2013) A3138-A3143.
[44] M. Xu, L. Zhou, Y. Dong, Y. Chen, A. Garsuch, B.L. Lucht, J. Electrochem. Soc. 160 (2013)
A2005-A2013.
[45] K. Edström, M. Herstedt, D.P. Abraham, J. Power Sources 153 (2006) 380–384.
[46] Y.-C. Lu, A.N. Mansour, N. Yabuuchi, Y. Shao-Horn, Chem. Mater. 21 (2009) 4408–4424.
[47] Y. Park, S.H. Shin, H. Hwang, S.M. Lee, S.P. Kim, H.C. Choi, Y.M. Jung, J. Mol. Struct. 1069
(2014) 157–163.
[48] M.-J. Kim, J.-T. Yeon, K. Hong, S.-I. Lee, N.-S. Choi, S.-S. Kim, Bull. Korean Chem. Soc. 34
(2013) 2029–2035.
[49] A.M. Andersson, A. Henningson, H. Siegbahn, U. Jansson, K. Edström, J. Power Sources 119
(2003) 522–527.
[50] H. Bryngelsson, M. Stjerndahl, T. Gustafsson, K. Edström, J. Power Sources 174 (2007) 970–
975.
[51] R. Dedryvere, H. Martinez, S. Leroy, D. Lemordant, F. Bonhomme, P. Biensan, D. Gonbeau, J.
Power Sources 174 (2007) 462–468.
[52] V. Eshkenazi, E. Peled, L. Burstein, D. Golodnitsky, Solid State Ionics 170 (2004) 83–91.
[53] A.v. Cresce, S.M. Russell, D.R. Baker, K.J. Gaskell, K. Xu, Nano Letters 14 (2014) 1405–1412.
[54] M. Xu, D. Lu, A. Garsuch, B.L. Lucht, J. Electrochem. Soc. 159 (2012) A2130-A2134.
[55] M. Nie, B.L. Lucht, J. Electrochem. Soc. 161 (2014) A1001-A1006.
[56] L. Yang, B. Ravdel, B.L. Lucht, Electrochem. Solid-State Lett. 13 (2010) A95.
[57] M. Herstedt, D.P. Abraham, J.B. Kerr, K. Edström, Electrochim. Acta 49 (2004) 5097–5110.
[58] H. Ota, K. Shima, M. Ue, J.-i. Yamaki, Electrochim. Acta 49 (2004) 565–572.
[59] K. Xu, Chem. Rev. 104 (2004) 4303–4418.
[60] D. Aurbach, B. Markovsky, I. Weissman, E. Levi, Y. Ein-Eli, Electrochim. Acta 45 (1999) 67–
86.
[61] K. Tasaki, A. Goldberg, J.-J. Lian, M. Walker, A. Timmons, S.J. Harris, J. Electrochem. Soc. 156
(2009) A1019-A1027.
[62] D. Aurbach, M.D. Levi, E. Levi, A. Schechter, J. Phys. Chem. B 101 (1997) 2195–2206.
[63] N.G. Tsierkezos, J Solution Chem 36 (2007) 289–302.
[64] G. Zampardi, E. Ventosa, F. La Mantia, W. Schuhmann, Chem. Commun. 49 (2013) 9347–9349.
[65] K.M. Abraham, D.M. Pasquariello, E.B. Willstaedt, J. Electrochem. Soc. 137 (1990) 1856–1857.
[66] N. Tsierkezos, U. Ritter, J Appl Electrochem 40 (2010) 409–417.
[67] C. Cannes, F. Kanoufi, A.J. Bard, J. Electroanal. Chem. 547 (2003) 83–91.
[68] M. Nádherná, J. Reiter, Electrochim. Acta 55 (2010) 5911–5916.
[69] H. Matsuda, Y. Ayabe, Zeitschrift für Elektrochemie, Berichte der Bunsengesellschaft für
physikalische Chemie 59 (1955) 494–503.
Accepted
[70] A.J. Bard, L.R. Faulkner, Electrochemical methods: Fundamentals and applications, 2nd ed.,
Wiley, New York, 2001.
[71] C.H. Hamann, A. Hammnett, W. Vielstich, Electrochemistry, 2nd ed., Wiley-VCH Verlag GmbH
& Co. KGaA, 2007.
[72] C.O. Laoire, E. Plichta, M. Hendrickson, S. Mukerjee, K.M. Abraham, Electrochim. Acta 54
(2009) 6560–6564.
[73] J.P. Schmidt, P. Berg, M. Schönleber, A. Weber, E. Ivers-Tiffée, J. Power Sources 221 (2013)
70–77.
[74] J.P. Schmidt, T. Chrobak, M. Ender, J. Illig, D. Klotz, E. Ivers-Tiffée, J. Power Sources 196
(2011) 5342–5348.
[75] D. Moosbauer, S. Zugmann, M. Amereller, H.J. Gores, J. Chem. Eng. Data 55 (2010) 1794–
1798.
[76] M.D. Levi, G. Salitra, B. Markovsky, H. Teller, D. Aurbach, U. Heider, L. Heider, J.
Electrochem. Soc. 146 (1999) 1279–1289.
[77] D. Aurbach, M.D. Levi, E. Levi, H. Teller, B. Markovsky, G. Salitra, U. Heider, L. Heider, J.
Electrochem. Soc. 145 (1998) 3024–3034.
[78] Y. Yamada, K. Miyazaki, T. Abe, Langmuir 26 (2010) 14990–14994.
[79] M. Winter, J.O. Besenhard, M.E. Spahr, P. Novák, Adv. Mater. 10 (1998) 725–763.
[80] P. Niehoff, S. Passerini, M. Winter, Langmuir 29 (2013) 5806–5816.
[81] G. Zampardi, F. La Mantia, W. Schuhmann, Electrochem. Commun. 58 (2015) 1–5.
[82] A. Wang, S. Kadam, H. Li, S. Shi, Y. Qi, npj Comput Mater 4 (2018) 359.
[83] S. Shi, P. Lu, Z. Liu, Y. Qi, L.G. Hector, H. Li, S.J. Harris, J. Am. Chem. Soc 134 (2012) 15476–
15487.
[84] A. Zaban, D. Aurbach, J. Power Sources 54 (1995) 289–295.
[85] E. Peled, D. Golodnitsky, G. Ardel, J. Electrochem. Soc. 144 (1997) L208-L210.
[86] D. Li, D. Danilov, Z. Zhang, H. Chen, Y. Yang, Notten, P. H. L., J. Electrochem. Soc. 162 (2015)
A858-A869.
[87] A.P. Abbott, C.L. Miaw, J.F. Rusling, J. Electroanal. Chem. 327 (1992) 31–46.
[88] A.D. Clegg, N.V. Rees, O.V. Klymenko, B.A. Coles, R.G. Compton, J. Electroanal. Chem. 580
(2005) 78–86.
[89] B. Sakintuna, O. Çuhadar, Y. Yürüm, Energy Fuels 20 (2006) 1269–1274.
[90] B.K. Antonopoulos, A.-C. Gentschev, F. Maglia, H.E. Hoster, Manuscript in preparation.
[91] H.J. Ploehn, P. Ramadass, R.E. White, J. Electrochem. Soc. 151 (2004) A456.
[92] B.K. Antonopoulos, C. Stock, F. Maglia, H.E. Hoster, Electrochim. Acta 269 (2018) 331–339.