© 2019, IRJET | Impact Factor value: 7.34 | ISO 9001:2008 Certified Journal
| Page 1645
Effect of Different Soil Conditions on Seismic Response of Multi-Storey
Irregular Model using STAAD Pro. V8i
Barkha Verma
1, Anurag Wahane
21
M. Tech Student, Structural Engineering, SSIPMT, Raipur, C.G, India
2Assistant Professor, Civil Engineering Dept., CIET, Raipur C.G, India
---***---
Abstract
-
The study is to analyze & compare the seismic response G+9 storey RCC frame structure with varying soil condition (Hard, Medium and Soft soil) for seismic Zone V using latest software package STAAD Pro. The structural & seismic parameters are kept same for Model M1, M2 & M3 except the soil type. All three models are analyzed in Staad pro V8i software using the Equivalent Static method of seismic analysis. The response of the model is examined in terms of the maximum storey displacement, compressive stress in columns and quantity of steel required. The objective of the study is check the stability of the three model in different soil type conditions.Keywords - Staad pro. V8i, Equivalent Static method, Seismic analysis, EQX, EQZ, Zone V, G+9
1.
INTRODUCTION
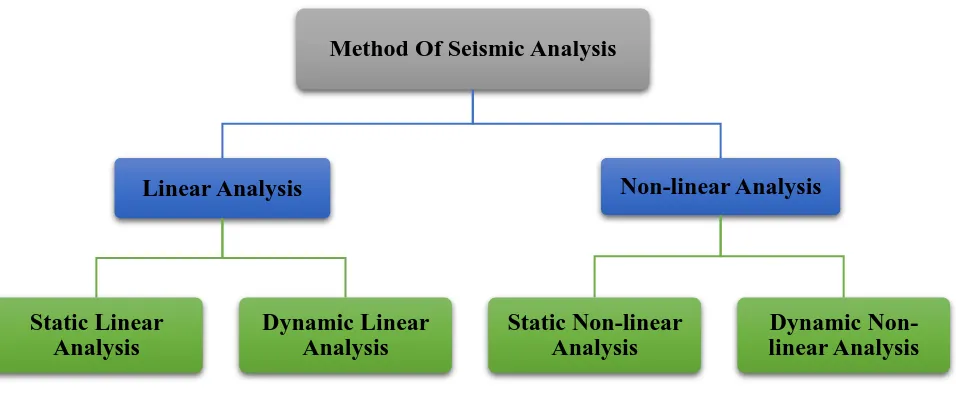
[image:1.612.71.549.416.616.2]Seismic analysis is a major tool in earthquake engineering which is used to understand the response of buildings due to seismic excitations in a simpler manner. It is a part of structural analysis and a part of structural design where earthquake is prevalent. Based on the type of external action and behavior of structure, the analysis can be further classified as shown in fig 1.
Fig. 1 Flowchart of Classification of Seismic Analysis
The equivalent lateral force for an earthquake is a unique concept used in earthquake engineering. The concept is attractive because it changes a dynamic analysis into partly dynamic and partly static analysis to determine the maximum displacement or member stresses developed in the structure due to seismic excitation. The equivalent static analysis procedure is essentially an elastic design technique.
Method Of Seismic Analysis
Linear Analysis
Static Linear
Analysis
Dynamic Linear
Analysis
Non-linear Analysis
Static Non-linear
Analysis
© 2019, IRJET | Impact Factor value: 7.34 | ISO 9001:2008 Certified Journal
| Page 1646
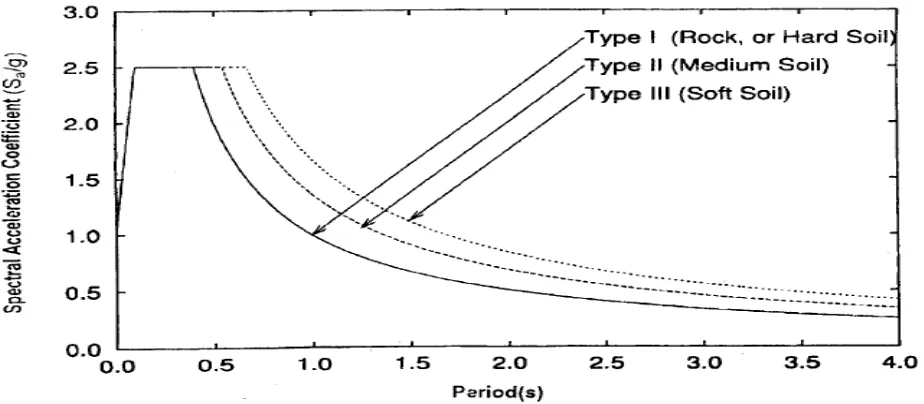
The soil condition is an essential field to study before seismic analysis of structure. The seismic wave generated from the focus below the ground level first interact with the soil then with rest of the structure hence the effect of the earthquake also depends upon the stiffness property of the soil stratum. According to IS 1893-2002 code soil condition is classified in following three types- Type I - Rock or Hard Soil: Well graded gravel and sand gravel and sand gravel mixtures with or without clay binder, and clayey sands poorly graded or sand clay mixtures (GB, CW, SB, SW, and SC) having N above 30, where N is the standard penetration value.
Type II - Medium Soil All soils with N between 10 and 30, and poorly graded sands or gravelly sands with little or no fines (SP) with N>15
[image:2.612.73.535.231.433.2] Type III - Soft Soil All soils other than SP with N.
Fig. 2 Flowchart of Classification of Seismic Analysis
2. LITERATURE REVIEW
Abhishek Verma[1], Abhishek Gupta[2], Arun Yadav[3] &Anant Jain[4] In this study, different soil strata are taken and corresponding base shear and storey drift is determined and compared with variation in floors as G+8, G+16 and G+24 and zone as 2, 3, 4 and 5. IS 1893: 2002 “Criteria for Earthquake Resistant Design of Structures” gives response spectrum for different types of soil. A building is modeled in ETABS. This research has immense benefits in the Geo-technical Earthquake field.
Amer Hassan[1], Shilpa Pal[2]In this paper, nonlinear time history and response spectrum analyses were carried out using Etabs-2015 software to study the influence of soil condition beneath the isolated base. The effects of soil flexibility are considered in the current study to examine the differences in spectral acceleration, base shear, story displacements, story drifts and story shear obtained following the seismic provisions of Indian standard code. The paper concluded that the hard soil and medium soil are suitable for base isolation building. In addition, analysis and design considerations for base isolated and conventional structures are suggested to enable the designer to get a better understanding at the preliminary design stage
© 2019, IRJET | Impact Factor value: 7.34 | ISO 9001:2008 Certified Journal
| Page 1647
levels of intensity of ground shaking, There are also maps of the principal tectonic features and lithological formations. This paper shows the soil condition effects studied by the various researchers.3. METHODOLOGY
The following three models with same structural dimensions are analyzed to understand the Influence of different soil type in seismic analysis of RCC frame are as follows namely -
First Model – “M1” (RCC Frame with Type -1 Hard Soil) Second Model – “M2” (RCC Frame with Type -2 Medium Soil) Third Model – “M3” (RCC Frame with Type -3 Soft Soil)
© 2019, IRJET | Impact Factor value: 7.34 | ISO 9001:2008 Certified Journal
| Page 1648
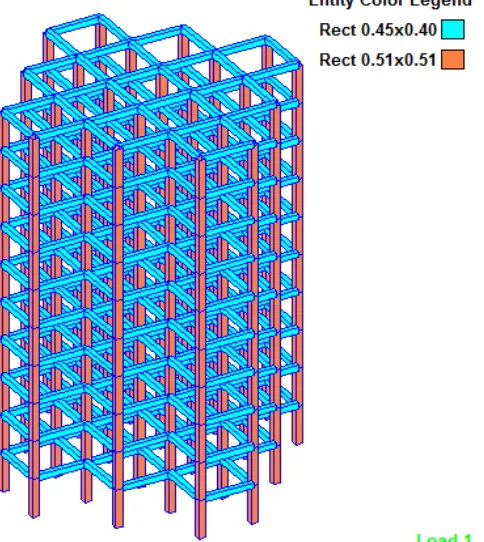
Fig. 2 Plan View and Isometric View of Models [image:4.612.123.488.448.606.2]The structural properties used on the current models is given in table 3.1 given below
Table 3.1 Structural Property Same For All Three Models
PARTICULAR OF ITEMS PROPERTIES
Total Built-Up Area For Case 1 Frame 400 m2
Number Of Stories G+9
Total Height of Structure 30 meter
Floor To Floor Height 3.0 meter
Beam Size 450 X 400 mm
Column Size 510 X 510 mm
Slab/Plate Thickness 120 mm
Main Wall Thickness 230mm
Partition Wall Thickness 150mm
Seismic parameter used for the analysis of all three models are given in table 3.2.
Table 3.2 Seismic Parameter Used For Analysis
SEISMIC PARAMETERS (AS PER IS 1893 Part -1 :2002)
Seismic Zone Zone –V
© 2019, IRJET | Impact Factor value: 7.34 | ISO 9001:2008 Certified Journal
| Page 1649
Zone Factor Z 0.36
Building Frame System Ordinary Moment Resisting Frame (OMRF)
Response Reduction Factor R 3.0
Importance Factor I All General Buildings (I =1)
Rock/Soil Type (Case 1) Hard Soil (Value = 1)
Rock/Soil Type (Case 2) Medium Soil (Value = 2)
Rock/Soil Type (Case 3) Soft Soil (Value = 3)
Structure Type RC Frame Building (Value = 1)
Damping Ratio 5% (Value = 0.05)
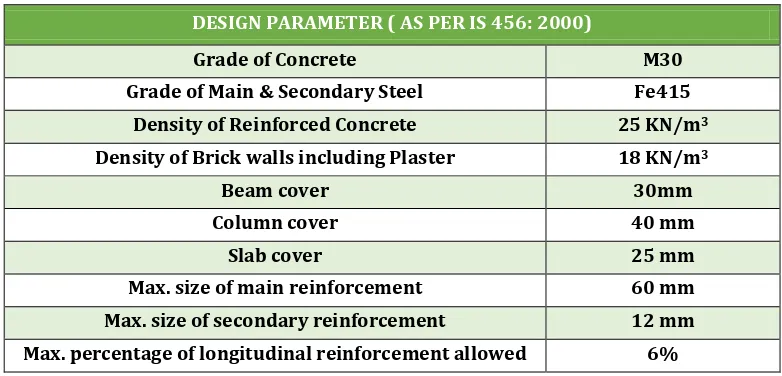
[image:5.612.110.501.308.496.2]Concrete design of the models are done by referring IS 456-2000. The design parameter used are given in table 3.3.
Table 3.3 Concrete Design Parameter Same For All Frame Cases
DESIGN PARAMETER ( AS PER IS 456: 2000)
Grade of Concrete M30
Grade of Main & Secondary Steel Fe415
Density of Reinforced Concrete 25 KN/m3
Density of Brick walls including Plaster 18 KN/m3
Beam cover 30mm
Column cover 40 mm
Slab cover 25 mm
Max. size of main reinforcement 60 mm
Max. size of secondary reinforcement 12 mm Max. percentage of longitudinal reinforcement allowed 6%
Calculation of Primary Loads Common for All the Frame Models-
IS 875 (PART-1) is referred for the values of unit weight of the structural materials for calculation of dead load and IS 875 (PART-2) is referred for the value of floor live load and roof live load.
Dead Load of the Beam and Column - This can be provided by applying load factor -1 Dead Load of the Slab = (unit weight of reinforced concrete X thickness of the slab)
o = 25X 0.12 = 3 KN/m2
Dead Load of the wall =(unit weight of the brick masonry X thickness X wall height) Dead Load of Exterior wall = 18X 0.23 X (3-0.4) = 10.764 KN/m
Dead Load of Interior Wall = 18X 0.15 X (3-0.4) = 7.02 KN/m
Live Load = 4 KN/m2
Roof Live Load = 1.5 KN/m2
Load Combinations - In the limit state design of reinforced and prestressed concrete structures, the following load combinations shall be accounted for as per IS
© 2019, IRJET | Impact Factor value: 7.34 | ISO 9001:2008 Certified Journal
| Page 1650
Create the plan of the model as shown in fig. by using grid in X-Z direction and provide height to the structure usingtransitional repeat along y direction.
Select beams parallel to X and Z direction and Create the plate/ slab by “filling grid with plates”. After creating frame model, section properties is defined i.e. beams, columns & slab.
Assigning of section properties to beam, columns and slabs for all storey by simultaneously selecting and assigning the respective property. Fixed supports is created and assigned to all the nodes at the bottom level of the model.
After that primary load cases are defined namely EQX, EQZ, DL, LL, And RLL by using “load & Definition” command bar. Enter the corresponding values of each primary load. Before entering the value of EQX and EQZ in equivalent static method the seismic definition is must be done.
Seismic loads are defined in the “seismic definition” by generating the values of seismic parameters as shown in table 3.2 for different models. Create load combinations as given in IS1893-2002.
Assign all the primary loads & load combinations simultaneously common for all three models
Concrete design of frame models are done using code IS 456-2000 and providing the design parameter and commands as given in table 3.3 common for all three models. After design give perform analysis command and click on Run analysis to get the output report of the analysis and design of the models.
4. RESULT & DISCUSSIONS
4.1 Maximum Storey Displacement
The comparison report of maximum storey displacement for model M1, M2 and M3 is given in the graph 1. The storey displacement is the lateral sway of the story with respect to its base. For all three model storey displacement is gradually increasing form base and maximum at top storey. According to the report the value of storey displacement in the top floor are
134.71 mm (M3 model)> 109.772 mm (M2 model)> 80.894 mm (M1 model).
Graph 1. Comparison Graph of Storey Displacement
4.2 Compressive Stress in Columns
The comparison report of the compressive stress for all three models is given graph 2. The compressive stress in column for all three models is maximum at the base floor and gradually reducing with increase in the storey height. Form comparison report the maximum value of the compressive stress at storey 1 are 35.707 N/mm2 (M3 model)> 31.107 N/mm2 (M3 model)>
25.765 N/mm2 (M3 model).
6.319 16.37 27.076 37.722 47.971 57.501
65.945 72.892
77.934 80.894
8.48 22.111 36.637 51.09 65.01 77.959 89.438
98.884 105.739
109.772 10.359 27.104 44.932 62.669 79.751 95.641 109.726 121.317
129.727 134.71
0 20 40 60 80 100 120 140 160
S t o r e y 1 S t o r e y 2 S t o r e y 3 S t o r e y 4 S t o r e y 5 S t o r e y 6 S t o r e y 7 S t o r e y 8 S t o r e y 9 S t o r e y 1 0
St or ey Di sp la cem ent ( In M m )
© 2019, IRJET | Impact Factor value: 7.34 | ISO 9001:2008 Certified Journal
| Page 1651
Graph 2. Comparison Graph of Compressive Stress in Columns4.3 Quantity of Steel
The comparison of quantity of steel for all three models is given in graph 3. The table shows quantity of steel bars of different diameter used in each model. Maximum steel is required in case of model M3 and minimum in model M1. The values of steel quantity are 659433 N (M3 model) > 536741 N (M2 model) > 413505 N (M1 model).
Graph 3. Comparison Graph of Compressive Stress in Columns
25.765 23.395 21.936 20.631 19.204 17.412 15.195 12.482 9.109 6.42 31.107 28.256 26.631 25.245 23.671 21.603 18.958 15.646 11.438 7.305 35.707 32.523 30.673 29.218 27.517 25.211 22.199 18.37 13.443 8.272 0 5 10 15 20 25 30 35 40
Storey 1 Storey 2 Storey 3 Storey 4 Storey 5 Storey 6 Storey 7 Storey 8 Storey 9 Storey 10
Co m p re ss ie S tr ess In Co lu m n (N/M m 2)
Model M1 Model M2 Model M3
413505 536741 659433 0 100000 200000 300000 400000 500000 600000 700000
Model M1 Model M2 Model M3
© 2019, IRJET | Impact Factor value: 7.34 | ISO 9001:2008 Certified Journal
| Page 1652
5. CONCLUSIONS
It is observed that the value of story displacement increases with decrease in stiffness property of soil stratum hence it is highest for model M3 with soft soil and lowest in case of M1 with hard soil. The maximum storey displacement at top storey in model M3 is approx. 1.23 times the displacement in M2 model and approx. 1.67 times the displacement in M1 model.
It is observed that the value of compressive stress in columns is maximum in model M3 and minimum in model M1 so it can be concluded that the stresses in the structural members increases with the reduction of stiffness property of soil. The maximum compressive stress at bottom storey in model M1 is 1.23 times the compressive stress in model M2 and 1.59
times the compressive stress in model M1.
The steel quantity required is maximum for model M3 and minimum in case of model M1. Steel quantity for model M3 is approx. 1.23 times the quantity of steel for model M2 and approx. 1.59 times quantity of steel of model M1 approx. So it can concluded that the quantity of steel increases with decrease in stiffness property of the soil.
REFERENCES
[1] IS: 1893(part 1): 2002, “Criteria for Earthquake Resistant Design of Structures”, part 1-General provisions and buildings, fifth revision, Bureau of Indian Standards, New Delhi, India.
[2] IS: 456-2000, “Code of Practice for Plain and Reinforced Concrete”, Bureau of Indian Standards, New Delhi, India.
[3] Amer Hassan & Shilpa Pal “Effect of soil condition on seismic response of isolated base buildings” International Journal of Advanced Structural Engineering (2018) published online: 3 September 2018.
[4] S.Mahesh & Dr.B.Panduranga Rao, “Comparison of analysis and design of regular and irregular configuration of multistory building in various seismic zones and various types of soils using ETABS and STAAD”, IOSR Journal of Mechanical and Civil Engineering (IOSR-JMCE) e-ISSN: 2278-1684, Volume 11, Issue 6 Ver. I (Nov- Dec. 2014).
[5] A. Parvathy Karthika & V. Gayathri “Literature Review on Effect of Soil Structure Interaction on Dynamic Behavior Of Buildings” IRJET,
e-ISSN: 2395-0056,
Volume: 05 Issue: 04 , Apr-2018BIOGRAPHIES
Ms. Barkha Verma, B.E in Civil Engineering, Pursuing M. Tech in Structural Engineering, SSIPMT, Raipur. I've published a paper journals such as High Performance Concrete & Its Applications In Civil Engineering.