Clustering the Quality of Coconut Wood based on Digital
Images and Compressive Test Values using the Fuzzy
C-Mean Method
Ottopianus Mellolo
Manado State Polytechnic Jl.Raya Politeknik Ds.Buha Kec.Mapanget Manado
Toban Tiku Pairunan
Manado State Polytechnic Jl.Raya Politeknik Ds.Buha
Kec.Mapanget Manado
Eliezer Mangoting Rongre
Manado State Polytechnic Jl.Raya Politeknik Ds.Buha
Kec.Mapanget Manado
ABSTRACT
Every part of coconut commodity can be useful. Coconut wood is a part of coconut trunk that is widely used as building materials, furniture products, souvenirs or fuel. Although coconut wood is useful, but most people are still difficult to recognize kind of shape or texture model of a good quality coconut wood. The method used to test the quality of conventional coconut wood still relies on the compressive test model. This study is directed to determine the quality of coconut wood by modeling the relationship between visualization of wood surface texture and the results of compressive strength testing. Samples of coconut wood in this research are taken from a variety of ages, the location of the trunk and the outer part and the inside of coconut wood. Coconut wood samples used contain less than 20% moisture content, then taken digital images. By using the Fuzzy C-Mean method for the two-measurement data, forming 3 centers of coconut wood quality cluster, from the results of this clustering it is concluded that coconut wood with high bundle density also has a high compressive quality value, bundle density above 30.83% classified as wood superior type coconut. Meanwhile, bundle density of less than 11.88% is classified as low-quality coconut wood, besides that it is a medium type.
General Terms
Image Processing.Keywords
Bundle, Image Processing, Coconut Wood.
1.
INTRODUCTION
Coconut is a tropical plant that can grow well in almost all parts of Indonesia, coconut plants are also a multi-functional plant where every part of this plant has benefits for humanity. Types of local coconut plants such as Coconut Kelapa Dalam Mapanget begin to bear fruit at the age of 5 years with a production of ± 3.5 tons / ha / year and can produce for 50 years. After the production period, generally farmers will rejuvenate by replacing plants that are not producing with new coconut plants. Coconut wood is the last benefit that can be taken from the coconut plant. Coconut wood can be used as building materials, furniture products and souvenirs and as fuel. Unlike wood sticks in general, coconut trunks have vascular bundles that spread more tightly around the edges near the skin and the base of the stem from the center of the stem and tip of the stem, this causes coconut sawn wood to have different strengths, although taken from the same coconut stem. Along with reduced forest products, the supply of wood in the market began to decrease, consumers began to
look for other alternatives such as the use of coconut wood, even the strength is also not inferior to other types of wood. in choosing and buying coconut wood depending on the accuracy of consumers. Consumers who want to choose coconut wood all this time, usually only use manual methods such as observing the appearance of wood fiber, wood is compared with each other and the one chosen is one that has a rough surface and denser bundle density, this method is the only method choose the best among available without a certain standard about the strength of the wood to be chosen, the soft part of the wood is generally on the outside or close to the skin but different in coconut wood instead the hardest part is the closest to the skin, this part is easily recognizable in coconut wood especially coconut wood which still leaves (still visible) the skin and this part is usually not neat. This research is directed to identify by clustering the quality of coconut wood, especially the quality of compressive strength, namely the strength of coconut wood to withstand the burden given to it that can be identified using digital images.
2.
LITERATURE REVIEW
2.1
Digital Image Processing
Digital image processing refers to processing two-dimensional images using a computer. In the broader context digital image processing refers to the processing of each two-dimensional data. Digital image is an array of real and complex values that are represented by a certain row of bits. A digital image can be expressed as a two-dimensional function f (x, y) which is the size of M lines and N columns with x and y is the position of spatial coordinates and amplitude f at the coordinate point (x, y) is called the intensity or gray level of the image on that point. If the value of x, y and the amplitude value of f is finite and is discrete, then it can be said that the image is a digital image. Grayscale image is a digital image that has only one channel value in each pixel, the value is used to show the gray intensity level from black to white with an eight-bit color depth. Binary image is a digital image that has only two possible pixel values, namely black and white. Binary image is also called monochrome image. It only takes one bit to represent the value of each pixel. [1]
Image quality improvement is an important pre-process step before analyzing and representing images. Histogram equalization is a method to improve the image by changing the distribution of the gray level of the image. This is intended so that the gray level distribution is more evenly distributed than the original image [2]
modes. In the image f (x, y) which consists of bright objects on a dark background, a clear way to extract objects from the background is to choose the T value that divides that modes then any point (x, y) for where f(x, y) ≥ T is called the object point while the other is called the back ground point as defined in equation (1).
(1)
Pixels with a value of 1 are related to the object, while pixels that are 0 are related to the background. This approach is called global threshold. [3]
2.2
Wood Compressive Strength Standard
The main indicator of the quality of coconut wood can be seen from the large capacity of the wood to withstand the pressure that can be proven through the coconut wood press test. Some notions relating to this test method are: The compressive strength of structural building wood is the compressive force per unit area of the press field
The compressive strength parallel to the direction of the fiber is the strength of the wood bearing the load acting on it which is parallel to the direction of wood grain
Defective test specimens are wood test objects that are free of wood, sapwood, cracks, holes, molds, brittle and do not twist
Newton is a unit according to the International System (SI) for the equivalent force of 0.1 kg f and is written with N notation
Mega Pascal is 106Pascal equivalents to kg f / cm2
and is written with M Pa notation
Air dry wood is wood with a maximum moisture content of 20%
The parallel compressive strength of the fiber (f
c//) is
calculated as define in (2) by comparing the maximum test load (P) per unit area of the press field,
(2)
Scope of the testing method includes the requirements and method of testing wood with small defect free test items for air dry wood types. [4]
The characteristics of coconut wood are no homogeny both in longitudinal direction (stem height) or in radial or tangential direction transverse (stem diameter) and Conventional wood mechanical properties also apply on coconut wood. [5].
2.3
Fuzzy C-Mean Method
Fuzzy c-means (FCM) is a clustering method that allows each data point to belong to multiple clusters with varying degrees of membership. FCM is based on the minimization of the following objective function
where
D is the number of data points.
N is the number of clusters.
m is fuzzy partition matrix exponent for controlling the degree of fuzzy overlap, with m > 1. Fuzzy overlap refers to how fuzzy the boundaries between clusters are, that is the number of data points that have significant membership in more than one cluster.
xi is the ith data point.
cj is the center of the jth cluster.
μij is the degree of membership of xi in the jth
cluster. For a given data point, xi, the sum of the
membership values for all clusters is one.
fcm performs the following steps during clustering:
1. Randomly initialize the cluster membership values,
μij.
2. Calculate the cluster centers:
3. Update μij according to the following:
4. Calculate the objective function, Jm.
Repeat steps 2–4 until Jm improves by less than a specified
minimum threshold or until after a specified maximum number of iterations.
3.
METHODOLOGY
3.1
General Research Flow
The flow of research starts from sampling coconut wood that meets Indonesian national standards regarding wood samples and measurements such as the size of the sample dimensions and the water content in the sample.
Digital images of coconut wood were obtained and the quality of the samples was measured by a press test. From the digital image, feature features are extracted into wood strength indicators so that data on density, average bundle size in the image can be obtained. The extraction data is then compared with the measurement data to clustering 3 clusters of the coconut wood quality
3.2
Samples
Coconut wood sample preparation is carried out through the following stages: Sampling the samples were taken from local coconut wood type namely Kelapa Dalam Mapanget, which were approximately 20, 40, 60 and 80 years old, located in the
Fig. 2 Coconut Wood Samples
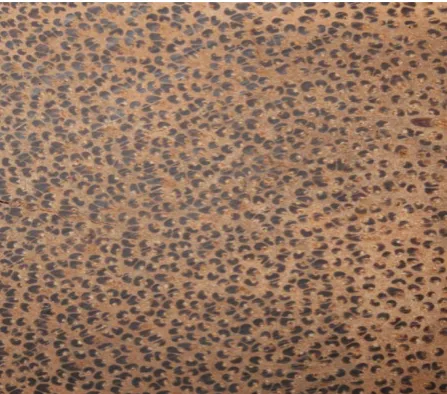
Image Acquisition Preparation, the coconut wood sample was then acquired by digital image on the cross-sectional side using a digital camera. Shooting using close up mode at a distance of 13 cm and lighting using camera flash, all digital image used has the same pixel size 1700px x 1700px.
Fig.3 Digital Image of Woo Coconut Sample
3.3
Measurements
Measurement of coconut wood samples that have been prepared will be divided into two main processes:
3.3.1
Compressive Strength Test Measurement
[image:3.595.317.541.72.209.2]This test is carried out on the physical sample of coconut wood as shown in figure 5. by giving a load to get the maximum limit of the ability of the sample to withstand the given load
Fig.5 Compressive Strength Test
3.3.2
Digital Image Sample Measurement
This measurement is done by extracting feature data contained in the digital image of coconut wood samples through a series of operations and image manipulation. Which can be described in the following flowchart shown in figure 6. The extraction process begins with the reading of digital images, while the sample image used physically is 1700 x 1700 pixels the digital image samples used in this study are RGB-colored digital images, each pixel in this image format still has three values, namely Red, Green and Blue so that a process is needed to unite these three values. This process will change the color image to Greyscale image. Greyscale image condition with an uneven gray level in an image allows features in the image that cannot be extracted properly so that a smoothing process is required by equalizing the histogram method until an almost uniform gray distribution is obtained, this process also helps separate objects from the background image behind him. The area of concern for extraction is the region that contains bundles in the image so that we need to separate the pixels that represent the bundle from the environment, the Threshold process helps us make a separation, and the pixel with a value less than the threshold becomes 0 while the opposite is worth 1 threshold image.
[image:3.595.56.280.304.501.2]Fig.6 Flowchart Extraction Feature Start
Read Image
RGB to Greyscale
Thresholds
Binary Image
Opening Image Process
Invert Image
T < f(x,y)
T ≥ f(x,y)
Mathematical Method
Density of Bundles, Measure Average of Object Bundles
4.
RESULT AND DISCUSSION
4.1
Image Measurement Software
Fig. 7 Image measurement
Image Measurement Software using threshold value T=0,4 and dimension of digital image sample 1700px X 1700px, measuring process as shoun in Figure 7.
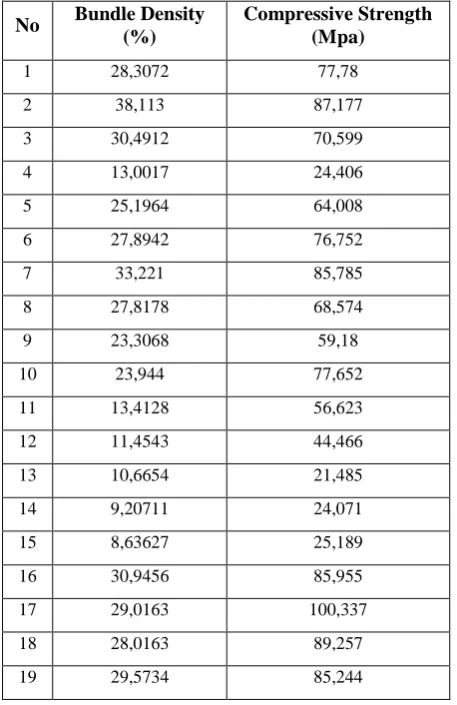
Image Measurement result and Compressive Strength test result can be seen in Table.1.
Table 1. Bundle Density and Compressive Strength Value
No Bundle Density
(%)
Compressive Strength (Mpa)
1 28,3072 77,78
2 38,113 87,177
3 30,4912 70,599
4 13,0017 24,406
5 25,1964 64,008
6 27,8942 76,752
7 33,221 85,785
8 27,8178 68,574
9 23,3068 59,18
10 23,944 77,652
11 13,4128 56,623
12 11,4543 44,466
13 10,6654 21,485
14 9,20711 24,071
15 8,63627 25,189
16 30,9456 85,955
17 29,0163 100,337
18 28,0163 89,257
19 29,5734 85,244
20 28,9755 69,509
21 1,09164 15,935
22 29,3329 69,087
23 30,6879 82,85
24 32,5007 79,495
25 30,7184 75,492
26 19,3238 39,219
27 16,5971 39,024
28 15,1919 30,6
29 11,8284 32,962
30 14,5775 34,149
4.2
Clustering Data Using Fuzzy C-Mean
By using 30 pairs data in Table.1 clustering process is done with Matlab code below
X=xlsread('F:\Kerapatan_Tekan.xlsx','fcmdata','B2:C31');
>> option=[2 100 0.000001 false];
>> [C,U]=fcm(X,3,option);
>> maxU=max(U);
>> index=cell(3,1);
>> for i=1:3
index{i}=find(U(i,:)==maxU);
end
>> figure
>> hold on
>> for i=1:3
[image:5.595.52.281.404.757.2]plot(C(i,1),C(i,2),'xk','MarkerSize',15,'Linewidth',3)
end
>> hold off
>> U
U =
Columns 1 through 7
0.3631 0.1004 0.8973 0.0127 0.9554 0.4802 0.0165
0.6225 0.8869 0.0931 0.0066 0.0331 0.5039 0.9819
0.0144 0.0126 0.0096 0.9807 0.0115 0.0159 0.0017
Columns 8 through 14
0.9929 0.8322 0.4823 0.5951 0.2070 0.0260 0.0159
0.0061 0.0976 0.4970 0.1616 0.0793 0.0140 0.0084
0.0010 0.0702 0.0207 0.2433 0.7137 0.9600 0.9757
Columns 15 through 21
0.0132 0.0021 0.1743 0.0511 0.0051 0.9651 0.0783
0.0069 0.9977 0.7907 0.9427 0.9944 0.0309 0.0462
0.9799 0.0002 0.0350 0.0062 0.0005 0.0040 0.8755
Columns 22 through 28
0.9649 0.0206 0.1656 0.5416 0.1397 0.1045 0.0080
0.0308 0.9779 0.8247 0.4419 0.0543 0.0417 0.0038
0.0043 0.0016 0.0096 0.0165 0.8061 0.8537 0.9882
Columns 29 through 30
0.0085 0.0222
0.0039 0.0099
0.9876 0.9679
>> C
C =
26.7871 67.7473
30.8344 85.1067
11.8798 29.4591
Fig.8 Clustering Data Result
5.
CONCLUSION
By using the Fuzzy C-Mean method in the two-measurement data then forming 3 centers of coconut wood quality cluster, from the results of this clustering it is concluded that coconut wood with high bundle density also has a high compressive quality value, bundle density above 30.83% is classified as superior type coconut wood. Meanwhile, bundle density of less than 11.88% is classified as low-quality coconut wood, besides that it is a medium type.
Visually the quality of coconut wood, especially the quality of the load-bearing strength (compressive quality) can be identified by measuring the density of the bundle in a digital image of a coconut wood cut
6.
REFERENCES
[1] Rangkang, J., Sondakh, F., and Saerang, E. J. 2016 “Karakteristik kayu kelapa di berbagai zona di indonesia timur berdasarkan sifat fisis dan mekanisnya,” Jurnal Teknik Sipil vol. 23 no. 2.
[2] Paulus, E. and Nataliani, Y. 2007 Capat Mahir GUI MatLab. ANDI. Yogyakarta.
[3] Badan Standarisasi Nasional,”Metode Pengujian Kuat Tekan Kayu di Laboratorium,” SNI 03-3958-1995, ICS 79.040. 1995.
[4] Presetyo, E. 2011. Pengolahan citra digital dan aplikasinya menggunakan MATLAB. 1st ed, Andi Offset. Yogyakarta.
[5] Purnomo, M. H., and Muntasa, A. 2010 Konsep pengolahan citra digital dan ekstraksi fitur, 1st ed, Graha
Ilmu. Yogyakarta.
[6] Kusumadewi, S., and Hartati, S. 2006. Neuro Fuzzy Integrasi Sistem Fuzzy dan Jaringan Syaraf, 1st ed, Graha Ilmu. Yogyakarta.