Eiszeitalter u. Gegenwart 35 8 9 — 1 0 8
Hannover 1985 Eiszeitalter u. Gegenwart
1 4 flg., 2 tab.
Fluctuation in Sea-Level and Associated Morphological Response: Examples from Denmark
CHRISTIAN CHRISTIANSEN, JENS TYGE MILLER & JORGEN NIELSEN*)
Sea level fluctuation, hydrogtaphs, coastal morphology, coastal changes, age (90 years), tesedimentation täte, C 1 4 dating, continued uplift.
Denmatk, North Sea, Baltic Sea
A b s t t a c t : Data from tide gauges in Denmatk show divetging trends in mean sea
level during the past 9 0 years. Stations in the notthern parts of the country have a falling trend ( — 0 . 3 9 mm/y in Hirtshals) while stations in the southern part of the countty have a rising trend ( + 1.08 mm/y in Fredericia). This regional disparity can be paitly explained by isostatic uplift of the northern pan of the country. There is also a marked seasonal fluctuation in mean sea-level with low levels in the spting and high levels in the autumn. Examples of the effect of these fluctuations on the coastal morphology are discussed. In one area of continued uplift the discus
sion is expanded to include postglacial coastal changes.
[Meeresspiegel-Schwankungen und damit verknüpfte morphologische Auswirkungen:
Beispiele aus Dänemark]
K u r z f a s s u n g : Daten von Pegelbeobachtungen in Dänemaik zeigen zwei ver
schiedenartige Tendenzen des jähilichen Mittelwasselstandes im Vetlauf det letzten 9 0 Jahre.
Stationen im nördlichen Teil des Landes zeigen eine fallende Tendenz ( — 0 . 3 9 mm pro Jahr in Hirtshals), während Stationen im südlichen Teil eine steigende Tendenz ( + 1.08 mm pro Jahr in Fiedeficia) zeigen. Dieser regionale Untetschied kann zum Teil durch isostatische Landhebung erklärt werden. Es gibt auch eine ausgeprägte saisonale Änderung im Wasserstand: niedriger Wasserstand im Frühjahr und hoher Wasserstand im Herbst. Beispiele von küstengeologischen Konsequenzen dieser Wasserstandvaiiationen werden besprochen. Die Diskussion befaßt sich auch mit post-glazialen Küstenveränderungen in einem Gebiet, in dem die isostatische Hebung auch noch heute andauert.
Introduction
In recent years attention has been drawn to the world-wide problem of shoreline
erosion (TANNER & STAPOR 1 9 7 2 ; WALTON 1 9 7 8 and PILKEY 1 9 8 1 ) , suggesting that
*) Addtesses of the authors: CH. CHRISTIANSEN, lektor, lie. scient. Geologisk Institut,
Aarhus Universitet. DK — 8000 Ärhus C . — Prof. Dr. J. T. MILLER, Geologisk Institut, Aarhus
Universitet. DK — 8000 Ärhus C . — J . NIELSEN, lektot, cand. scient. Geografisk Institut (7Jster
Voldgade 10, 1350 K^benhavn K.
90 Christian Christiansen, Jens Tyge Miller & J0rgen Nielsen
coastal erosion is largely due to a slow eustatic rise in sea-level. EMERY ( 1 9 8 0 ) , GORWITZ et al. ( 1 9 8 2 ) and BARNETT ( 1 9 8 4 ) propose that sea-level has risen by 1 . 2 — 1 . 4 m m / y in the last 1 0 0 years and 2 . 3 — 3 . 0 m m / y in the last 4 0 years. Exceptions from these general trends are found in Alaska, Scandinavia and South East Asia (BARNETT 1 9 8 4 ) .
BRUUN ( 1 9 6 2 ) suggested that sea-level rise could be responsible for the widespread shoreline erosion. Sea-level changes create disequilibrium, resulting in the seaward movement of eroded beach material. Coastal changes can also be caused by seasonal variations in t h e wave-climate (ELIOT & CLARKE 1 9 8 2 ) , nearshore reorganisation of bed- forms (NIELSEN & NIELSEN 1 9 7 8 ) , changes in sedimentbudget (BIRD & CHRISTIANSEN 1 9 8 2 ) as well as various anthropogenic factors (WALTON 1 9 7 9 , CARTER et al. 1 9 8 3 ) .
This paper will deal with sea-level variations in Denmark from 1 8 9 0 to 1 9 8 4 a n d give some examples on the associated morphological responses. In one area of conti
nuing isostatic uplift t h e discussion is expanded to include post glacial coastal changes.
Long-term trends
Mean sea-level
Long term tide gauge data are available for 1 0 Danish sites covering the period from 1 8 9 0 to 1 9 8 4 . These raw data have been analysed for t h e period up to 1 9 6 8 (THOMSEN & HANSEN 1 9 7 6 ) without regard to oceanographical and meteorological effects
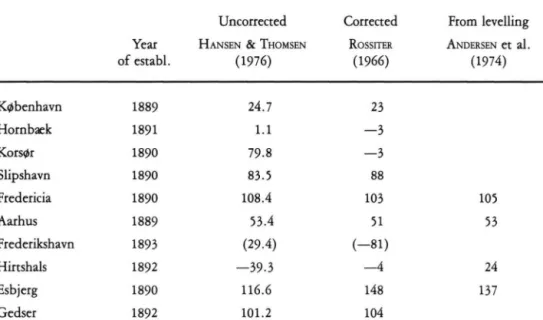
Tab. 1: Long term sea-level variation (mm/100 y) at 10 Danish stations. Sea-level rise is positive.
ROSSITER'S data ate corrected for oceanographical and meteorological effects.
The tide gauge at Ftedetikshavn stands on unsteady gtound.
Uncotrected Cottected Ftom levelling Year HANSEN & THOMSEN ROSSITER ANDERSEN et al.
ofestabl. (1976) (1966) (1974)
Ktfbenhavn 1889 24.7 23
Hotnbaek 1891 1.1 —3
Kors0r 1890 79.8 —3
Slipshavn 1890 83.5 88
Fredericia 1890 108.4 103 105
Aarhus 1889 53.4 51 53
Frederikshavn 1893 (29.4) ( - 8 1 )
Hittshals 1892 - 3 9 . 3 —4 24
Esbjerg 1890 116.6 148 137
Gedset 1892 101.2 104
Fluctuation in Sea-Level and Associated Motphological Response 91 (Table 1 ) . ROSSITER ( 1 9 6 7 ) analysed t h e same data for the period u p to 1 9 6 2 , taking oceanographical and meteorological effects into consideration (Table 1 ) . ANDERSEN et al.
( 1 9 7 4 ) gave an account of secular land movements in Jylland based on repeated level- lings about 1 8 9 0 and about 1 9 5 0 . T h e corresponding secular changes in mean sea-level are also shown in Table 1. This shows that there is a regional tendency in secular sea
level movements. T h e rise is largest in the southern parts of the country (Fredericia 1 . 0 8 m m / y ; Gedser 1 . 0 1 m m / y ) . This rise in sea-level decreases in a northerly direction to be superseeded by a fall in the northernmost parts (Hirtshals — 0 . 3 9 m m / y ) . A com
parison of the three sets of data in Table 1 suggests that meteorological corrections, as applied by ROSSITER ( 1 9 6 7 ) , are of greatest significance at Esbjerg and Hinshals, which are situated by the open sea. Stations in the inner Danish waters are more comparable without regard to corrections. These secular changes in mean sea-level give Denmark an intermediate position between N o r t h Germany, where sea-level is rising by approx.
2 . 5 m m / y (ROHDE 1 9 7 7 ) and Central Sweden, where sea-level is falling by 2 — 4 m m / y (ROSSITER 1 9 6 7 ; ÄSE 1 9 8 0 ) .
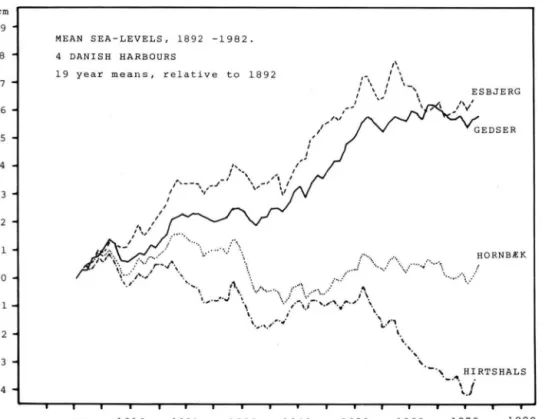
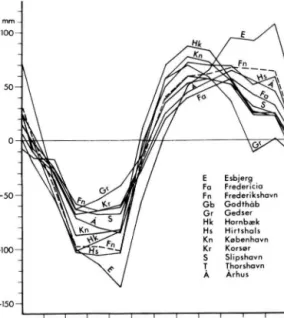
In order to eliminate the influence of the long term tidal Saros cycle the changes in sea-level at foui Danish stations have been plotted as 1 9 year running means (Fig. 1 ) . Each plot starts at 0 in the year the station was established. Besides the regional trends, Fig. 1 also shows general tendencies. Peaks, for example, are synchronous on all curves.
Fig. 1: Changes in mean sea-level since 1892 aftei the application of 19-year
running mean to the raw data.
92 Christian Christiansen, Jens Tyge M0ller & Jorgen Nielsen
Furthermore it is possible to see the difference in trend between the stations o n the north sea coast and stations in the inner Danish waters. In recent years both Hirtshals and Esbjerg have h a d falling trends. The latter is a reversal of the previous tendency.
During the same period both Hornbaek and Gedser have remained constant.
Morphological response
According to BRUUN'S rule (BRUUN 1962; SCHWARTZ & FISHER 1980) o n e should
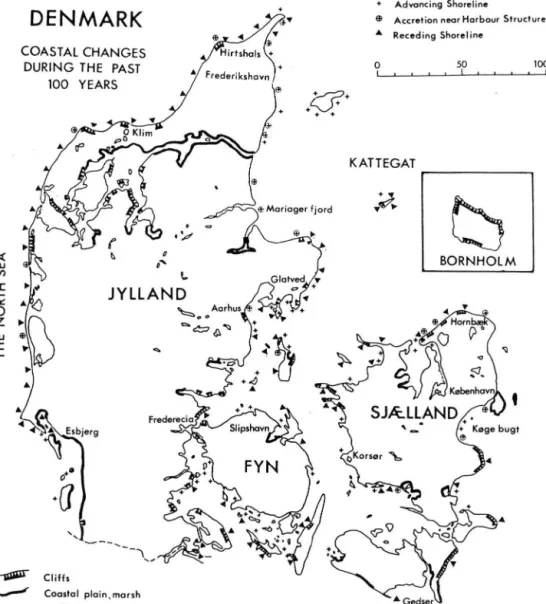
expect accentuated erosion in the south and diminished erosion or even accretion in the northern parts of Denmark. But it is n o t as simple as this. Fig. 2 shows that coastal
km
Fig. 2: Location map showing coastal changes in Denmark during the past 100 years.
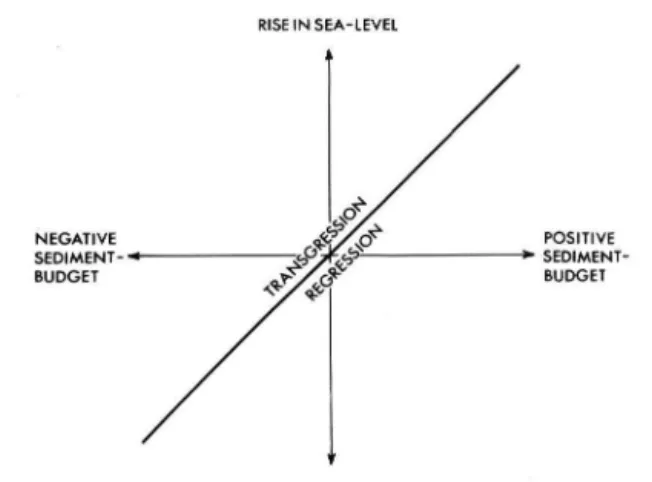
Fluctuation in Sea-Level and Associated Morphological Response 93 recession has exceeded progradation for t h e past 100 years (some 450 km of the coast is eroded and some 250 km is prograded). An assumption for BRUUN'S rule is that 1) the coast has a fully developed equilibrium profile and 2) there is plenty of loose sediment both on the beach and near-shore. These assumptions are normally fullfilled on coasts with small to moderate gradients, but very seldom on steep coasts. O n the other h a n d , there is a clear difference between coasts facing west and coasts facing east. On the west coasts westerly winds give high sea-level and high waves with resulting erosion. On the east coasts easterly winds give low sea-levels (CHRISTIANSEN 1973) and high waves with resulting lesser erosion. Fig. 3 shows t h e influence of changes in both water level and sediment budget on coastal morphology. It is possible to have regression even with rising sea-levels if t h e sediment budget can more than compensate. T h u s , the barrier coast in the bay between Blävand and Sylt in t h e southwestern p a n of Jylland, where sea-level is rising 1.17 m m / y , is prograding. This is due to long-shore sediment trans
port on the west coast of Jylland from t h e n o n h towards the south. Apperently, in most parts of the country the morphological responses to long term mean sea-level fluctua
tions are too small to be distinguished from the results of other coastal processes such as aperiodic storm activity.
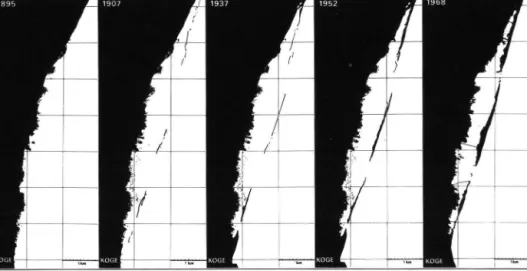
A n exception can be found in the micro-tidal, low-energy area of K$ge Bugt. The bay of Ktfge is located south of Copenhagen and is hydrographically p a n of the Baltic Sea, Fig. 4. The water depths in the bay are shallow (maximum 20 m ) and the fetches are short, except toward the SE. Mean sea-level is + 12 cm D N N ( D N N = Danish Ordnance Datum) and the tidal range in this part of the Baltic is less than 10 cm.
In the central bay, earlier maps show that a barrier was under formation at least as early as I860, but it is first in 1907 that it is shown as chain of islets on the topographical maps. Developments has since then been rapid and already the 1952 m a p shows a continuous barrier system, at least 7 km long and only broken by two tidal inlets, Fig. 4.
To-day the width of the barrier is a b o u t 85 m , and it consists of one or two tidges with maximum heights of 1.6—1.9 m D N N . The morphological border between the marine foreland and t h e beach, the permanent vegetation here mainly Elymus arenaria
RISE IN SEA-LEVEL
NEGATIVE SEDIMENT- BUDGET
POSITIVE SEDIMENT- BUDGET
FALL IN SEA-LEVEL
Fig. 3: The influence of changes in sea-level and sediment budget on coastal morphology.
94 Christian Christiansen, Jens Tyge M0ller & Jorgen Nielsen
Fig. 4: Development and landward movement of the bairiei in K0ge Bugt 1895—1968.
at a level of about 1.3 m D N N , corresponds to the average of the highest swashes. The upper part of the barrier is covered by small dunes built in the vegetation by wind
blown sand from the beach.
All levels of a young barrier coast are strongly adjusted to the local dynamics and their variation. Therefore it is interesting that the barrier in Ktfge Bugt has devel
oped during the last 100 years, a period with transgression (Gedser approx. 1 m m / y ) . The dominant coastal piocess has been the development of an equilibrium profile with steeper gradients, i. e. sediment ttansport toward land. This probably started during the last century with lower sea-levels. This process stopped temporarily due to a lack of mobile sediments in the off-shore zone. Longshore transport of sediments is insignifi
cant in the bay, therefore the total amount of sediment in the barrier and nearshore zone must be considered as constant. The necessary growth of the barrier height, to compensate for increasing water-levels implies a redistribution of the sediments. Map studies show that during development the barrier has moved landward toward a higher part of the profile. This form movement supplies the sediment necessary to build up the top levels of the barrier without changing its horizontal dimensions.
Morphodynamic studies on the barrier coastline (NIELSEN & NIELSEN 1978) describe the dynamic conditions and morphological results of the landward movement of the barrier. The morphodynamic processes on barrier coasts differ only from other kinds of coastlines during extreme situations, i . e . large waves and high water-levels.
During the night between 21 and 22/11 1971 the wind turned ESE (the direction
of the longest fetch) and increased to above 20 m/sec. At the same time the water-level
rose to 124 cm D N N . The deep water wave height was calculated as about 3.5 m .
Extensive parts of the barrier were overwashed due to the combination of wave and
water-level. The morphological results was a marked erosion of the beach (2.8 m ) and
the exposed part of the d u n e area (5 m ) , and many overwash tongues were deposited
behind the barrier ridge, Fig. 5. A study area was measured on 11th and 2 6 t h / 1 1 and
the volume above —1 m D N N was calculated by planimetry. The area stretched 30 m
Fluctuation in Sea-Level and Associated Morphological Response 95
JERSIE STRAND nov. 11th. 1971
nov 26th 1971 Exaggeration 12.5 x
Fig. 5: Cross-section measured on 11/11 and 26/11 1979, i. e. before and aftet the gale of 22/11.
The neatshote zone was apparently not influenced by the gale. Notice the large accumulation of sediment behind the outeimost ridge of the batrier.
landwards from the boundry between t h e beach and the matine foreland. Seawards it stretched 86 m to t h e through. The w i d t h along the beach was 48 m . The calculation showed, that the volume in the study area was increased by 86 m
3, 32 m
3of which was found behind the old borderline beach/marine foreland. The overall result was a reinforcement and landward movement of the barrier ridge. The ridge has not been overwashed since N o v e m b e r 1971.
At Klim, in the northwestern part of Jylland, coastal changes have been recorded since 1968 by detailed levellings on 18 profiles with a mutual distance of 50 m (CHRI
STIANSEN & M0LLER 1980). Fig. 6 shows t h e yearly coastal recession of the + 2.5 m D N N line together with yearly mean sea-level from Esbjerg (sea-level data from Esbjerg are more complete in these years than t h e corresponding data from t h e more closely situated Hirtshals). Fig. 6 shows that there is a clear connection between mean sea-level and mean coastal recession: a departure of 1 cm of t h e sea-level from t h e secular tiend corresponds to a recession of 5 m of t h e + 2.5 m level.
I i J
1 s
68 1 69 1 70 I 71 I 72 ' 73 I 74 i 75 < 76 1 77 ' 78 ' 79 '
Fig. 6: Yearly mean shoreline movements at Klim compated
with yearly mean sea-level at Esbjerg, 1968—1984.
96 Christian Christiansen, Jens Tyge M0ller & Jorgen Nielsen Seasonal fluctuations
Sea-level
Fig. 7 shows t h e mean seasonal fluctuations of the ten Danish stations. Sea-level is low in the spring and high in the a u t u m n . All stations have low mean level in March, April or May. Stations on the islands have t h e highest level in August while stations on t h e east coast of Jylland have a maximum in October. At Esbjerg the highest level is reached in November-December. DIETRICH (1954) showed that the seasonal fluctuation at Esbjerg could be explained by meteorological and oceanographical effects. W i n d effects contributed about 6 6 % , water density about 2 5 % and atmospheric pressure about 1 0 % . Fig. 8 shows the seasonal fluctuations of 24 hour-maximum and -minimum water-levels 1978 from Mosede, K0ge Bugt. A p a n from the low level in the spring and high level in the autumn, one can also see, that the diurnal fluctuations in t h e summer are significantly smaller than in the winter.
-150-
— I — I 1 1 1 1 1 1 1 1 1 —
JAN FEB MAR APR MAY JUN JUL AUG SEP OCT NOV DEC
Fig. 7: Monthly mean seasonal fluctuations at ten Danish stations.
Data ftom THOMSEN & HANSEN (1970).
Morphological responses
An artificial coast has recently been constructed in t h e northern part of Ktfge Bugt.
Morphodynamic changes in a field area measuring 20 m (along the beach) by 104 m
were measured from May 1978 to January 1980, only interrupted from January to April
1979 because of sea ice. Seasonal changes on the beach (0—30 m) and in t h e nearshore
zone (30—70 m ) were recorded (Fig. 9). Apart from t h e rapid profile and shoreline
adjustments of the young artificial coast in 1978, it is obvious that the morphological
Fluctuation in Sea-Level and Associated Motphological Response 97
Fig. 8: 24 hour max-min. sea-level 1978 at Mosede, K$ge Bugt.
development during t h e late spring and summer months is very moderate, due to the low sea-levels and calm weather (Fig. 8). However, there is a tendency to erosion (decreasing volume) of t h e foreshore a n d a corresponding accretion in the nearshore.
In t h e autumn, with prevailing higher sea-levels and a more violent wave climate, the volumetric changes are mote distinct. O n the foreshore oblique wave directions cause exchange of sediment with adjacent areas, even under situations where the waves are unable to affect t h e nearshore zone. However, sediment loss occurs in both areas during extreme situations such as in November 1 9 7 9 - Incidentally, during this storm the breakpoint bat was transfered 20 m seaward and thus out of the study area. The volumetric changes between December 1978 and May 1 9 7 9 occurred almost entirely during t h e last days of 1978. A south-easterly storm with temperatures of —15° C was followed immediately by the fteezing of the bay. Consequently, there were no con
structive processes after t h e storm. First during the constructive phase after the storm in November 1979 was there sufficiently wave activity to rebuild the beach and nearshore zone. W h e n the study was ended on January 10, 1980, the total volume of the study area was unchanged. T h e loss in the 0—30 m area was equal to the accretion in the 70—104 m area. Before making any conclusions on coastline stability it is thus necessaty to make observations over a long period of time to avoid misinterpretating changes which are either seasonal or aperiodic.
CHRISTIANSEN & MILLER (1983) suggested that the seasonal fluctuations in mean sea
level provided good conditions for the establishment of Spartina in Manager Fjord.
Since mean sea-level is low in the spring, in March the micro-tidal flats can have up to 9
days in succession without immersion. T h e low levels are important, partly because
germination is inhibited by salt (HUBBARD 1970) and partly because two or thtee days
without immersion allows the roots to become anchored in the sand.
98 Christian Chtistiansen, Jens Tyge Malier & Jtftgen Nielsen
Fig. 9: Volume variations down to —2 m DNN on the beach (0—30 m) and neatshote (30—70 m), May 1978 to January 1980.
The measutements wete interrupted from late December 1978 to late April 1979 because of sea-ice. The study area is 20 m wide.
Apart from creating new islands, the planting and spread of Spartina resulted, from 1969 to 1978, in 10 cm sedimentation with a fining-upward sequence (CHRISTIAN
SEN & MILLER 1983). Further, with the changed wave and current conditions caused by Spartina, sediment parameters on the flat have changed. The effect of Spartina diminished with distance. We thus include the changed sedimentation condition under the indirect influence of seasonal fluctuations in mean sea-level.
A p e r i o d i c variations Sea-level
Fig. 10 shows storm water-level variations in Knebel Vig on t h e east-coast of Jylland. For comparison the predicted tidal vatiations are also shown. It can be seen that
meteorological effects by far surpass tidal variations. O n the east-coast of Jylland meteo
rological induced variations range from + 1.40 m D N N to —1.20 m D N N . T h e
connection between meteorological data and water-level is not immediately clear at first
Fluctuation in Sea-Level and Associated Motphological Response 99 sight. Since the sea acts as a 'teversed barometer' a 1 m b pressurefall should cause a
1 cm rise in sea-level. This effect lies h i d d e n in the effects of the wind. W i n d data compared with water-levels shows, that it is regional and not local winds which deter
mine sea-level variations. Further, although the coast faces east, easterly regional winds give low sea level, since they press water out of the Kattegat. Conversely, westerly winds cause inflow and high sea-levels.
The storm surge on t h e SW coast of Jylland culminated at 14.00 hours on 3
r dJanuary ( + 4.91 m D N N ) . It culminated at Mariager Fjord at 22.00 hours and at Aarhus the next day at 03.00 hours. Thus the surge travelled down the east-coast of Jylland as a progressive wave with a b o u t the same celerity as the tide (CHRISTIANSEN 1976). Note that on the east coast high onshore wind-velocities prevail when the sea-level is low and the lower offshore wind-velocities prevail when t h e sea-level is high. Thus, in contrast to the great morphological changes (and flooding) on the west-coast the net effects on the east-coast were small. O n t h e east-coast t h e highest sea-levels of morphological im
portance occur during wandering cyclones, when the wind veers E following a long
period of westerly winds. Fig. 10 also shows seiches in the Kattegat with a period
of 4 hours during the 4
t hof January.
100 Christian Christiansen, Jens Tyge M0ller & Jorgen Nielsen Morphological responses
BIRD & CHRISTIANSEN ( 1 9 8 2 ) shoved that quarry waste d u m p e d on the shore at Glatved in Jylland has been reworked by wave action and formed into a beach ridge- plain. From 1 8 7 7 to 1 9 7 6 the coastline extending 5 . 5 km n o n h and 4 km south from t h e dumping area has prograded u p to 2 2 0 m . Fig. 1 1 shows a cross-section through t h e beach ridge-plain with positions of former shorelines. T h e crests of recent beach ridges were used by MERTZ ( 1 9 2 4 ) as indicators fot highest marine activity to compile t h e isobase map for post-glacial uplift in Denmark. Fig. 1 1 shows that, because of aperiodic sea-level changes and waves, this reference level have probably varied u p to 1 m during t h e last 1 0 0 years.
Consequently, it is of importance to know which year a given Tapes/Littorina deposit was related to present sea-level. It is also of importance to remember t h e influence of slope on wave-swash. A change in slope, for example from 2 ° to 5 ° , increases the swash for the same waves from 0 . 5 m to 1.6 m . Further, two wave trains of equal height but with different deep water periods have quite different swashes and thus give different levels of tefeience for highest marine activity.
NIELSEN & NIELSEN ( 1 9 7 8 ) in their study of a barrier coastline distinguish between t h e morphological changes due to waves from those due to sea-level variations (Fig. 1 2 ) . From September 2 5
T Hto 2 6
T Hthe sea-level increased but there were offshore winds (swell situation). As expected, this produced a weak constructive adjustment of the profile.
During the night of 2 7 / 9 the wind veered from N to E and at the same time t h e wind speed increased markedly. At 1 0 . 0 0 houts a destructive profile development was recorded. Between 1 0 . 0 0 and 1 3 . 0 0 this development continues because of increasing wind speed and raised sea-levels, but changes were mainly internal, with very little net change in the area as a whole. At 1 7 . 0 0 the adjustment of the profile was complete, as both wind speed and sea-level remained constant. Until 1 9 - 0 0 the sea-level fell slowly and evenly and wind speed decreased. A constructive profile development has started.
This continues during the night until 1 0 . 0 0 on 2 8 / 9 . Between 1 0 . 0 0 and 1 4 . 0 0 t h e
0 30 ,0 60 80 100 120 1,0 16C 180 300 MO 140 DISTANCE (Ml F«OM COASTLINE