Mouse Gut Microbiome-Encoded -Glucuronidases Identified using MAPS, Metagenome Analysis by Protein Structure
By
Benjamin C. Creekmore
Senior Honors Thesis Chemistry
University of North Carolina at Chapel Hill
April 24, 2018
Approved:
________________________
Matthew Redinbo, Thesis Advisor
ABSTRACT
Gut microbial β-glucuronidase (GUS) enzymes play important roles in drug efficacy and
toxicity, intestinal carcinogenesis, and mammalian-microbial symbiosis. In 2017, a catalog of gut microbiome-encoded GUS enzymes was described for the Human Microbiome Project stool sample database, revealing 279 unique GUS proteins that were organized into six categories based on active site structural features. Mice are a critical model organism used to steady health and disease, thus we sought to provide an analogous catalog of mouse intestinal microbial GUS proteins – a mouse gut GUSome. Using metagenome analysis by protein structure (MAPS), we examined the ~2.5 million unique proteins from a comprehensive mouse gut metagenome created using several mouse strains, providers, housing locations, and diets. From these data we found 338 unique GUS proteins and characterized the proteins into six categories similar to the human GUSome. GUS enzymes were encoded by the major gut microbial phyla, including Firmicutes (67%), Bacteroidetes (24%), and nearly 9% for which taxonomy could not be
assigned. No differences in gut microbial gus gene composition were observed for mice based on location or housing provider. However, mouse of the Swiss-Webster strain exhibited a different phylogeny of gut microbes encoding gus genes and distinct fractions of GUS proteins based on active-site features compared to the seven other strains examined. Additionally, mouse in a low- fat diet maintained gut microbes that encoded 22 additional GUS proteins, not found in mice on a high-fat diet. Biochemical analysis of a low-fat unique GUS enzyme revealed its capability of processing both sulfate and non-sulfated heparin sulfate nonasaccharides containing terminal glucuronides. Our results show GUS in mice and humans differ at the individual protein level and that gus gene composition in the murine GI tract differ in mice on low fat vs. high fat diets.
These data provide a basis for understanding the gut microbial GUS enzymes present in laboratory mice commonly used as organisms to model mammalian health and disease.
KEYWORDS
Glycosyl hydrolase, metagenomics, metabolism, heparan sulfate, murine diet
INTRODUCTION
The gut microbiota play a critical role in gastrointestinal (GI) homeostasis and disease states and encode specific enzymes that directly influence human health [1, 2]. For example, gut
microbiome proteins involved in the processing of drugs like digoxin, 5-fluorouracil,
methotrexate and irinotecan have been identified and their influence in therapeutic outcomes have begun to be appreciated [3, 4, 5, 6, 7]. Similarly, endogenous and dietary compounds have also been connected to specific microbiome-encoded enzymes [8]. Thus, to link the biochemistry of microbiota enzymes with mammalian physiology, it is essential to update the 'one enzyme-one substrate' paradigm to the microbiome, characterizing key enzymes as well as identifying their primary substrates and products. Additionally, it is important to understand the structural and functional diversity of the microbial enzymes present in the mammalian gut.
One of the first sets of microbiome enzymes adopted into a symbiotic role in mammalian health was the -glucuronidase (GUS) proteins. They had been hypothesized to cause the dose-limiting adverse outcomes caused by the anticancer drug irinotecan as early as 1995 [9], and -
glucuronidase activity had been known to be in mammalian feces since the early 1970s [10, 11, 12, 13]. Their role in irinotecan toxicity was established in 2010 and also controlled using microbial GUS-specific inhibitors that alleviated intestinal damage and diarrhea [7]. This approach has also been expanded to prevent adverse intestinal outcomes with non-steroidal anti- inflammatory drugs [14]. Thus, microbial GUS enzymes helped establish that the gut
microbiome contains drug targets that can be selectively modulated using drug-like small molecules.
Given their role as drug targets, it was crucial to define the diversity of GUS enzymes in the gut microbiome. We recently presented the first atlas of GUS enzymes identified in the Human gut
microbiota [15]. The Human Microbiome Project (HMP) samples were collected from 139 healthy donors which gave rise to 4.8 million unique gene products, and using structure-guided features specific to GUS enzymes, we identified 279 distinct GUS proteins in this HMP data set – an HMP GUSome. Additionally, we categorized the HMP GUS proteins into six structural classes, and demonstrated that they sampled a diverse set of functions against distinct sizes of glucuronic acid-containing substrates [15].
The process we employed is defined here for the first time as Metagenome Analysis by Protein Structure (MAPS). Often, the analysis of microbial metagenome data stops at the assignment of KEGG classifications, which are broad definitions of what type of protein is encoded by a family of genes [16]. Such assignments, if performed correctly, would have grouped all 279 gus genes in the HMP together as the “same gene.” However, they are not the same, as demonstrated by the wide range of lengths with additional substrate-binding modules, active site features that sample diverse functions, and distinct subcellular localization of the proteins within the HMP GUSome [15]. Thus, MAPS, by using features of known structures such as active site architecture to probe large microbial metagenomic datasets, has the capability of diving further into the details present in microbial metagenome data to define families of enzymes at a level of granularity necessary to understand their specific functions, and thus the roles they might play in mammalian-microbial symbiosis. In addition, MAPS is both scalable and transferable, as it can be applied to other genes and proteins present in microbiome sequencing data.
Given the important role mice play as model systems for human physiology and disease, we sought to create an atlas of microbial GUS enzymes from the mouse gut microbiome data – a Mouse GUSome. Fortunately, a high-quality mouse gut whole-genome metagenome dataset was provided by Kristiansen, Madsen, Wang and colleagues in 2015 [17]. These data were collected
from eight mouse strains obtained from five providers, housed in six locations world-wide, and fed two distinct diets [17]. Using these data and MAPS, here we report the identification of 338 distinct GUS proteins from the 2.5 million unique proteins identified in the mouse gut
metagenome dataset. The structural and functional diversity of the Mouse GUSome is outlined and compared to the HMP GUSome [15]. Together, these results highlight the power of MAPS to identify and define the biochemical capacity present in the mammalian microbiome.
RESULTS
GUS Identification in Mouse Gut Metagenome
We used protein structure to identify GUS enzymes from the ~2.5 million non-redundant genes in the 2015 catalog of the mouse gut metagenome [17]. This metagenome was assembled from mice housed at six distinct sites comprised of eight mouse strains from five sources, and fed two diets (normal and high fat) [17]. The MAPS method employed was similar to one used
previously by our group to identify the GUS proteins in the Human Microbiome Project (HMP) stool samples [15]. Briefly, the sequences of GUS enzymes of known structure (E. coli, C.
perfringens, S. agalactiae, B. fragilis; 3K46, 4JKM, 4JKL and 3CMG, respectively) were used to
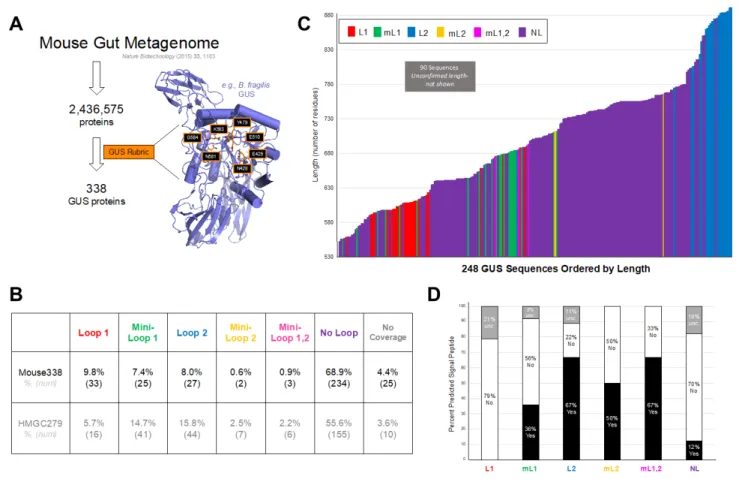
identify mouse gut metagenome proteins with >25% sequence identify and E values below 0.05 (Figure 1A). This step selected 237,435 proteins from the 2,572,074 proteins in the mouse gut metagenome. We then selected only proteins that maintained the active-site residues shown previously to be essential and specific to GUS proteins, including asparagine and lysine side chains (N581, K583 in Figure 1A) that coordinate the carboxylic acid moiety unique to
glucuronide acid relative to glucose and galactose, for example. This second step identified a set
of 338 unique proteins that compose a mouse intestinal “GUSome” that will be the subject of our subsequent analysis. Interestingly, 338 GUS proteins is a value similar in magnitude to the 279 identified previously from the HMP.
Mouse GUSome Structural Categories and Subcellular Localization
We categorized the microbial GUS proteins identified in the mouse gut into six separate loop classes given their active site architecture using multiple sequence alignments. We have previously shown that two loop regions at the microbial GUS active site change the substrate- utilization characteristics of GUS enzymes and provide a useful manner in which to group enzymes by structural features [15]. In the HMP study, we termed GUS proteins Loop 1, Loop 2, or No Loop, depending on the presence or absence of sequence inserts at positions 356 and 416 of E. coli GUS in the conserved GUS glycosyl hydrolase 2 (GH2) fold [15]. Three additional categories were specified for Mini-Loop 1, Mini-Loop 2, and Mini-Loop 1, 2 enzymes with shorter inserts at these positions [15]. A small number of proteins from this metagenomic analysis lacked sequence coverage in these regions, thus were termed “no coverage” [15].
The mouse gut GUSome also populates these categories but exhibits some distinctions relative to the HMP (Figure 1B). Like the “HMP279”, the 279 unique GUS proteins identified in the Human Microbiome Project stool sample data set, the “Mouse338” finds the vast majority of its GUS proteins in the No Loop category. However, the Mouse338 exhibits a higher percentage, nearly 69%, in the No Loop category compared to ~ 56% in HMP279. The Mouse338 also exhibits more proteins in the Loop 1 category (10%) compared to human (6%), but fewer than the human set in all other loop structure categories (Figure 1B). Thus, the mouse gut GUSome samples the complete set of structural categories but contains more No Loop and Loop 1 proteins than the human gut GUSome at the expense of the other categories.
Of the 338 unique GUS proteins identified here, 89 had uncertain starting methionines, and were thus termed “unclear” with respect to length analysis. The 249 proteins of confirmed length from the Mouse338 range from 552 to 891 residues, with loop types largely clustered together (Figure 1C). For example, 21 of the 26 Loop 1 proteins of confirmed length are between 591 and 623 residues in length, with five proteins located outside that range. Similar trends are observed for the Loop 2 proteins, which are the largest and are nearly universally greater than 800 amino acids in length (Figure 1C). We also examined each protein for a potential signal peptide, which would be indicative of potential trafficking of the protein outside the microbial cell. A fraction of the proteins in each loop category were labeled “uncertain” because of missing or miscalled methionines or a cysteine present immediately following the predicted peptidase I site. For the proteins assigned with confidence, we found that no Loop 1 GUS proteins contained signal sequences, while approximately 12-67% of the other categories had signal sequences (Figure 1D). Thus, we conclude that a significant fraction of the GUS proteins in the mouse gut microbiome can be exported extracellularly, while the Loop 1 proteins appear to remain intracellular. Similar trends were observed for the human GUSome HMP279 dataset [15].
Mouse and Human GUSome are Distinct but Share Similar Clustered Character
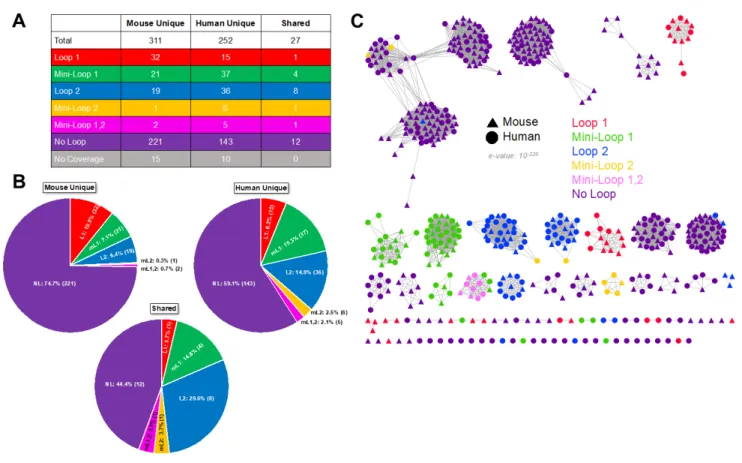
Only 27 of the GUS proteins identified in the human and mouse gut GUSomes are identical as defined by protein sequences that share >98% identity at the amino acid level (Figure 2A). As such, there are 590 different proteins in these datasets, and these distinct sequences are observed for each of the structural categories of the GUSome (Loop 1, etc.; Figure 2A). Similar
observations were noted when the overall gut metagenomes of mice and humans were compared and were found to contain only 102,830 identical genes out of 4.1 million in human feces
(0.02%) and 2.5 million in mouse fecal material (0.04%) [17]. As expected, categories over-
represented in the Mouse338, as compared to HMGC279, contain more GUS proteins of unique sequence for Mouse338, such as the 32 and 221 Loop 1 and No Loop proteins, respectively, unique to the mouse GUSome. By contrast, other categories contain less GUS proteins of distinct sequence, such as the 21 and 19 Mini-Loop 1 and Loop 2 proteins, respectively, unique to the mouse GUSome (Figures 2A, B). However, despite these differences at the amino acid level, clustering by sequence similarity networks reveal that the mouse and human GUSome create highly intertwined “galaxies” of GUS proteins (Figure 2C). The mouse and human proteins cluster together into groups containing proteins from both GUSomes, with only a small number of multi-GUS clades containing only mouse proteins (Figure 2C). Similarly, in spite of their stark differences in gene composition, it was shown previously that 88% of KEGG pathways are shared between the human and mouse gut metagenomes [17]. Thus, it would appear that, despite the differences in the GUS proteins in the mouse and human gut at the amino acid sequence level, the GUSomes of each mammal may converge on a shared overall functional capacity.
Mouse GUSome Phylogeny
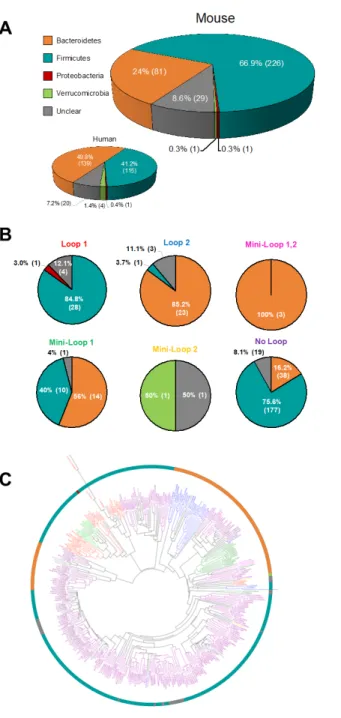
The taxonomy of each protein in the Mouse338 was assigned, to the degree possible, via BLASTP [18] (Figure 3A; Additional File 2: Table S1). We found that nearly 91% (309
proteins) could be assigned a phylum, while ~9% (29 proteins) had unclear phylogeny (defined as either no significant similarity, or a high level of similarity to more than one microbial
phylum). Two-thirds of the GUS proteins in the mouse GUSome arose from Firmicutes bacteria, 25% from Bacteroidetes, and a single protein from each of the Verrucomicrobia and
Proteobacteria phyla (Figure 2A). By contrast, the human GUSome HMP279 exhibited 50%
Bacteroidetes and only 40% Firmicutes (Figure 2A). This observation stands in contrast to the overall similarity in taxa in the mouse and human gut metagenomes [17] and, as outlined below,
may reflect differences in diet between captive mice and humans free to make dietary choices.
The preponderance of Firmicutes in the mouse GUSome is largely reflected in the No Loop enzymes, of which 75% are from this phylum (Figure 3B), whereas only 50% of No Loop proteins were from Firmicutes in the HMP279. A phylogenetic tree combining GUS loop categories and taxonomy reveals that loop types cluster together in clades in a manner that reflects their phylogeny (Figure 3C). A similar arrangement of grouped GUS loop categories and taxonomy (e.g., Firmicutes Loop 2 proteins) was observed in the human GUSome as well.
Strain and Diet Impact Mouse GUSome
We next examined the GUS structural loop categories (e.g., Loop 1, Loop 2, No Loop, etc.) and phylogeny differences that might exist between the distinct variables captured in the mouse gut metagenome dataset. The variables present in creating this metagenome dataset were mouse strain, housing location, provider, and diet. We found no differences in either GUS feature (loop category distribution or phylogeny) associated with mouse provider or housing location.
However, we note differences in mouse GUSome loop category distribution and phylogeny for two variables: mouse strain and diet. Swiss Webster mice exhibited a distinct composition of gut microbial GUS enzymes for both loop category distribution and phylogeny (Figure 4). In
contrast to the other seven mouse strains examined, Swiss Webster mice had more No Loop (75% vs. 72.15 0.08% for the other seven strains) and Mini-Loop 1 (9.8% vs. 7.71 0.04%) GUS enzymes, and had fewer Loop 1 (8.5% vs. 10.2 0%) and Loop 2 (5.5% vs. 8.34 0.05%) within their gut metagenomes (Figure 4A). Similarly, Swiss Webster mice had more GUS enzymes associated with Firmicutes (75% vs. 67.96 0.09% for the other seven strains) and fewer associated with the Bacteroidetes (17.9% vs. 23.9 0.1%) within their gut than the other strains examined (Figure 4B). The Swiss Webster mice were provided by and housed at CMR
and received the same low-fat diet. However, C57/BL6 mice were provided by CMR and housed both at CMR and other locations; C57/BL6 mice did not exhibit GUS loop category and
phylogeny differences observed with Swiss Webster mice. Furthermore, neither provider nor housing location had a notable effect on these GUS factors alone. Thus, we conclude that Swiss Webster mice appear to support a distinct GUSome relative to other mouse strains. Future studies will be required to determine what feature(s) of Swiss Webster mice might account for these distinctions.
We also found 22 GUS sequences that were unique to the mice on a low-fat and standard chow diets but not present in the mice receiving a high-fat diet (Figure 5; Table 1). These different sequences were observed despite the fact that no overall differences in GUS loop category (Figure 5A) or the phylogeny of GUS-encoding gut microbes (Figure 5B) were present between the low- and high-fat diet groups. Furthermore, no GUS sequences were found to be unique in the Swiss Webster mice relative to other mice strains. Thus, it is possible that the GUS proteins uniquely observed in low-fat diet mice are reflective of the differences in gut metabolic activities present in these mice. To that point, we note that the Loop 2 GUS category is over-represented in the low fat-unique GUS proteins, as are GUS proteins arising from bacteria of unclear taxonomy (Figure 5C).
Structure and Function of a GUS Unique to Mice on a Low-Fat Diet
Finally, we selected a GUS unique to mice on a low-fat diet, identified the complete gene, overexpressed and purified the enzyme, and performed biochemical characterization. We chose a GUS (ID: G1-3A_GL0084291) that was initially a fragment of only 203 residues in length and classified as “No Coverage” because it lacked sequencing reads across the Loop 1 and 2 regions (Table 1). We found using BLASTP [18] that this fragment corresponded to an 864-residue full-
length protein from Bacteroides ovatus, and that it was a Loop 2 enzyme. Thus, this BoGUS L2 is the fifth Loop 2 GUS protein present in this set, which comprise nearly 23% of the GUS enzymes uniquely present in mice on a low-fat diet.
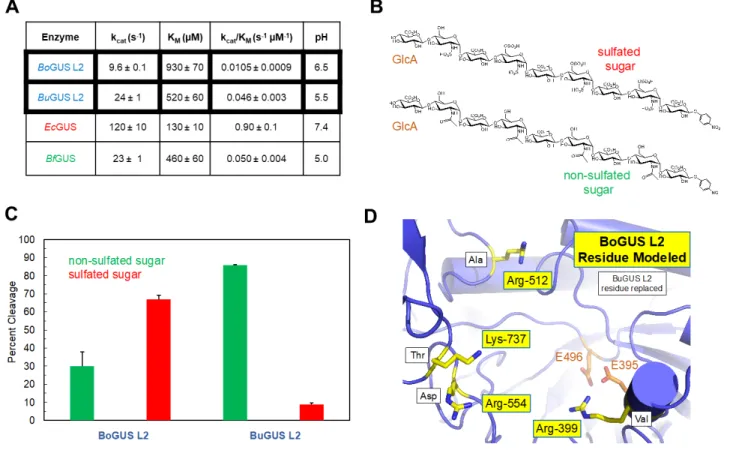
We synthesized the gene for BoGUS L2, overexpressed the protein in E. coli, and purified it using affinity- and sizing-column chromatography. Pure BoGUS L2 exhibits its highest activity at pH 6.5-7.0 when using the standard GUS assay reagent p-nitrophenyl-glucuronide (PNPG) as a substrate (Supplemental Figure 3). We then examined the kinetics of PNPG cleavage by BoGUS L2 at pH 6.5 (Figure 6A). BoGUS L2 exhibits a low kcat and a weak KM, resulting in a poor kcat/ KM, which indicates this enzyme does not efficiently process PNPG. By contrast, some Loop 1 enzymes, such as the E. coli Loop 1 protein, exhibit better activity with PNPG, while the B. fragilis Mini-Loop 1 enzyme shows poor activity, akin to BoGUS L2 (Figure 6A). These results highlight the range of catalytic properties within the GUS family of enzymes.
We also examined the ability of BoGUS L2 to process larger polysaccharide substrates. We had shown previously that Loop 1 GUS proteins do not process these substrates, while the more open active sites of other types of GUS, including mL1, L2, and mL2, are able to efficiently act on carbohydrates [15]. We chose two heparan sulfate nonasaccharides (9-mers) with terminal glucuronic acid moieties at the non-reducing ends, one with non-sulfated 9-mer, and one with sulfated 9-mer (Figure 6B). We found that BoGUS L2 and BuGUS L2 were functionally distinct using these two 9-mer substrates. BoGUS L2 was less active using the non-sulfated 9-mer than BuGUS L2 (30% cleavage vs. 90% cleavage, respectively; Figure 6C). By contrast, BoGUS L2 efficiently processed the sulfated polysaccharide while BuGUS L2 exhibited nearly no activity with this anionic substrate (70% cleavage vs. 8% cleavage, respectively; Figure 6C). By
modeling, BoGUS L2 contains four positively-charged residues, three arginine and one lysine, in
place of neutral or negatively-charged residues in BuGUS L2 (Figure 6D), likely explaining the ability of BoGUS’s active site to process the negatively-charged sulfated 9-mer substrate. These results demonstrate that, in spite of their general structural and functional similarities, individual GUS enzymes are unique with respect to structural and functional details, underlying the
importance of structure-guided efforts to identify and study specific proteins expression by the gut microbiota.
DISCUSSION
Given the relevance of the mouse as a model organism, we sought to understand the diversity of a family of mouse gut microbiome-encoded enzymes important to the mammalian response to cancer chemotherapy and other drugs. Building off our work on establishing a comprehensive atlas of gut microbial beta-glucuronidase (GUS) enzymes from the fecal samples in the Human Microbiome Project [15], we applied the same methods to the comprehensive mouse gut metagenome dataset established by Xiao and colleagues [17]. We term our work-flow Metagenome Analysis by Protein Structure (MAPS) to indicate that we employ both general structure features as well as detailed active-site residues specific to GUS enzymes (Figure 1A).
Similar to the 279 unique GUS proteins in the HMP (human GUSome), we found 338 unique GUS enzyme orthologs in the assembled mouse gut microbial metagenome data (mouse
GUSome; Figure 1B). In addition, akin to the human GUSome, the mouse GUSome samples the same six structure-function categories of enzymes, albeit at distinct relative levels. The mice examined contained more Loop 1 (L1) and No Loop (NL) enzymes and less of the other categories (mL1, L2, mL2, and mL1,2; Figure 1B). Extending this trend, we found that the potential intra- vs. extra-cellular localization was distinct between the human and mouse
GUSomes (Figure 1D). In the human GUSome, all L2, mL2 and mL1,2 enzymes contained a predicted signal sequence, indicating their potential for extracellular localization, likely to the periplasm [15]. In the mouse GUSome, 22-50% of the enzymes in these three categories lack these sequences, indicating that these enzymes function within the bacterial cells that express them (Figure 1D). The reasons behind these differences between human and mouse in these first GUSomes is not clear, but is likely caused by differences in diet between humans and captive mice, as discussed below.
Despite these differences, and the fact that only 27 GUS proteins sharing >98% sequence identity are found in both the mouse and human GUSomes (Figure 2A), sequence similarity networks (SSNs) indicate that the 338 mouse and 279 human GUS significantly overlap (Figure 2B). The mouse and human GUS proteins shuffle together into clades suggestive of shared structural and functional features. As such, the functional propensity of both GUSomes to process dietary, endogenous and xenobiotic glucuronides is likely similar at one functional level, indicated by the same general number of GUS proteins binned into similar categories and SSN clades, but distinct at another, indicated by differing relative fractions in the six active site categories and different potential sub-cellular localization. While these data give us an initial layer of granularity about microbial GUS proteins in mammalian systems, they just begin to inform us about the range of functional capabilities present in humans and mouse models.
Despite the multiple differences in the mice sampled for the gut metagenome data we analyzed, only two mouse features appeared to affect the composition of the GUS enzyme genes present in
their fecal microbiota. First, Swiss-Webster mice exhibited a distinct fractional composition of GUS proteins, with more mL1 and NL and less L2 and L2 than mice of the other strains examined (Figure 3A). Similarly, Swiss-Webster mice had a higher fraction of GUS enzymes encoded by Firmicutes taxa and less Bacteroidetes and unclear taxa (Figure 3B). While all the Swiss-Webster mice were housed in the same location [17], mice of other strains were also housed here and did not exhibit such differences. Indeed, housing location and source showed no differences in GUS loop categories or taxonomy. Xiao and colleagues noted no differences between Swiss-Webster mice and other strains in their whole gut metagenome analysis [17].
Therefore, we conclude that features unique to the genetic background of Swiss-Webster mice alter the types of microbial GUS protein genes present in their GI tracts. Future studies will be required to formalize a potential linkage.
The second difference observed in the mouse GUSome was related to diet. While the general GUS loop categories and taxa were similar between mice receiving a low- and high-fat diet (Figure 4), we found that the gut metagenomes from mice on a low-fat diet encoded 22 GUS proteins not found in the gut metagenomes from mice on a high-fat diet. Thus, it is tempting to conclude that mice on a low-fat diet maintain 6.5% (22/338) more GUS functional capacity than mice fed the high-fat diet. We also noted that L2 enzymes composed 22% of the unique low-fat GUS proteins observed, much higher than the L2 fractions typically observed (6-9%). For this reason, we chose to express and purify a L2 GUS that was initially categorized as “no coverage”.
Via BLAST [18], we found that this sequence corresponded to Bacteroides ovatus (BoGUS L2).
We further showed that it exhibited distinct functional characteristics on charged and uncharged polysaccharide substrates in in vitro assays when compared to an L2 enzyme from B. uniformis
(BuGUS L2) characterized previously. By structural modeling, we find that BoGUS L2 contains positively charged residues not present in the BuGUS L2 active site, likely explaining the BoGUS L2’s ability to process sulfated polysaccharides. These results indicate the functional specialization present in the gut microbial GUSome is driven by unique active site features that can be understood using crystal structures or structural models.
Finally, we sought to understand why mice on the low-fat diet might encode a unique set of GUS enzymes and ones that feature the L2 active site architecture. Normal, low-fat mouse chow is composed of roughly twice the amount of carbohydrates than high-fat chow, in which the carbohydrates are replaced with fats. Specifically, there is more sucrose, corn starch and
maltodextrin in low-fat chow than high-fat chow [19, 20, 21, 22, 23, 24]. Thus, we speculate that increased levels of these carbohydrates, particularly the polysaccharide corn starch, in the low-fat diet maintains or facilitates the growth of microbes that contain polysaccharide processing enzymes including Loop 2 and No Loop GUS enzymes. However, importantly, the dietary factors that are increased in the low-fat mouse chow do not themselves contain glucuronic acid.
Therefore, the presence of GUS enzymes unique to the intestinal microbiota of mice on low-fat diets may be a “passenger effect” in which the gus genes are not required to process these dietary substrates, but other gene products in the host bacterial organisms are. Alternatively, the low-fat diet may change other aspects of mammalian or microbial metabolism to increase glucuronide- containing substrates in the lumen of the GI tract. Future studies will be required to pinpoint the roles GUS enzymes play in processing dietary and non-dietary substrates. These results highlight the capabilities and limitations of utilizing metagenome analysis by protein structure (MAPS) in providing functional granularity to the metabolic capabilities present in the gut microbiome.
CONCLUSION
Because mice are commonly used to model human physiology and disease, it is essential to understand the functional details of how the murine gut microbiome compares to the human gut microbiome. Gut bacterial GUS enzymes are involved in responses to therapeutics and in processing a range of endobiotic glucuronides [7, 9, 25]. Our results highlight the protein-level differences of the 338 and 279 GUS enzymes, respectively, present in the GI tracts of mice and humans. While only 27 proteins are identical between the two sets, the full range of GUS proteins share a similar organization into six structural classes and significantly overlap on a sequence similarity network. We find that no differences in GUS levels or types are present in mice from different providers or housed in different locations, but we do see difference in Swiss- Webster mice and in animals on a high-fat diet.
METHODS
Mouse Whole Genome Metagenome Gut Data
Mouse protein dataset was obtained from [26] under ID: 68678 and metagenomic reads were downloaded from the European Nucleotide Archive (study ID PRJEB7759) as FASTQ files and used for subsequent analyses [17].
Mouse β-Glucuronidase Identification
The β-glucuronidase (GUS) proteins were identified by interrogating proteins first for sequences that shared >25% identity and E value >0.05 to four microbial GUS enzymes – from E. coli, B.
fragilis, C. perfringens and S. agalactiae. Protein sequences that passed those criteria were then
examined for GUS-specific active site residues: the NxKG motif, the catalytic E amino acids, and N and Y motifs, as described previously [15]. All data and information about HMP GUS sequences was taken from [15].
Mouse β-Glucuronidase Loop Classification
Mouse GUS proteins identified were subjected to a multiple sequence alignment (MSA) using Clustal Omega version 1.2.4 [27] along with selected model GUS sequences: B. uniformis (NCBI Accession: WP_035447612) and F. prausnitzii (NCBI Accession: WP_005931592). The MSA was examined for the B. uniformis Loop 2 region and the F. praustnitzii Loop 1 region.
GUS proteins were then categorized based on sequence differences in a highly variable loop region as described previously [15].
Taxonomic Assignments of GUS Sequences
The non-redundant protein sequences database (nr) was searched for sequences matching protein sequences from the Mouse338 dataset using NCBI BLASTP [18]. For sequences which had a top (ranked by score) BLASTp sequence of ≥95% identity, taxonomy of the query sequence was defined as the most specific taxonomy among the sequences of ≥95% identity. For all other sequences, the top 5 BLASTp results were analyzed for agreement in taxonomy at the most specific level, then assigned to that level if there was a consensus among all 5. If there was no consensus at any level, the protein was marked “unclear”. The radial cladogram in Figure 3C was generated in Geneious version 10.2.2 [28]. Data provided for the Mouse338 sequences are based on the NCBI Protein Database as of May 2017 [29].
Signal Peptide Identification
The 338 mouse sequences were analyzed for the presence of signal peptides using the online LipoP 1.0 server [30]. Of the 338 sequences, 89 were determined as “uncertain” in this N- terminal region because they had missing or miscalled starting methionines. Thus, only 249 proteins were confidently considered for both length and potential signal peptide presence.
PNPG Assay
Para-nitrophenyl glucuronide (PNPG) was purchased as a solid and dissolved in water at a concentration of 100 mM. Reactions were conducted in 96-well, black, clear-bottom assay plates (Costar) at 37° C. Reactions consisted of PNPG (various concentrations) and GUS enzyme (various concentrations) diluted in assay buffer (50 mM HEPES, 50 mM NaCl for pH ≥6.0 or 50 mM sodium acetate, 50 mM NaCl for pH < 6.0). To determine the optimal pH for BoGUS, BuGUS, and BfGUS, the above assay was conducted at 800 µM PNPG for BuGUS and BfGUS
and 1500 µM PNPG for BoGUS in the appropriate assay buffer where the pH ranged from 4.0 to 7.4. Reactions were quenched with 0.2 M sodium carbonate, and the product formation was measured over time via absorbance at 410 nm using a PHERAstar Plus microplate reader (BMG Labtech). Upon determining the optimal pH for each enzyme, velocities were determined for multiple substrate and enzyme concentrations at each enzyme’s optimal pH, and the Michaelis- Menten kinetics module in SigmaPlot 13 (Systat Software, Inc.) was used to calculate KM, kcat, and kcat/KM.
Oligosaccharide Assays
Sulfated and non-sulfated oligosaccharide assays were performed as previously outlined [15].
LIST OF ABBREVIATIONS
GUS: β-glucuronidase; GI: gastrointestinal; MAPS: metagenome analysis by protein structure;
HMP: Human Microbiome Project; GH2: glycosyl hydrolase 2; HMP279: the 279 unique β- glucuronidase proteins identified in the Human Microbiome Project stool sample data set;
Mouse338: the 338 unique β-glucuronidase proteins identified in the murine stool sample data set; GUSome: the collection of all possible β-glucuronidase proteins expressed in the healthy murine gut environment; BoGUS L2: Bacteroides ovatus Loop 2 GUS; BuGUS L2: Bacteroides uniformis Loop 2 GUS ; BfGUS: Bacteroides fragilis GUS; PNPG: p-nitrophenyl-glucuronide;
mL1: Mini-Loop 1 ; NL: No Loop; L1: Loop 1; L2: Loop 2; MSA: multiple sequence alignment
REFERENCES
1. Li J, Jia H, Cai X, Zhong H, Feng Q, Sunagawa S, et al. An integrated catalog of reference genes in the human gut microbiome. Nat Biotechnol. 2014;32:834-41.
2. Dejea CM, Fathi P, Craig JM, Boleij A, Taddese R, Geis AL, et al. Patients with familial adenomatous polyposis harbor colonic biofilms containing tumorigenic bacteria. Science.
2018;359(6375):592-7.
3. Dobkin JF, Saha JR, Butler VP, Neu, HC, Lindenbaum J. Inactivation of digoxin by Eubacterium lentum, an anaerobe of the human gut flora. Trans Assoc Am Physicians
1982;95:22-9.
4. Haiser HJ, Gootenberg, DB, Chatman K, Sirasani G, Balskus EP, Turnbaugh PJ. Predicting and manipulating cardiac drug inactivation by the human gut bacterium Eggerthella lenta. Science. 2013;341(6143):295-8.
5. Hidese R, Mihara H, Kurihara T, Esaki N. Escherichia coli dihydropyrimidine dehydrogenase is a novel NAD-dependent heterotetramer essential for the production of 5,6-
dihydrouracil. J Bacteriol. 2011;193(4):989-93.
6. Valerino DM, Johns DG, Zaharko, DS, Oliverio VT. Studies of the metabolism of
methotrexate by intestinal flora-I: identification and study of biological properties for the metabolite 4-amino-4-deoxy-N10-methylpteroic acid. Biochem. Pharmacol.
1972;21(6):821-31.
7. Wallace BD, Wang H, Lane KT, Scott JE, Orans J, Koo JS, et al. Alleviating cancer drug toxicity by inhibiting a bacterial enzyme. Science. 2010;330(6005):831-5.
8. Cotillard A, Kennedy SP, Kong LC, Prifti E, Pons N, Le Chatelier E, et al. Dietary intervention impact on gut microbial gene richness. Nature. 2013;500:585-8.
9. Yokoi T, Narita M, Nagai E, Hagiwara H, Aburada M, Kamataki T. Inhibition of UDP- glucuronosyltransferase by aglycons of natural glucuronides in kampo medicines using SN-38 as a substrate. Jpn J Cancer Res. 1995;86(10):985-9.
10. Reddy BS, Weisburger JH, Wynder EL. Fecal bacterial beta-glucuronidase: control by diet.
Science. 1974;183(4123):416-7.
11. Barrow A, Griffiths LA. Metabolism of the hydroxyethylrutosides. II. Excretion and metabolism of 3',4',7-tri-O-(beta-hydroxyethyl) rutoside and related compounds in laboratory animals after parenteral administration. Xenobiotica. 1974;4(1):1-16.
12. Kent TH, Fischer LJ, Marr R. Glucuronidase activity in intestinal contents of rat and man and relationship to bacterial flora. Proc Soc Exp Biol Med. 1972;140(2):590-4.
13. Takimoto M, Matsuda I. β-glucuronidase activity in the stool of the newborn infant. Biol Neonate. 1971;18(1):66-70.
14. LoGuidice A, Wallace BD, Bendel L, Redinbo MR, Boelsterli UA. Pharmacologic targeting of bacterial β-glucuronidase alleviates nonsteroidal anti-inflammatory drug-induced enteropathy in mice. J Pharmacol Exp Ther. 2012;341(2):447-54.
15. Pollet RM, D'Agostino EH, Walton WG, Xu Y, Little MS, Biernat KA, et al. An atlas of β- glucuronidases in the human intestinal microbiome. Structure. 2017;25(7):967-77.
16. Abubucker S, Segata N, Goll J, Schubert AM, Izard J, Cantarel BL, et al. Metabolic
reconstruction for metagenomic data and its application to the human microbiome. PLOS Comput Biol. 2012;8(6):e1002358.
17. Xiao L, Feng Q, Liang S, Sonne SB, Xia Z, Qiu X, et al. A catalog of the mouse gut metagenome. Nat Biotechnol. 2015;33:1103-8.
18. Altschul SF, Gish W, Miller W, Myers EW, Lipman DJ. Basic local alignment search tool. J Mol Biol. 1990;215(3):403-10.
19. Ding S, Chi MM, Scull BP, Rigby R, Schwerbrock NMJ, Magness S, et al. High-fat diet:
bacteria interactions promote intestinal inflammation which precedes and correlates with obesity and insulin resistance in mouse. PLoS One. 2010;5(8):e12191.
20. Julien C, Tremblay C, Phivilay A, Berthiaume L, Émond V, Julien P, et al. High-fat diet aggravates amyloid-beta and tau pathologies in the 3xTg-AD mouse model. Neurobiol Aging. 2010;31(9):1516-31.
21. Finger BC, Dinan TG, Cryan JF. High-fat diet selectively protects against the effects of chronic social stress in the mouse. Neuroscience. 2011;192:351-60.
22. Elgazar-Carmon V, Rudich A, Hadad N, Levy R. Neutrophils transiently infiltrate intra- abdominal fat early in the course of high-fat feeding. J Lipid Res. 2008;49:1894-903.
23. Barbier de La Serre C, Ellis CL, Lee J, Hartman AL, Rutledge JC, Raybould HE. Propensity to high-fat diet-induced obesity in rats is associated with changes in the gut microbiota and gut inflammation. Am J Physiol Gastrointest Liver Physiol. 2010;299(2):G440-8.
24. Kim KA, Gu W, Lee IA, Joh EH, Kim DH. High fat diet-induced gut microbiota exacerbates inflammation and obesity in mice via the TLR4 signaling pathway. PLoS One.
2012;7(10):e47713.
25. Pellock SJ, Redinbo MR. Glucuronides in the gut: sugar-driven symbioses between microbe and host. J Biol Chem. 2017;292:8569-76.
26. JGI Genome Portal – Home. https://genome.jgi.doe.gov/portal/. Accessed 3 March 2017.
27. Sievers F, Wilm A, Dineen D, Gibson TJ, Karplus K, Li W. Fast, scalable generation of high-quality protein multiple sequence alignments using Clustal Omega. Mol Syst Biol.
2011;7:539.
28. Kearse M, Moir R, Wilson A, Stones-Havas S, Cheung M, Sturrock S, et al. Geneious Basic:
an integrated and extendable desktop software platform for the organization and analysis of sequence data. Bioinformatics. 2012;28(12):1647-9. Geneious - Molecular Biology and NGS Analysis Tools.
29. Protein [Internet]. National Library of Medicine (US), National Center for Biotechnology Information, Bethesda. https://www.ncbi.nlm.nih.gov/protein/. Accessed May 2017.
30. Juncker AS, Willenbrock H, Von Heijne G, Brunak S, Nielsen H, Krogh A. Prediction of lipoprotein signal peptides in Gram-negative bacteria. Protein Sci. 2003;12(8):1652-62.
FIGURES
Figure 1. Mouse GI Microbial GUS Enzyme Identification, Localization, and Composition.
A. An assembled mouse gut metagenome dataset was examined for GUS proteins using
Metagenome Analysis by Protein Structure (MAPS) and following the method outlined in [15].
B. Assignment of Loop Classifications for the Mouse GUSome (Mouse338) and previously published assignment for the Human GUSome (HMGC279). “No Coverage” indicates sequences that did not have sequence information in the Loop 1 or Loop 2 region. C. GUS protein length colored by loop category. Ninety proteins had unclear length. D. Predicted signal sequence presence by GUS loop category; enzymes without a clear sequence in this region are labeled
“unc.” for uncertain.
Figure 2. Mouse338 and HMGC279 Loop Classification and Sequence Similarity Network.
A. Loop classification of proteins unique to mouse, unique to human, and shared by the two datasets. B. Loop composition of unique mouse, unique human, and shared proteins with number and percentage of GUS enzymes for each loop category. C. Sequence similarity network of the Mouse338 and HMGC279 datasets with loop category and source dataset labeled.
Figure 3. Mouse338 Taxonomy and Mouse338 Loop Classification Taxonomy. A. Phylum composition of the Mouse GUSome compared to the Human GUSome with number and
percentage of GUS enzymes for each Phylum. B. Phylum composition of each loop category for the Mouse GUSome with number and percentage of GUS enzymes for each Phylum. C.
Cladogram for the 338 GUS sequences including sequences with unclear taxonomy. GUS loop types are colored accordingly.
Figure 4. Mouse Strain Loop Classification and Taxonomy. A. Loop composition of each mouse strain used with number and percentage of GUS enzymes for each loop category. B.
Phylum composition of each mouse strain used with number and percentage of GUS enzymes for each Phylum.
Figure 5. Mouse Diet Loop Classification and Taxonomy. A. Loop composition of high fat and low fat diet mice with number and percentage of GUS enzymes for each loop category. B.
Phylum composition of high fat and low fat diet mice with number and percentage of GUS enzymes for each loop category.
Figure 6. In vitro Analysis of Low Fat-specific GUS enzyme BoGUS L2. A. BoGUS L2 pH screen. B. Kinetic parameters (kcat, KM, kcat/KM) of previously uncharacterized BoGUS L2, BuGUS L2, and BfGUS mL1 with the previously published EcGUS L1 [7]. C. Structure of two heparan sulfate nonasaccharides tested with BuGUS L2 and BoGUS L2. (D) Data from testing carbohydrate glucuronides with BuGUS L2 and BoGUS L2.
TABLES
Table 1. GUS Enzymes Unique to Low-Fat Diet. Table of enzymes unique to mice on a low fat diet, with the following factors listed, where applicable: Protein ID, Sequence Length, Loop Type, and Taxonomy.