Abstract— K-Means is one of the partitioned clustering techniques where each cluster is represented by its mean values. A problem in this technique is that the iterative optimal procedure cannot guarantee the convergence to a global optimum, since it depends on the initial points. Multi-objective genetic algorithm with Pareto rank approach can be used to increase the K-means performance. This approach yields a set of solution that consists of several fronts based on their ranks. The first Pareto front consists of non-dominated solution; in this research it consists of a pair of values where the distance between points in a cluster is minimum, and the inter-cluster distance between clusters is maximum. The minimum Davies-Bouldin validity index and suitable cluster number are used to find out the optimal solution. The aim of this research is to compare two techniques, i.e. K-means and K-means with multi-objective genetic algorithm with non-dominated pareto rank for Iris data. K-means for Iris data yields an index of 0.20. K-means multi-objective genetic algorithm with population size of 50 and 200 generation yields an optimum index of 0.18 for the cluster number of 3. means for Wine data yields an index of 0.08. K-means multi-objective genetic algorithm with population size of 50 and 100 generations. Smaller index indicates that K-means multi-objective genetic algorithm has better solution compared to that of K-mean.
Index Term— K-Means, multi objective genetic algorithm, Non dominated sorting, Pareto ranking
I. INTRODUCTION
A. Background
Clustering is a technique of dividing data into several clusters (groups or segments) where each cluster can be assigned several members together. One of the partitioning clustering techniques is K-means, which partitions the data in the form of two or more clusters or groups [1].
One of the weaknesses of K-Means algorithm is that it can only achieve a local minimum, but is difficult to achieve global optimum. Another disadvantage is the amount of cluster
Yandra Arkeman is with the Department of Agroindustrial Technology and also Department of Computer Science, Bogor Agricultural University (IPB),
Indonesia (Phone : +62-251-862-1974; email: [email protected]) Nursinta A.Wahanani is with the Department of Computer Science, Faculty
of Math and Science, Bogor Agricultural University, Bogor, Indonesia (Phone :+62-815-974-3263; email: [email protected]) Aziz Kustiyo with the Department of Computer Science, Faculty of Math
and Science, Bogor Agricultural University, Bogor, Indonesia
that is not known by the user causing ineffectiveness in practice. K-Means is also very sensitive to outlier. Another limitation is the K-Means only works on numerical attributes, and it cannot get to the variable categories. Furthermore, for numeric data that do not have the meaning would be very difficult to interpret [2]. K-Means is also not scalable and not balance in the Forgy version, and even allows for empty [1].
One of the methods to improve the performance of the K-Means clustering is the genetic algorithm. An application of genetic algorithm in optimization of K-Means clustering, among others, is in the search for images based on color feature with a GA-K-Means Clustering [3]. Grouping of images based on both color and shape resulted in a faster computation than images based on only color [4]. Merging numeric data type and category by Fast Genetic Algorithm K-Means (FGKA) using benchmark data (Iris, Vote, Heart Disease) provided quite effective results [5]. Grouping of images based on both color and texture features by using a FGKA resulted in a better accuracy and computational time compared to that of images based on just color or texture only [6]. The objective function of FGKA is to minimize the variance within each cluster.
An index validity is used as a method for quantitative evaluation of clustering results. Davies-Bouldin index approach aims to maximize the distance of inter clusters, and at the same time, to try minimizing the distance between points in a cluster [7].
This research aims to conduct optimization of K-Means clustering with two goals i.e. minimizing variants in each cluster, as well as maximizing the variants between the cluster. The optimization method used was multi-objective genetic algorithm with non-domination pareto rank sorting approach. Research in clustering related to multi-objective genetic algorithm was, among others, the cluster distance optimization on network intrusion data by using Fuzzy C-Means. The objective function used was Jm and Xie-Beni [8].
B. Objective
The objective of this research is to compare method of K-Means and K-K-Means multi-objective genetic algorithm using non-dominated pareto rank sorting on the iris and wine data.
II. METHODOLOGY
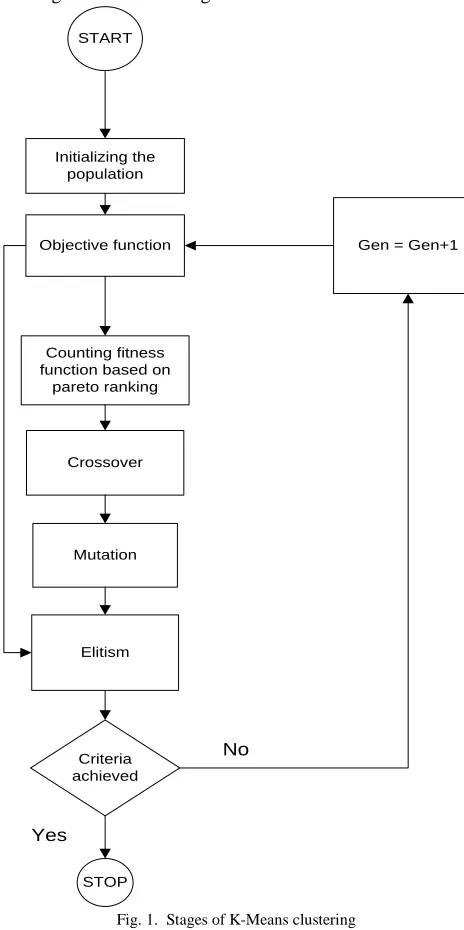
The stages of K-Means clustering are consists of initializing the population, making objective function, counting fitness function based on pareto ranking, crossover, mutation, etilism
Clustering K-Means Optimization with
Multi-Objective Genetic Algorithm
until the criteria achieved. The flow chart of K-Means clustering can be seen in Fig. 1.
START
Initializing the population
Objective function
Crossover
Mutation
Criteria achieved
STOP
Gen = Gen+1
No
Yes
Counting fitness function based on
pareto ranking
Elitism
Fig. 1. Stages of K-Means clustering
A. Initializing population
The initial population is done by determining the length of chromosome with size K x d. K is the number of chromosome a lot of d while d is the dimension of the cluster variables. For example, the data slice with cluster = 3 (3 types of iris: iris versicolor, iris setosa, iris Crassostrea) and variable dimensions of 4 (petal length, sepal length, petal width, sepal width) then the chromosome length is 12 as represented in Fig. 2.
V
1
1V
1
2V
1
3V
2
1V
2
2V
2
3V
3
1V
3
2V
3
3V
4
1V
4
2V
4
3 Fig. 2. Initialization of the iris chromosomesVd1.... Vdk is a random value which generated according to the minimum and maximum values of the variable d.
B. O bjective Function
K-Means clustering optimization with multi-objective genetic algorithm uses 2 objectives, i.e. minimizing variance functions within each cluster (equation 1) and maximizing the variance between cluster (equation 2). The calculations used as follows
∑ ………1)
Where i = 1, 2, ..., K; K is the number of cluster
∑ ………2)
Whereas:
σ2
i : variant in i-th cluster
ni : number of data in banyak data pada i-th cluster
xij : Data in i-cluster, j-th variabe
zij : i-cluster average in j-variable
v : Number of variable
The first function is to minimize variant average in cluster which formulated as follow :
( ) ∑
( )
Whereas :
V(w) : Variant in cluster
k : Number of cluster
The second function is to maximize inter-cluster variant which formulated as follow:
( ) ∑ ∑ ( ̅ ) ) dengan :
V(b) : Variant in cluster
z
ij: i-cluster average in variable
̅
:
Grand mean of j-th variableC. Fitness Function with Pareto Ranking Approach
Fitness function is calculated by using pareto ranking approach, where each individual datum is evaluated by the overall population based on the non-domination concept. Next, pareto ranking approach is done by equations 3 [12].
( ) ( )…………3)
Whereas:
r2(x,t) : x-th completion rank in t-th iteration
nq(x,t): : Solution number which dominate x completion in t-th iteration
D. Crossover
( )
∑ ( )……….4)
whereas:
pz : z-th completion selection probability
F(Sz) : fitness value in Sz solution
E. Mutation
Another genetic operator is mutation. This process is exploits against the possibility of modifications to the existing results. The selection process of chromosome mutations, as well as the position of a gene to be transformed will be done in a random. The number of affected offspring is determined by the mutation probability as in equation 5
( )– ( )
∑ ( ( ) ( ) )…….5) Whereas :
pk
:
Mutation probability in k-th clusterd(Xn,ck)
:
jarak Euclidean distant between Xn data and ckcentre point of k-th cluster. dmax(Xn)
:
max k {d(Xn,ck)}.If k-th group is empty then d(Xn, ck)is defined as 0. [13]
F. Elitism
The random selection doesn't guarantee the non-dominated solutions will survive in the next generation. The real step for elitism in multi-objective genetic algorithm is doubling the non-dominated solution in population Pt, henceforth will be included in the population of Pt + 1 by selecting the non-dominated solution.
G. Davies-Bouldin Index
Davies-Bouldin index is used to maximize the distance between cluster Ci and Cj, and at the same time, it is used to minimize the distance between the points in a cluster with the center of the cluster. The distance sc (Qk) within a cluster Qk is defined by:
( ) ∑ ‖ ‖ (6) Where Nk is the number of points belong to a cluster Qk, and
∑
The distance between clusters is defined as
‖ ‖, so that DB index DB index is defined as:
( ) ∑ { ( ) (
( }
……..6)
III. RESULTSANDDISCUSSION
A. K-Means Clustering
The calculation of K-Means Clustering is based on the average variable for each cluster, sum-of-squared-error for each cluster, and the amount of data on each cluster. The results of the calculation are the value of variance within
cluster, variance between cluster and Davies-Bouldin validity index. For iris data, the number of cluster 3, 4, 5, and 6 are used. The method of selection DB index value was done by choosing smaller index value in order to get minimum probability of similarity inter-cluster. Summary of results is shown in Table 1 below. The selected result of culstering k-means iris data is the total of cluster 3 with minimum DB index which is 0.20.
TABLE I
SUMMARY OF THE RESULTS OF THE CLUSTERING K-MEANS IRIS DATA
Number of Cluster
Variance in the Cluster
Variance between
Cluster DB Index
3 0.52 4.42 0.20
4 0.39 4.84 0.30
5 0.32 4.62 0.35
6 0.26 3.83 0.40
As for the wine data, the number of cluster of 3, 4, 5, 6, and 7 are used. The Summary of the results is shown in Table 2. The selected clustering k-means iris data is the total of cluster 6 with minimum DB which is 0.12
TABLE II
SUMMARY OF THE RESULTS OF THE CLUSTERING K-MEANS USING WINE DATA
Number of Cluster
Variance in the Cluster
Variance between
Cluster DB Index
3 14839.12 92695.28 0.19
4 8855.88 111359.30 0.15
5 6446.82 117949.90 0.20
6 4592.90 111439.30 0.12
7 2743.73 146678.00 0.14
From Table 1 and Table 2 can be seen that variant value in cluster is becoming smaller as well as the increase of cluster number
B. Clustering K-Means with Genetic Algorithm
results of the iris data to cluster 3, 4, 5 and 6 as in Table 3. From those results can be seen achieved on cluster index optimum as much as 3 with a value index of 0.18.
TABLE III
SUMMARY OF THE K-MEANS AG IRIS DATA
Number of Cluster
Variance in the cluster
Variance between
cluster DB index
3 0.56 5.25 0.18
4 0.48 4.74 0.23
5 0.33 3.98 0.29
6 0.26 2.64 0.39
While the results for wine data using cluster 3, 4, 5, 6 and 7 are shown in Table 4. From those results, it can be seen that the optimum index is obtained for the number of cluster 3 with a value index of 0.08.
TABLE IV
SUMMARY OF THE K-MEANS AG FOR WINE DATA
Number of Cluster
Variance in the cluster
Variance between
cluster DB index
3 1.50E+04 1.50E+05 0.08
4 9.80E+03 1.37E+05 0.13
5 6.44E+03 2.17E+05 0.09
6 4.81E+03 1.46E+05 0.12
7 3.94E+03 1.65E+05 0.14
C.Comparison between K-Means and K-Mean Genetic Algorithm
Comparison between K-Means and K-Means Genetic Algorithm is based on the value of Davies-Bouldwin index which aims to maximizing the distance between cluster, while at the same time, minimizing the distance inside the cluster itself. Summary of the results of the comparison of the two methods is shown in Table 5.
TABLE V
COMPARATION OF DB INDEX
Dataset
K-Means optimum
K-Means AG optimum
Iris 0.20 0.18
Wine 0.12 0.08
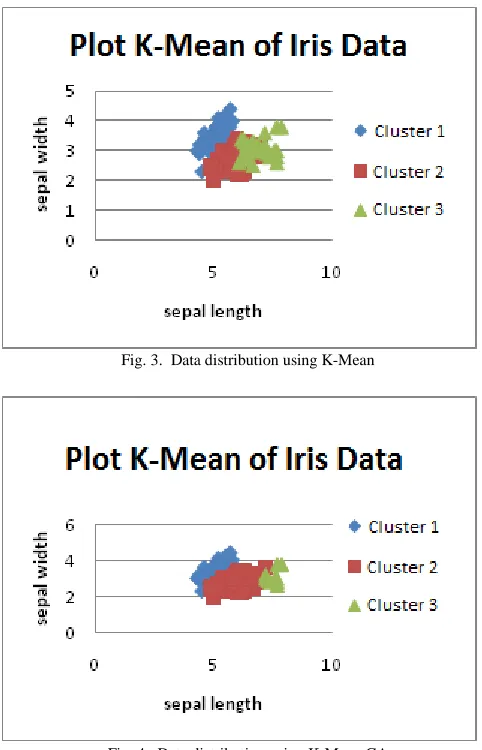
On iris data, these two methods achieved optimum on the number of cluster 3. The distribution of the data for each method is shown in Fig. 3 and Fig. 4 respectively. On K-Means, separation between groups is not so clear, whereas data distribution in cluster 2 and cluster 3 have many cumulation which means there is no different value. The data
distribution in cluster can be seen, there are data which separated from their group. Whereas in Fig. 4 (K-Mean AG) the separation is relatively better. The data distribution in cluster have been clustered in their cluster group and the data distribution inter cluster are visible separate each other
Fig. 3. Data distribution using K-Mean
Fig. 4. Data distribution using K-Mean GA
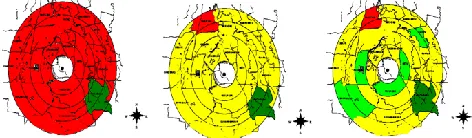
in a separate cluster (Figure 6). This is due to Pengasinan Village has 6 percentage of low diseases while Sampora disease has 6 percentage of high diseases. In terms of location, Pengasinan was far in southeast while Sampora located in the northwest. Both villages are located relatively far from Nuclear Energy Research Establishment of Serpongbut both have different percentage levels. Clustering results of 18 villages within the radius of 5 km PPTN Serpong based on six types of diseases showing the location of the patient which spreadly, it does not depend on location distance of Nuclear Energy Research Establishment of Serpong . Cluster region result for cluster number of 2, 3 and 4 can be seen in Figure 5.
Figure 5. Cluster region result for cluster number of 2, 3 and 4
D. Agroindustry Management
Agro-industry is an industry which the activities are processing materials derived from plants or animals through processing, preservation, alteration of the physical, chemical conversion, packaging and marketing distribution (Austin 1992). Management in agroindustry is done in order ito make the agroindustrial activity can be done effectively and efficiently. Related research that was conducted by Hadiguna (2010) is in terms of the quality of each unit of risk management supply chain where the management of the farm management activities is done to minimize transport time, evaluating the number of trips and ensure the availability of trucks. Supply chain activitiy is complex enough to do because it requires a combination of the supply chain parameters (Andrian 2007). Another issue is the use of agro farms where land use has sustainability for bio-energy, so it is necessary to compare the model of land use change land nowaday and for the future with a minimum of risk.
By the existing problems in the management of agro-optimization process, it can be conclude that it is required to make the right combination to minimize or maximize. Optimization process can be done by using genetic algorithm if it has a single objective, or Multi-Objective Genetic Algorithm if the goal is to see more than one of several influece factors.
CONCLUSION
Performance improvement of K-Means can be done by using a multi-objective genetic algorithm with Pareto ranking approach. The result obtained is Pareto front which is a set of solutions that meet the objective of minimizing the variance within clusters and maximizing variance between clusters. The criteria used to select the optimal solution are a minimum Davies Bouldin index and the desired number of clusters.
Comparison of K-Mean and K-Mean Multi-objective GA has been performed on the Iris and Wine Data. On Iris Data,
K-Mean achieved the index of 0.20 with the number of cluster was 3, while K-Mean GA reached the index of 0.15 on the amount of cluster 3. On Wine data, K-Mean got the index of 0.12 on the number of cluster of 6, while K-Mean Multi-objective GA reached the index of 0.10 on the amount of cluster 5. These results can be concluded that K-Mean GA could reach a better optimal solution than K-Mean, which is able to find minimum index value.
REFERENCES
[1] Berkhin, Pavel. 2002. Survey of Clustering Data Mining Technique."
http://www.ce.ucr.edu/barth/EE242/clustering_survey.pdf. [2] Xu, Rui. 2009. Clustering. John Wiley & Sons.
[3] Widodo, Yanu. 2008. Pencarian Gambar Berdasarkan Fitur Warna Dengan GA-KMeans Clustering." Jurusan Teknologi Informasi, Politeknik Elektronika Negeri Surabaya.
[4] Rahmanti, Farah Zakiyah, dan Entin Martiana. 2010. Pengelompokkan Gambar Berdasarkan Warna dan Bentuk Menggunakan FGKA Clustering. Jurusan Teknik Informatika, Politeknik Elektronika Negeri Surabya-ITS.
[5] Dharmendra, Roy, dan Sharma Lokesh. 2010. Genetic K-Means Clustering Algorithm for Data Mixed Numeric and Categorical Data Sets." IJAIA Vol.1 No.2.
[6] Wulansari, Dewi, Entin Martiana, dan Nana Rahmadiyanti. 2011. Pengelompokkan Gambar berdasarkan Fitur warna dan tekstur dengan FGKA Clustering.
[7] Salazar, EJ, AC Velez, MCM Parra, dan LO Ortega.2002. A Cluster Validity Index for Comparing Non Hierarchical Clustering Methods.
[8] Adi, Wasis Waskito. 2010. Optimasi Jarak Cluster Pada Data Intrusi Jaringan Menggunakan Multiobyektif Genetika Algoritma." Jurusan Teknik Elektrik ITS.
[9] Andria, Y. 2007. Optimasi Model Rantai Pasokan Agroindustri Cocodiesel dengan menggunakan Algoritma Genetika. Teknik Industri Pertanian, Institut Pertanian Bogor.
[10] Austin, J.E. 1992. Agroindustrial Project Analysis; Critical Design Factors. EDI Series in Economic Development. Baltimore and London: The Johns Hopkins University Press. Teknologi Industri Pertanian, Institut Pertanian Bogor.
[11] Hadiguna, R A. 2010. Perancangan Sistem Penunjang Keputusan Rantai Pasok dan Penilaian Risiko Mutu pada Agroindustri Minyak Sawit Kasar.
[12] Konak A, David WC, Smith AE. Multi-objective optimizationusing genetic algorithms : A tutorial. Realibility Engineering and System Safety, 2006: 992-1007.
[13] Lu Y, Lu S, Fotouhi F. FGKA: A Fast Genetic K-Means Clustering Algorithm." Proceedings of the 2004 ACM symposium on Applied computing. New York,USA: ACM, 2004. 622-623.
ACKNOWLEDGMENT
AUTHORS
Yandra Arkeman was born Payakumbuh (West Sumatera) in September 14th
1965. He graduated from Department of Agroindustrial Technology, Bogor Agricultural University in 1989 and received M. Eng Ph.D degree in Manufacturing System Engineering from University of South Australia in 1996 and 2000 consecutively. He conducted post- doctoral research in Computer Science and Agroindustrial Informatics in Japan (2004-2006) and USA (2009/2010). He is member of Society of Manufacturing Engineers(SME), Institute of Industrial Engineers (IIE) and International Society of System Science (ISSS). His biography is included in Who’s Who in Science and Engineering 1998/1999.
He is a lecturer in Department of Agroindustrial Technology and also Department of Computer Science, Bogor Agricultural University (IPB). His research interests are in computational intelligence, parallel/super computing technology and their application to agroindustry.
Nursinta A. Wahanani was born in Madiun, January 11st 1977 She received
B.Sc degree from Department of Statistic 10 November Institute of Technology (ITS), Master degree from Bogor Agricultural University (IPB) She is a staff in National Nuclear Energy Agency. Her research interests are in mathematics computing
Aziz Kustiyowas born in July , 19th , 1970. He received B.Sc. degree from Bogor Agricultural University, M. Kom degree from 10 November Institute of Technology (ITS)