Tariff Agent: Interacting with a Future Smart Energy System at Home
ALPER T. ALAN, University of Southampton ENRICO COSTANZA, University of Southampton SARVAPALI D. RAMCHURN, University of Southampton JOEL FISCHER, University of Nottingham
TOM RODDEN, University of Nottingham
NICHOLAS R. JENNINGS, University of Southampton
Smart systems are becoming increasingly ubiquitous, and consequently transforming our lives. The level of system autonomy plays a vital role in the development of smart systems as it profoundly affects how people and these systems interact with each other. However, to date, there are very few studies on human interac-tion with such systems. This article presents findings from two field studies where two different prototypes for automating energy tariff-switching were developed and evaluated in the wild. Both prototypes offer flex-ible autonomy by which users can shift the system’s level of autonomy among three options: suggestion-only, semi-autonomy and full autonomy, whenever they like. Our findings based on thematic analysis show that flexible autonomy is a promising way to sustain users’ engagement with smart systems, despite their oc-casional mistakes. The findings also suggest that users take responsibility for the undesired outcomes of automated actions when delegation of autonomy can be adjusted flexibly.
Categories and Subject Descriptors: H.5.2 [Information Interfaces and Presentation]: User Interfaces
General Terms: Design, Algorithms, Human Factors
Additional Key Words and Phrases: Interactive intelligent systems, human-agent interaction, flexible au-tonomy, smart grid, field study, internet of things
ACM Reference Format:
Alper T. Alan, Enrico Costanza, Sarvapali D. Ramchurn, Joel Fisher, Tom Rodden, and Nicholas R. Jennings, 2015. Tariff Agent: Interacting with a Future Smart Energy System at Home.ACM Trans. Comput.-Hum. Interact.V, N, Article A (January YYYY), 28 pages.
DOI:http://dx.doi.org/10.1145/0000000.0000000
1. INTRODUCTION
The increasing availability and miniaturisation of low-cost sensing, actuation and com-putational devices is likely to result in the wide adoption of sensor-based “smart” appli-cations and systems that leverage large amounts of data to assist our decision making. Given this, researchers and practitioners need to address the challenge of designing interactive systems to help people take advantage of this data in a variety of contexts. Here we focus on domestic energy use as an application domain to study human in-teraction with smart systems. In this domain, a significant amount of work to date has focused on how information can be presented in the form of feedback that may help us change our consumption behaviours and more efficiently utilise the limited resources of our planet [Fischer 2008; Froehlich et al. 2010], while a smaller number of projects have investigated systems that automatically sense and respond to envi-ronmental changes. Examples of the latter include “smart” thermostats that take into account our whereabouts and learn our heating preferences [Gupta et al. 2009; Yang and Newman 2013; Yang et al. 2014].
real-life systems, that result in the operation of these “smart” autonomous systems be-ing, at times, sub-optimal or, in the worst case, detrimental. For example, recent work examining the real-world uptake of a smart thermostat highlighted how such errors are likely to cause users’ frustration and may lead them to abandon the technology [Yang and Newman 2013; Yang et al. 2014]. It is therefore crucial that researchers and designers understand how to best design interfaces and interaction techniques that make the system status and operation clearly readable, and that allow its users to easily shift between autonomous and manual operation, a notion known as “flexible autonomy” [Jennings et al. 2014].
In particular, our focus is on how autonomous interactive computing systems may mediate user interaction with future energy infrastructure: the “smart” grid. The choice of such a setting is driven by several factors. First, energy as an application is important in itself for its societal and economic implications [MacKay 2009]. Second, energy systems provide an opportunity to study rich interactions with prototypes of fu-ture autonomous interactive systems ‘in the wild’ since electricity is invisible (so much so that prior work aimed at materialising its representation, e.g., [Pierce and Paulos 2010]), easy to measure with inexpensive and easy-to-install Internet-connected sen-sors, and its consumption is related to money in a way familiar to most users: through energy bills. These characteristics make it possible to design and run field trials where financial experimental reward is linked to participants’ real electricity consumption
and their use of prototypes, thus rendering the systems’ usefulness more tangible to the participants. Indeed, exposing potential users to functioning prototypes ‘in the wild’ has long been recognised as critical for research of interactive systems [Rogers et al. 2007].
More specifically, we hope to elicit design guidelines for smart systems. In partic-ular, to allow their non-expert users to understand that these systems might not be smart all the time and that they may make incorrect decisions in some situations due to uncertainties therefore it is important to keep interacting with these systems to maintain their benefit. To this end, and to examine user interaction with an au-tonomous system, we designed and implemented a novel home energy management system called Tariff Agent1[Alan et al. 2014; Alan et al. 2015], which monitors house-hold energy consumption, as well as available energy tariffs, and therefore calculates the best tariff, and (optionally) automatically switches to it. In this article we present two field studies, where two different prototypes of Tariff Agent were studied in dif-ferent households to examine their interactions with the system for short and longer terms. The second prototype was built based on the results of the first study, and eval-uated for a longer term compared to the first. The aim of each study was to investigate human orientations towards autonomy and smart systems. The questions addressed were: (i) how would users perceive an autonomous tariff-switching system that may affect their financial situation and possibly intrude upon their daily routines, and (ii) what level of control would users delegate to the system in the face of its occasional mistakes? Based on quantitative analysis of user interaction logs and qualitative anal-ysis of semi-structured exit interviews, a number of findings are presented, including the key observation that some users willingly delegated control to the system and most users regularly kept engaging with it, despite its occasional mistakes. The article dis-cusses why this is the case and suggests a number of design and research implications. The main contributions of this work can be summarised as follows.
— We empirically demonstrate that flexible autonomy is a promising approach to sus-tain user interaction with smart energy systems.
— We present households’ preferences for different levels of control over an autonomous energy system with real-world deployments for both short and longer terms.
— We show that users take responsibility for any undesired outcomes of automated actions when delegation of autonomy can be adjusted flexibly.
Moreover, Tariff Agent is the first energy application that offers flexible autonomy and is evaluated in the field. While a preliminary analysis of the first study and an outline of the second were reported in [Alan et al. 2014] and [Alan et al. 2015] respec-tively, in this article we present for the first time a thorough analysis of the results of both studies, and their joint discussion, on which our contributions lay. In the remain-der of the paper, we first introduce prior work on smart domestic energy systems. In Section 3, we present the description of our study methodology. Later in Sections 4 and 5, we introduce each of our two prototypes and the findings of their field evaluations – even though the prototypes and study methodology were described in prior work [Alan et al. 2014; Alan et al. 2015], we include here a summary for clarity. Subsequently, we discuss our findings and highlight their implications for the design of autonomous systems for everyday use.
2. BACKGROUND
There has been considerable attention within Human-Computer Interaction (HCI) research on exploring domestic energy consumption. The majority of these previous studies have focused on providing consumption feedback to motivate energy conser-vation behaviours [Schwartz et al. 2013; Pierce and Paulos 2012; DiSalvo et al. 2010; Froehlich et al. 2010]. Our work is different from these studies in that we do not focus on the problem of energy saving, and we go beyond providing consumption feedback to explore human interaction with autonomous energy systems. Indeed, researchers have recently underlined opportunities for HCI to engage more with interdisciplinary studies [DiSalvo et al. 2010] and emerging energy systems such as the smart grid, demand response, and distributed generation technologies [Pierce and Paulos 2012]. We respond to these calls by adopting Artificial Intelligence (AI) and HCI perspectives, specifically by prototyping and deploying a future autonomous smart grid application and by evaluating it in the field.
Ramchurn et al. [2012] describe the essential role of software agents, which au-tonomously act on behalf of users, to implement smart energy systems, and highlight that users need to understand the consequences of automated actions and with their own consent delegate control to agents. In this respect, Rodden et al. [2013] have ex-plored users’ reactions towards a future smart energy infrastructure based on software agents by using animated whiteboard sketches. Their results suggest that users may accept the help of agents for managing energy, but would do so reluctantly because of the lack of trust that people have in energy companies. Our work follows on this research, but is based on real-world deployments that enable users to gain first-hand experience by using the technology in their everyday life.
Related to our work, Yang and Newman [2013] have examined the real-world uptake of a smart thermostat (Nest2) with 23 participants. They highlighted how sub-optimal decisions taken by a smart thermostat are likely to cause users’ frustration and may lead them to abandon the technology. A more recent follow-up study [Yang et al. 2014] investigated users’ long term interactions with the smart thermostat. Findings show that users’ interactions faded over time and resulted in unrealised energy saving op-portunities. The authors propose that a mixed-initiative system design might improve the sustainability of user engagement and the system’s usefulness. Indeed,
initiative system design has been accepted as a useful approach for improving collab-oration between agents and humans in various domains such as information search, integration and retrieval [Kerne et al. 2008; Zimmerman et al. 2009]. To study mixed-initiative design in the wild, in this article we investigate how people respond to a smart energy system with flexible autonomy. The concept of flexible autonomy is based on the principles of adjustable autonomy [Scerri et al. 2002] and mixed-initiative de-sign [Horvitz 1999]. It indicates that the level of autonomy of an autonomous system can be dynamically changed by its user and the user can provide input into the system to improve its performance at any point in time.
Closer to our work, Bourgeois et al. [2014] deployed energy-aware washing machines that provide users suggestions on when to do their laundry based on the availability of solar power. They studied various intervention techniques with 18 households for 8 months, and showed that proactive suggestions sent by an agent via text messages are more effective than the agent’s email interventions. Similarly, Costanza et al. [2014] proposed “Agent B”, an agent that also helps users book their washing machine in a scenario where electricity prices change every 15 minutes. In a field experiment, 10 participants used Agent B for one month. Results demonstrate that Agent B helped users shift their laundry in response to real-time prices. While these are successful examples of field studies of future agent-based energy systems, users still need to per-form the core task manually (i.e., doing the laundry or booking it). We aim to go one step further, and investigate human interaction with flexible autonomy, where users can decide if the system will provide only a tariff suggestion or fully automate the tariff decision on their behalf.
3. METHODOLOGY
We aim to study how people interact with an autonomous system that can proactively make decisions, which may have financial consequences and impact on the daily rou-tines of its owner. In order to obtain meaningful results from such a study, it is crucial to offer a high degree of ecological validity. Therefore we designed and carried out two field trials by deploying different versions of Tariff Agent to observe how people make use of the system as a part of their everyday life, for both short and longer terms. The system development is inspired by the future scenario depicted in previous work [Rod-den et al. 2013], where autonomous agents embedded in households have the ability to switch the energy providers based on their offered rates and the households’ consump-tion routines. The concept of switching energy suppliers or tariffs is familiar to house-holds in the UK, especially as a number of government media campaigns in recent years encouraged consumers to change often in order to save on energy bills. Domestic energy consumers in the UK can switch their tariff through websites or call centres as often as they wish but the switching process may take time, on average around 17 days3. We condensed this actual scenario in order to be able to run field studies of limited duration. Therefore, in our field studies, we assume that every household can switch its electricity tariff every day, one day in advance, through our agent-based application.
To recruit participants we utilised personal contacts and snowball sampling, with the constraint that all participants would be blind to the purpose of our research. The recruitment criteria for participants were to have a broadband Internet connection, basic knowledge of Internet use, and to live in flats or houses where off-the-shelf en-ergy monitoring kits could be easily and safely installed without the intervention of a professional electrician. Participants were asked to install the kit on their own and make sure it runs throughout the study, but support was provided where necessary.
After the installation of the monitoring kits, our agent-based web application was in-troduced to participants. In particular we emphasised that the system does not affect their actual energy tariffs and bills, yet their daily energy cost and therefore the mone-tary reward that they will receive at the end is calculated based on their actual energy consumption and the tariff they select on the system. We detail the use of monetary reward below.
To motivate participants to engage with and experience the use of an autonomous system that may affect them financially, we provided monetary incentives based on their study performance. This idea of using monetary incentives to mimic energy pric-ing was inspired from earlier studies [Slavin et al. 1981; Costanza et al. 2014], where participants were rewarded according to their study performance. At the beginning of our studies, a certain level of budget was allocated to each participant, and their daily consumption cost was deducted from this budget over the period of the trial. At the end of the studies participants received payments (in the form of a shopping voucher) according to the amount left on their budget. By so doing, we aimed to make their sav-ings have a real and tangible impact, and therefore encourage participants to engage with the system.
To reveal users’ orientation towards an autonomous energy system we performed both quantitative and qualitative analysis. Quantitative data was collected through automatically recorded system logs, documenting the interaction of users with the sys-tem (e.g., how many times participants visited a specific page or changed the syssys-tem’s autonomy level). However, such data alone does not provide enough information to understand users’ behaviour, for example why they would opt for a certain autonomy level or visit a certain page more frequently. Therefore, we complemented it with semi-structured exit interviews. These interviews focused on participants’ use, adoption and understanding of the system, and lasted between 20 and 30 minutes. In the interviews, we asked open questions mostly related to their actual experience with the deployed system.
4. THE FIRST STUDY
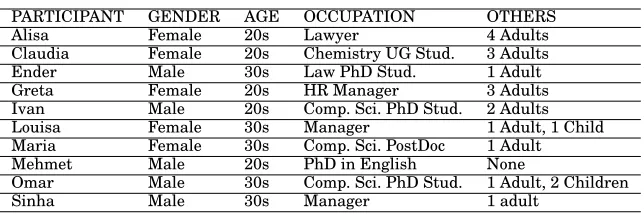
[image:5.612.146.468.515.622.2]We recruited a total of 10 participants (5 female) for the first field study. The first field study was conducted for 14 days, where participants engaged with the initial version of Tariff Agent. At the beginning of the study all participants were allocated a budget of£30 for spending during the study. Half of the participants were local professionals working in different sectors, while the other participants were members of the univer-sity (see Table I for detailed profiles).
Table I. Participants’ profiles for the first study.
PARTICIPANT GENDER AGE OCCUPATION OTHERS
Alisa Female 20s Lawyer 4 Adults
Claudia Female 20s Chemistry UG Stud. 3 Adults
Ender Male 30s Law PhD Stud. 1 Adult
Greta Female 20s HR Manager 3 Adults
Ivan Male 20s Comp. Sci. PhD Stud. 2 Adults
Louisa Female 30s Manager 1 Adult, 1 Child
Maria Female 30s Comp. Sci. PostDoc 1 Adult
Mehmet Male 20s PhD in English None
Omar Male 30s Comp. Sci. PhD Stud. 1 Adult, 2 Children
Sinha Male 30s Manager 1 adult
modalities of the system in Subsection 4.3. In Subsection 4.4, we present the analysis of quantitative and qualitative data.
4.1. Tariff Scenario and Tariff Specifications
We consider a daily electricity tariff switching problem so as to be able to create a field study of limited duration (as depicted in the previous section). We assume that every household can switch tariff every day one day in advance, and can select its tariff only from two types of suppliers. The first type purchases their energy from traditional fossil fuel power stations, therefore they have dependable production for fluctuating demand, and sell electricity at a constant rate (rstd), in our scenario 15 p/kWh (pence
per kilowatt-hour). The second type of supplier sells electricity at a variable rate that may change every day. This type of supplier buys its day-ahead energy from a wind generator that has different production every day depending on the weather. It needs to buy extra energy from the real-time market to meet possible shortfalls in supply. Thus, it passes such costs to its consumers through offering two rates: a low raterwind
is applied to the consumption covered by the wind generation, while a high raternowind
[image:6.612.209.406.303.347.2]is applied to the rest of the consumption.
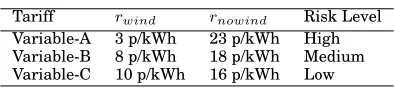
Table II. Tariffs in p/kWh.
Tariff rwind rnowind Risk Level
Variable-A 3 p/kWh 23 p/kWh High Variable-B 8 p/kWh 18 p/kWh Medium Variable-C 10 p/kWh 16 p/kWh Low
To make the tariff switching problem more challenging for the users and therefore encourage them to consider delegating the process to an agent, we introduced three different suppliers from the second type, named as A, B and C (see Table II). Each of these three suppliers offers a tariff with a different combination of low rate and high rate, corresponding to a different level of risk for the user. Tariff Variable-A is considered high risk because the gap between the low rate and the high rate is highest (rwind: 3 p/kWh,rnowind: 23 p/kWh), Variable-B is medium risk (rwind: 8 p/kWh,rnowind: 18 p/kWh), and Variable-C is lower risk (rwind: 10 p/kWh, rnowind: 16 p/kWh). The
standard rate lies between the rwind andrnowind rates offered by these three tariffs. Therefore, it is not easy to decide which tariff is the cheapest.
In particular, there are two types of uncertainty affecting the tariff selection deci-sion. The first one is personal uncertainty in predicting the user’s own consumption for the next day, for example consumption might change with unpredictable visits by friends for a dinner or running out of clean clothes and therefore needing to do a wash. The second uncertainty is environmental since the availability of wind energy is weather dependent and therefore, while hourly predictions may be reasonably good, day-ahead predictions are likely to be inaccurate [Truong et al. 2013].
4.2. Software Agent
In our tariff switching scenario, planning which tariff to select and when to change it is a well-suited task for a software agent since it is necessary to continuously monitor the changing consumption and wind energy to predict the best tariff.
Participants’ energy consumption is monitored through off-the-shelf home energy monitoring devices (AlertMe4). These devices measure the total consumption of the household through a current clamp, and make the data available through an HTTP
API. Predicting day-ahead usage accurately has been shown to be a challenging prob-lem, and even with sophisticated machine learning techniques produce unsatisfying results [Truong et al. 2013]. Therefore, we implemented a simple prediction method, which uses the previous day’s consumption as a prediction for the next day’s consump-tion. As detailed in Section 4.3.1, users can manually provide the agent with a more accurate prediction of their consumption for the following day through the web inter-face.
To simulate the availability of wind generation, we collected wind data from a weather forecast service for 28 days from regions where wind turbines are located in the UK. We collected the actual and predicted wind energy values, which are then calibrated for individual users, based on their average daily consumption. This cali-bration is important because each individual user of Tariff Agent may have different daily electricity consumption levels, so we need to calibrate the wind energy values to ensure users’ consumption may, at times, be higher than the available wind energy, and, at other times, be within the available wind energy. Our aim is to introduce uncer-tainty in the system, so that the agent would at times provide correct suggestions, but at times incorrect ones because of incorrect wind predictions and mismatch between available wind energy and users’ consumption. Essentially we shift the wind probabil-ity distribution so its average and range roughly match the probabilprobabil-ity distribution of the energy consumption of each participant.
Even though realised and predicted wind energy values are stored on the same plat-form, the realised values are never passed on to the tariff switching algorithm used by Tariff Agent. To select or suggest an energy tariff, the agent first computes the predicted day-ahead costs for all tariffs by using the predicted user consumption and predicted wind energy for the next day, and then chooses the cheapest tariff. The re-alised wind energy values are then only used for calculating the daily cost at the end of each day, based on the user’s selected tariff and actual consumption.
4.3. Interaction Modalities of Tariff Agent
Interactions between users and our system ocur through two mediums: they can inter-act with the system either through SMS or through a web site. The site includes two pages: home and details, which are described in what follows.
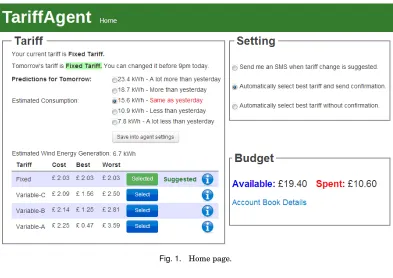
4.3.1. Home Page. The home page, illustrated in Figure 1, comprises three compo-nents: tariff, setting and budget. Through the Tariff component users can see the current tariff and manually select the tariff for the next day. The current tariff is dis-played on the top, highlighted in green if it is the same as the one the system suggested, otherwise in orange, to emphasise the difference.
In the middle of the component, the predicted values for the user’s consumption and wind generation on the next day are shown. Below the predictions, the four tariffs are listed, from the one predicted to be the cheapest to the most expensive. The suggested tariff (the cheapest) is marked as such through a text label. Users can select a tariff through a button and they can bring up a detailed description of each tariff, including the rates, by clicking on the ‘information icon’ next to it.
The predicted amount of energy consumption can be modified through radio buttons. Changes in the consumption prediction are immediately reflected in the estimated costs for each tariff. The manually selected prediction can be confirmed, or “saved”, to the system by clicking a button. By so doing, users can understand how the system uses their predicted consumption to make a better choice on their behalf and therefore inspire confidence in the system.
Fig. 1. Home page.
— Suggestion-only: If the system detects that the current tariff is different from the one predicted to be the best for the next day, it sends an SMS suggesting a tariff change. Users can accept the suggestion by replying “Yes” via SMS.
— Semi-autonomous: The system automatically switches to the predicted best tariff and informs users of the change via SMS. If the users are not happy with the change they can go to the website and manually change the tariff there. This level is semi-autonomous in that it automatically switches tariffs, but it allows users to easily regain control.
— Fully autonomous: The system automatically switches to the predicted best tariff but does not inform the user of the change. This level is fully autonomous in that it completely offloads users of the burden of tariff switching.
The users who have selected either the semi-autonomous or fully autonomous option could access the website and modify the predicted consumption, which will automati-cally affect the system’s selection of tariff. To select a tariff manually, the users need to change their setting to suggestion-only autonomy level.
The last component on the home page is theBudget, which displays how much was spent and how much remains of the budget allocated at the beginning of the study. It also provides a link to the other web page of the system, which is described in the next subsection.
[image:8.612.112.505.90.368.2]Fig. 2. Details page.
To facilitate the understanding of the information displayed, values in the table are colour-coded. Tariffs are displayed in green or red depending on whether the selection was optimal or sub-optimal. Consumption and wind generation predictions are shown in green when they turned out to be accurate (within 10%) and the resulting tariff suggestion is optimal. They are shown in red when they are inaccurate (outside 10%) compared to the realised values and the resulting tariff suggestion is suboptimal. They are shown in orange if the predictions are off (outside 10%), but the resulting tariff suggestion was optimal (for example in the case that one error compensated for the other).
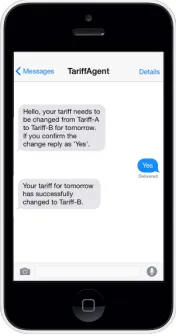
4.3.3. System Initiated Interactions via SMS.The system can send three different types of notifications via SMS: reports, suggestions and confirmations. Reports provide infor-mation on how much energy was consumed, how much the cost was, which tariff was selected, and how much was saved or lost (compared to the optimal or the worst tariff). Reports were sent every day to all users regardless of their setting. An example report is: “Hello, yesterday your tariff was Tariff-A, your consumption was 4.4 kWh and it cost you 0.69 pound. You saved 1.30 pound with Tariff-A.” The system sends sugges-tions to users who are on suggestion-only setting, when their tariff for the next day is predicted not to be optimal, for example: “Hello, your tariff needs to be changed from Tariff-A to Tariff-B for tomorrow. If you confirm the change please reply as ‘Yes’. ”
Saving assumptions are only presented in the web UI for brevity, rather than in the SMS. Confirmation messages are sent only to users on semi-autonomous setting to
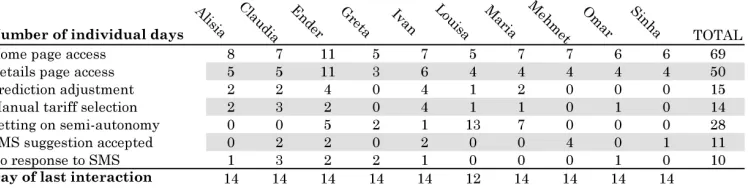
[image:9.612.352.440.475.643.2]Fig. 4. Overview of user activities. The rows listed under each user represent the total number of individual days that the user performed each activity. The last row shows the last day of user interaction.
inform them of an automatic tariff switch, such as: “Hello, I switched your tariff from Tariff-A to Tariff-B for tomorrow.”
4.4. Findings
We report findings from the semi-structured interviews through thematic analysis [Braun and Clarke 2006]. The interviews were documented through audio recording (later fully transcribed) and notes; analysis started by categorising the material at the sentence level through open codes. The codes were assigned to commonly recurring themes, significant events or references. The coding was performed by two researchers. Initially 88 open codes were used, which are later grouped in four broader categories that we discuss in what follows5. We also present information on system usage based on automatic interaction logs.
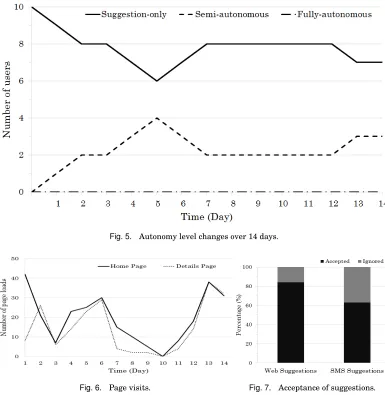
4.4.1. Engagement. The summary of user activities throughout the study is displayed in Figure 4. Participants accessed the web interface on average every 2.2 days, with some participants accessing it almost daily and some as infrequently as once every 5 days. The home page was loaded more frequently, with 277 page loads over the course of the study, while the details page was loaded overall 210 times, still accounting for approximately 43% of the total page views (Figure 6).
The default autonomy level at the beginning of the trial for all participants was suggestion-only, where the system sends SMS suggestions about tariff switching but it does not automatically switch. This default option was chosen because it is the one that requires the most interaction from users, so we wanted to see whether they would change to a less demanding one over time. Half of the participants modified the set-tings to semi-autonomy, where the system automatically changes to the predicted best tariff and informs the user of the change via SMS. The semi-autonomous setting was kept for a maximum of 14 days, and 29 days in total across all the participants who used it (i.e., 5.8 days per participant on average). The remaining half kept using the default suggestion-only setting. No one selected the fully autonomous setting (where the system changes the tariff without informing the user). We report in Figure 5 for how the number of users keeping different autonomy levels varied over the course of the study.
In terms of tariff selection, two participants never received switching suggestions be-cause they happened to be already on an optimal tariff. For the remaining eight partic-ipants who received tariff switching suggestions from the system (while on suggestion-only setting), five participants accepted them by replying ‘Yes’ via SMS at least once, the other three participants never accepted any tariff switching suggestion and stayed
[image:10.612.125.499.95.190.2]Fig. 5. Autonomy level changes over 14 days.
Fig. 6. Page visits. Fig. 7. Acceptance of suggestions.
on the fixed tariff during the whole study. Overall, 15 suggestions were sent from the system to the users, with a 66% acceptance rate (Figure 7). All 5 participants who used the semi-autonomous setting took advantage of the web UI to provide manual estimates of their electricity consumption prediction for the following day. In total this explicit input was provided 26 times during the study.
All participants stated that they checked their budget on the website with some reg-ularity during the study, demonstrating that all participants cared about the reward. However, most of them reported that they more frequently kept track of their budget through SMS summary reports, as these reported the daily expenditure. Overall our participants spent £134.50 over the entire study, and they were rewarded a total of
£165.50, corresponding to an average of£16.55 per participant (SD:£4.20).
[image:11.612.112.497.93.488.2]example, Maria said, “I like more to have an SMS than to login to the [web] page.” The amount of information provided in the SMS messages was reported to be concise and satisfactory. For instance, Ivan said, “It would be more confusing. I mean if I need more information to make a decision I would open the web site. [...] So, no, I think more information would be more confusing.”, when we asked him if there was more information required in the messages. Some participants commented that they would opt for less frequent (e.g., weekly) summary messages if they had to use the system longer term:
Analyst - “What did you like the most and least about the system?”
Greta - “I think it is quite easy to understand, but after a while I would probably want the text messages to be less frequent. I would probably want to get updates every sort of a week maybe.”
4.4.2. Perception. Despite the limited duration of the study, the system appeared to be simple enough for some participants to develop sophisticated explanations about how the system and tariffs work, which were very close to the actual implementation.
Analyst - “What do you think the system does for you?”
Alisa - “Given a forecast of certain level of consumption which I tell to the system, it will select the best tariff, once it has selected the best tariff if I agree with that after counting the wind speed so splitting the cost in two parts. The one that is covered by the wind energy, once this part is consumed it will cost me the rest of the amount. I do not know if I explained it well. So in my mind, I thought like the actual amount of energy I have consumed there will be one part, which will be covered by the wind energy, and the rest of the energy will be paid by me.”
However, some participants had difficulties in understanding how the cost was cal-culated in the system. They referred only to the effect of their electricity consumption, leaving out the availability of wind energy.
Claudia - “It tracks how much electricity we use during a day and then suggests whether I should keep that tariff for the next day, or change to a different tariff. I guess it is sort of trying to see a pattern, every day we use a similar amount. I imagine it goes on the day before more. I do not know because I do not see how it suggested moving [to another tariff] on some days. Why did it suggest it, because it [the consumption] is not like being huge dramatically different each day?”
Some participants described the variable tariffs as risky since their rates can vary depending on consumption and available wind energy, whereas they are always charged at the same rate with a fixed tariff. In other words, with variable tariffs, they could end up paying more than what they were expecting (for a fixed amount of con-sumption), because of the wind energy that they have no control over. This appeared to be the main reason why three of the participants stayed on a fixed tariff for the entire duration of the study. In the interviews some of the participants reported being aware of the opportunity that they could save money by switching to the variable tariffs, but preferred avoiding risk.
environ-mentally friendly resources as wind energy is always good.” when we asked her why she mostly opted for the variable tariffs.
All participants commented that the system was functioning well and they all de-clared that they perceived the system to be working in their favour. In addition to being beneficial for the end users, some participants suggested that the system also works in favour of the energy provider as well as of the environment. Participants mostly found the system easy to use. For instance, Greta told us how it was easy for her to manage the tariffs even though she did not have any experience before.
Greta - “In terms of the online website, it is quite clear for me and also it shows you the budget. I think the quite good thing about the system is that you are updated through messages and you can sort of control the usage of tariffs as a person who has very little experience of dealing with electricity.”
The colouring of the history data in the detail page was not successful. Most of the participants had difficulty in remembering their meaning.
4.4.3. Adoption.Participants commented that the system reduces the hassle of dealing with tariffs and saves time and money. Being busy with travelling or other daily tasks was reported as a reason to select the semi-autonomous setting.
Analyst - “Why did you select the second setting (semi-autonomous)?”
Louisa - “I am very busy. I did not want one more task on my mind and I do prefer the confirmation by text because this way I know and I feel in control actually.”
However, even though participants appreciated the system autonomy, they were still keen to be aware of any possible automatic change. Therefore, all of the partic-ipants who delegated the system to automatically switch their tariff preferred using the semi-autonomous setting, where confirmation is sent via SMS (as opposite to fully-autonomous setting where no confirmation is sent).
Analyst - “Why didnt you ever use the third setting (fully autonomous)?”
Greta - “I want to basically know what is happening. I used the automat-ically select the best tariff and send me confirmation because if something changes I would like to know about it.”
It is also interesting to note that the benefit provided by the system is often described in terms of offering control, even though autonomy is one of the major features of Tariff Agent, which was acknowledged by participants. For example, Louisa said, “[it] gives
me [an] opportunity to save money, really, becauseI can change the tariff andI can
predict for next day” (our emphasis). Through this quote we can see that Luisa, who mostly used the system in automatic mode, refers to herself, rather than the system, being in charge of switching tariff and achieving the savings.
In addition to the tariff selection, energy consumption is what participants have control over (while they have no control over wind energy generation). So the risk related to a variable tariff was sometimes associated to plans of carrying out energy-intensive activities, such as laundry.
Analyst - “How did you decide which tariff is the best option for you?”
The participants who switched tariffs (either manually or automatically through the system) reported that they developed strategies to cope with the uncertainty of the wind and consumption. These were mostly based on planning future activities, and then taking advantage of the option to input their consumption prediction to inform the tariff selection by the autonomous system.
Analyst - “How did you use the button called ‘save into agent?”
Maria - “This weekend was obvious because I was not here. So I decided to change the consumption prediction to be much less. Also I changed it on Friday, because on Saturday I use more energy usually than during the weekdays, because it is the day that I put on the washing machine and I stay more hours at home.”
During these days Maria kept the system setting to automatically switch tariff, so this quote demonstrates that taking advantage of system autonomy is not at odds with staying in control.
In the interviews, we received comments on how sometimes it could be difficult to predict the next day’s consumption, especially in a shared house.
Analyst - “Do you think the system worked well as it was intended?”
Alisa - “It [the system] would be very much useful for a household in which you can really make reliable forecast because for instance two days ago here there was a party of washing machine use. So you cannot play with saving into system setting, because it depends on other people’s decisions.”
Here Alisa highlights the challenge of using automatic predictions, or even manual predictions, given that household activities can sometimes happen in an unplanned fashion. The party of washing machine use that she mentions in this case refers to a day where her flatmates ran several laundry loads.
Some participants reported that receiving tariff switch confirmations from the sys-tem also reminded them to monitor the consumption prediction made by the syssys-tem. For instance, Maria told us, “The best setting is the second one. The system selects the tariff automatically and sends me the confirmation that is it. Also, sending me confir-mation reminds me to check if I will have a different consumption.” In contrast, others told us they did not often need to monitor the predictions as their consumption was more or less constant, for example Louisa said: “I just left it on automatic. I cannot say I was using it everyday because my consumption was kind of same.” This quote suggests that, in this case, the system autonomy was accepted, perhaps, because the prediction was particularly easy.
4.4.4. Accountability.All participants stated that they do not trust energy companies. Having bad experience with energy bills or hearing about companies in the media ap-pear to be the main reasons of distrust. Moreover, the abstruseness of energy contracts and energy bills increase the distrust of consumers towards energy companies.
On the other hand, all participants liked Tariff Agent, appreciated being able to change their tariffs more flexibly and having more transparency in their consump-tion and cost, therefore, found the system more reliable than what utility companies provide now.
It was interesting to note that most of the participants felt that Tariff Agent offers more control, although the system works with a certain level of autonomy. This feeling of control seemed to increase the user trust towards the system.
Correct suggestions or tariff changes made autonomously seem to intrinsically im-prove the trust towards the system. For instance, Ender reported how a correct sug-gestion encouraged him to trust the system more for his future decisions: “It suggested me fixed tariff and I did not want to choose that and I lost money. In that case I learnt that I should trust the system.” Likewise, Alisa’s comment also suggests how the sys-tem accuracy plays a significant role in terms of trust: “I received the messages and the system actually was selecting for me the proper option, this is for sure. My tariff was always the best one, I saw it and I was happy about it.”
However, Tariff Agent was deliberately designed not to select the correct tariff all the time in order to elicit users’ reactions to an autonomous system that can negatively affect their budget. It was interesting to note that participants always referred to the system with tolerance when we asked how they felt about incorrect suggestions and selections in the interviews.
4.5. Summary and Implications
In the first study, it was interesting to note how different participants reacted to dif-ferent autonomy levels, and appreciated automated SMS reminders and recommenda-tions. Participants’ reports of their study experiences suggested that they felt more in control, engaged well with the system, and they were broadly tolerant to the system’s autonomous operations. This was particularly interesting since tariffs were confus-ing (i.e., wind-based tariffs added external uncertainty) and autonomous systems are generally mistrusted. This first study showed us that some participants willingly del-egated their tariff decision to an autonomous system, but that they were still keen to monitor its operations and to intervene in the system when they believe it is necessary for improving its decisions.
However, the study was limited to two weeks. Even though the findings reveal that this two weeks was sufficient for participants to experience the system, form opinions about it and develop strategies to integrate the autonomous tariff switching in their everyday practices; the question naturally emerged whether the findings would also hold in a longer deployment period. In particular, was the user “tolerance” of the sys-tem’s autonomy and at times inaccuracies due to the scale of the study? Would users give the system more autonomy if they are satisfied with the performance of the sys-tem, or withdraw it entirely if they are not, as time passes? In fact, some participants reported that they might opt for the fully autonomous setting or would like to receive SMS reports less frequently, if the study was longer.
One common method for grounding the implications of a field study is to run a new study by utilising what have learnt in the previous one [Sas et al. 2014]. Therefore, we decided to run a new longer field study to explore the questions stated above, af-ter implementing some design changes for improving the first prototype based on the implications of the first study.
5. THE SECOND STUDY
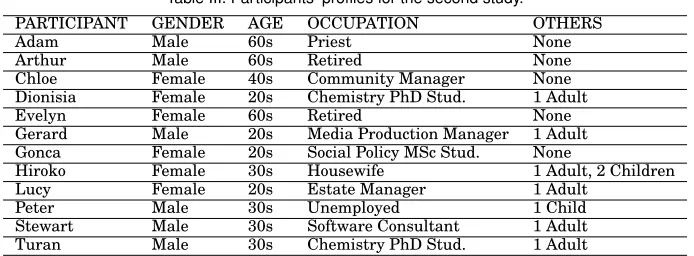
The second field study aimed to explore users’ longer term interactions with a tariff switching system. To recruit participants a similar approach was followed as for the first field study, however with an aim to have a broader sample of the population. Overall, 12 participants (6 female) were recruited to cover a range of lifestyles, as detailed in Table III.
Table III. Participants’ profiles for the second study.
PARTICIPANT GENDER AGE OCCUPATION OTHERS
Adam Male 60s Priest None
Arthur Male 60s Retired None
Chloe Female 40s Community Manager None
Dionisia Female 20s Chemistry PhD Stud. 1 Adult
Evelyn Female 60s Retired None
Gerard Male 20s Media Production Manager 1 Adult Gonca Female 20s Social Policy MSc Stud. None
Hiroko Female 30s Housewife 1 Adult, 2 Children
Lucy Female 20s Estate Manager 1 Adult
Peter Male 30s Unemployed 1 Child
Stewart Male 30s Software Consultant 1 Adult
Turan Male 30s Chemistry PhD Stud. 1 Adult
a period of 6 weeks (42 days). At the beginning of the study, all participants were allocated a budget of £80, and their daily consumption cost was reduced from this budget over the period of the trial.
5.1. Implemented Changes
During the interviews of the first study, we observed that some participants perceived wind-based tariffs as more environmentally friendly. This perception influenced their reactions to the tariff suggestions that were automatically sent by the system, and led them to ignore the suggestion and stick to the same tariff that was not always the cheapest. Therefore, we removed the emphasis on renewable energy and external uncertainty to more distinctly focus on issues of users’ orientation to smart systems. Similarly to real-world tariffs, the tariffs we use in the second field study are defined in terms of: a standing charge that is a fixed amount charged daily for service cost; and a unit rate that is the price of electricity per kWh. In particular, each tariff represents the best value for a particular consumption range so that it is not easy to decide which tariff is the cheapest as it may change every day unless the user is able to accurately predict her own consumption.
In the first study, the system was designed to send a daily report to all users regard-less of their settings and the users were not able to deactivate or reduce the frequency of these reports. In the interviews some users commented that they could opt for a less frequent summary messages, for example weekly, if the study was longer. Therefore, we decided to alter the design and enable users to change the frequency of reports. To do so, we added another component to the home page, called Reports (see Figure 8). This component enables users to decide how often they want to receive an SMS report, where the option every day is initially selected by default. The other options are: every 3 days, every 5 days and every week.
Furthermore, in the home page we added explanatory information tips to help users to understand and remember the basic underpinnings of the system, for example what the functionality of ‘Tell the Agent’ button is, how the estimated cost is calculated, and what information the SMS reports include.
Fig. 8. New home page.
5.2. Findings
Similar to the first study, we used thematic analysis [Braun and Clarke 2006] for the semi-structured exit interviews. The same two researchers performed the coding.
[image:17.612.113.501.85.375.2] [image:17.612.110.506.447.624.2]Fig. 10. Overview of user activities. The rows listed under each user represent the total number of individ-ual days that the user performed each activity. The last row shows the last day of user interaction.
tially 76 open codes were used, which are later grouped in four broader categories that we discuss in what follows. We also present information on system usage based on automatic interaction logs.
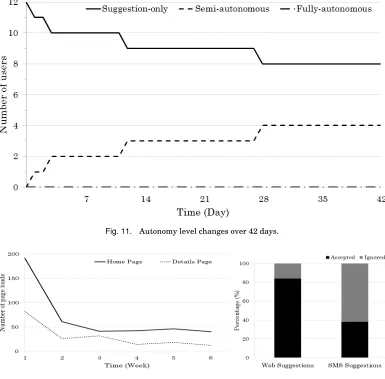
5.2.1. Engagement. The summary of user activities throughout the study is displayed in Figure 10. Participants accessed the home page more frequently, with 420 page loads over the course of the study, while the details page was loaded overall 184 times, still accounting for approximately 30% of the total page views. Figure 12 shows that the interactions of users with the web site drastically dropped after the first week, yet were maintained at a significant level by each user till the end of the study. Everyone either accessed the web interface or replied to SMS suggestions with some regularity that is on average at least once every 2.5 days (SD: 1.3 days).
Similar to the first study, the default autonomy level at the beginning of the trial was suggestion-only for all participants. Four of the participants modified the autonomy level to the semi-autonomous option, where the system automatically changes to the predicted best tariff and informs the user of the change via SMS. The remaining eight users kept using the default autonomy level. No one selected full autonomy (where the system changes the tariff without informing the user). We report in Figure 11 for how the number of users of each autonomy level varied over the course of the study.
In terms of tariff selection, the system’s predictions of the optimal tariff were correct on average 65% of the time (SD:12.3%); for reference users’ actual selections through-out the study (a combination of automatic and manual) corresponded to the optimal tariff 61% of the time (SD:15.4%). Overall 10 participants received SMS tariff switch-ing suggestions from the system (while on the suggestion-only settswitch-ing). The other two participants did not receive any tariff change suggestions, as one was not using his mobile phone and the other one switched to an automatic tariff change setting after the first few days. Eight participants accepted the suggestions by replying ‘Yes’ via SMS at least once, the other two participants never accepted any tariff switching sug-gestions but changed their tariff manually on the website at least once. In total 139 SMS suggestions were sent from the system to the users, with a 38% acceptance rate. Additionally, 59 times users changed their tariffs manually from the website and in 49 cases they accepted the system’s suggestion (see Figure 13). In these cases an SMS was not sent because the suggestion was accepted early in the day, via the web UI.
All users except one took advantage of the web UI to provide manual estimates of their electricity consumption prediction for the following day at least once. In total this explicit input was provided 110 times during the study, and resulted in 85 correct tariff selections. The one person who did not use the input feature turned out to have a very regular consumption profile throughout the entire duration of the study.
Fig. 11. Autonomy level changes over 42 days.
Fig. 12. Page visits. Fig. 13. Acceptance of suggestions.
reward. Overall our participants spent£440 over the entire study, and were rewarded a total of£520, corresponding to an average of£43.30 per participant (SD:£14.67).
All participants commented that the system was functioning well and that they found it easy to use. The following quote is representative of the sort of reactions we recorded: “I think it was easy to use. It was really simple, a few buttons to click, and if it needs to change the tariff, hmm getting the text alerts I quite liked.” (Peter). The quote demonstrates also the participants’ general appreciation for the SMS notifica-tions. We were often told that they serve as reminders and as an easier way to access the system, compared to visiting the website.
The value of SMS reports and notifications was emphasised by one participants who did not have a mobile phone during the study: “I do not have a mobile phone, so the text message was coming through on my landline [through a text-to-speech service]. It could have been clearer by an email; I look at emails every day so there is no problem there. So for me, that would have been an improvement on how it worked.” (Arthur). The suggestion to use email as an alternative to SMS indicates that Arthur felt the lack of notifications and reminders, even though he was a very active user of the web UI (he manually changed tariff on 17 days and adjusted the consumption prediction on 16 days).
5.2.2. Perception. Some of the interview questions were aimed at assessing partici-pants’ perception of the system. Most participants appeared to hold a mental model that mirrors quite closely the actual design and implementation of Tariff Agent, ex-cept for the consumption prediction as detailed below. For example, Gerard eloquently described: “It looks at what usage you think you are going to be using in the next day, which is something you either tell it or it just guesses itself, and then it looks at vari-ous tariffs based on the standing costs and the per unit costs, and works out which one is going to be the cheapest.”, or more concisely Hiroko told us: “It decides the tariff and recommends me the tariff.”
However, for some other participants the initial response to the question of “what the system does” instead highlighted energy monitoring and awareness. Peter told us: “Well it just helps me to monitor my energy usage, it would help me definitely bring my bills down. That’s what I was hoping it would do, anyway. That’s what it seems to do. It definitely helped me be more careful with my energy usage.”
Indeed, some participants reported that such awareness led them to change their energy consumption habits, for example switching off devices that used to be left on or in stand-by.
Analyst - “Have you changed anything related to your energy consumption?”
Lucy - “I used to leave the telly on for my dog during the day but I do not do that anymore. He sits in silence now. It is just as I said probably made me aware how much electric I actually use whereas before I just used to put 10 pound a week electric and just done with it. Now I am thinking actually seeing where things going. So it has made me changing definitely.”
Through the interviews we could also notice that some participants had a quite de-tailed model of how energy tariffs work.
Analyst - “How do you think your daily energy cost is calculated?”
Chloe - “I reasonably understand that yeah, higher standing charges for higher tariffs, but because my unit rate is low then I am better of having either Tariff-A or Tariff-B with the lowest standing charge.”
Our scenario, where the tariff can be switched everyday, was considered by some as a key feature that is part of Tariff Agent.
Analyst - “What did you like the most about the system?”
Arthur - “I did like the different choices. It was quite interesting having some, quite variation on unit rate and standing charge can compare how they would produce the actual cost.”
personally prefer the government or an independent organisation to provide the sys-tem. For example, “Ideally, somebody who has got no vested interest in what tariff it is.” (Evelyn). Or, “I could not image this implemented by anybody other than power companies realistically. But I personally prefer government.” (Gerard)
5.2.3. Adoption.The interviews revealed a range of attitudes and orientations towards the autonomy of the system, which showed similarities to the ones that we observed in the first study. Being busy with travelling or other daily tasks, and feeling lazy were reported as reasons to select the semi-autonomous setting, for example, “I was logging in everyday and just looking at it and leaving it and to be honest towards the middle of it I kind of got a bit more lazy.” (Stewart)
Two of the participants who used the semi-autonomous setting reported to have al-ready been exposed to real-world systems that recommend changes of tariff via email, “I actually get an email from them if a cheaper tariff based on my last month usage is available. So if they find a tariff that would save me more than£50 a year I get an email.” (Gerard)
Another participant highlighted the options offered by Tariff Agent in terms of au-tomation against manual intervention, and appreciated being able to shift between these multiple options.
Analyst - “Can you describe how you used the system?”
Adam - “I am very, very busy here within the parish. So I was fascinated by the way in which you have a multiple choice [setting]. You could either how to say look at it, examine each aspect and dimension of this program, or you could choose as I did after a day or so number 2 [semi-autonomy], and it would choose it automatically, and I found that great help as well.”
Along the same lines, participants generally considered the opportunity of providing input to the system as an advantage. This aspect was generally related to the fact that it would be impossible for an automatic system to predict correctly in case of exceptions in their daily routines, “I think the whole idea of the fact that you can have an input is the reason why I like it.” (Lucy), or “That is the point of the system, isn’t it really, that you monitor it and you go no hang on that is not quite right. So ultimately you have to be responsible for it. The control is still with user ultimately.” (Peter)
However, the input that users need to provide to the system was perceived as effort that needs to be put into using it. Some participants perceived it as light, “It does require you to do a bit of work, but I do not think it requires you to do an awful lot of work.” (Gerard), while others considered it hard, “OK but then that involves a lot more input from me to do the prediction for what tomorrow might be.” (Chloe). In some cases, the increased performance provided by the manual input was not considered to be worth the effort, compared to the performance that Tariff Agent would achieve on its own. “Every other day it gets it right, every other day it gets it wrong and then to be honest, I think I would probably make the same mistakes so and I am not going to login in every single day and change it because it is more effort than it is worth I guess in that case.” (Stewart)
As described in Subsection 4.2, Tariff Agent uses the previous day’s consumption to predict for the next day, and estimate the best tariff. Users have the option to adjust this prediction through the web UI. Indeed, most participants took advantage of this option and reported that they predicted the next day’s consumption mostly based on planning future activities such as doing laundry, being away from home, or hosting guests. Changes in personal plans were reported as an obstacle for providing input to the system: “I found it impossible to predict tomorrow because I might make plans to use washing machine or a cooker and then I didn’t do that.” (Evelyn)
On the other hand, another participant told us how she changed her plans to match the tariff selected by the system.
Gonca - “Sometimes I could not change the tariff when the system showed me like tomorrow my tariff will be changed to B, which was more than I consume normally, then I knew that ok today I will not do the laundry, for example, and I just waited to do the next day.”
In this case Gonca reported to have seen the system notification too late, after the 9pm deadline for tariff selection, so she changed her plans for the next day to follow the system schedule.
Some participants suggested that contextual factors specific to their circumstances influenced the accuracy of predictions. For example, Adam said, “This house unfor-tunately has so many visitors coming through that when the choice was made based on yesterday, I’d get a lot of unexpected visitors coming and really [laughing] test the patience of this program.” Similarly, Evelyn indicated that predicting could be even harder for low profile users since any appliance usage might cause peaks in the con-sumption: “In my case, my consumption is going to vary greatly from day to day, with a family that might be different.”
A number of participants reported that they were confused with the system being one day behind and one day ahead. For example, Peter said, “Sometimes it was diffi-cult. I get confused sometimes thinking about yesterday in relation to what energy I’d use tomorrow, but obviously that’s the only way you can do it, because yesterday you had the all-day consumption, so that was just me trying to get my head around it.”
We also recorded a number of comments related to the mechanics of the prediction system. While some users correctly understood the system to predict tomorrow’s con-sumption simply to be the same as yesterday’s concon-sumption, a number of other users expected the system’s prediction mechanism to be more sophisticated than it actually was. For instance, Arthur told us that the system was learning his consumption: “The pattern that has been build up over the previous days or weeks. Of course for the longer period, then hopefully it would get to know how my energy usage comes out in regular basis.” The same participant also commented that the system may help him to improve his predictions over time: “It would also, perhaps, get me to estimate better what my consumption is going to be so I think I would learn as I went along more how to estimate the consumption.”
In the same vein, talking about how the system predicts her consumption for the fol-lowing day, Lucy explained: “Probably what I have used on the same day, or I suppose as it goes on longer, you get more data so you got more of an idea of what we do use and what we don’t use. So I think probably as time got on it was more accurate than it was initially ’cause you collect more data.” Others were uncertain about the matter: “I don’t know. I was wondering how smart it was, whether it looks at previous weeks, days of the week.” (Gerard)
and most of them stated that they trust the system’s tariff decisions. However, the participants of the second study were more aware of the system’s imperfection, most probably due to a longer duration of the study.
Interestingly, when we asked about experienced mistakes in tariff suggestions or selections, they mostly considered it to be their own responsibility, “It is my mistake because I have not informed the system of something that I knew would change what consumption I used.” (Lucy), or, “it is connected to the individuals and requires individ-ual responsibility to make the system in the savings work, it sort of gives responsibility back to the energy user.” (Chloe) In an even more drastic way Gerard said, “I think it was always my fault. So I just felt annoyed with myself and I started trusting the ma-chine more than I trusted myself, I was like oh the mama-chine knows what it is doing, just leave it alone.”
Talking about mistakes the system may commit, Arthur highlighted the importance of receiving immediate feedback in order to maintain trust, “I would not worry as long as I got the message straight away to say our suggestion yesterday was erroneous.”
6. DISCUSSION
In our two field studies we exposed two diverse groups of participants to an envisioned future energy scenario, in which autonomous systems embedded in households have the ability to switch the energy tariff based on the offered rates and a prediction of the user’s consumption. However, to reveal meaningful results from such studies it is essential that participants feel and engage with the scenario. Therefore, to render the scenario tangible for our participants, we combined a financial experimental reward with actual energy consumption data measured in participants’ homes. Both user in-teraction logs and the accounts offered in the interviews about system usage suggest that the study design was successful in making the scenario visible and tangible, echo-ing recent findecho-ings from the literature [Costanza et al. 2014].
6.1. Interaction with Autonomy
One aim of our research was to explore how users would perceive an autonomous sys-tem affecting them financially and possibly intruding into their daily routines. The results of the first and the second study suggest that participants kept a strong feeling of control over the autonomous system and they appear to understand and appreci-ate the autonomous nature of Tariff Agent, which proactively sends users suggestions about switching energy tariffs. In particular, this is well demonstrated by the general and prolonged engagement that most participants of the both studies had in switching tariffs and in providing input to the system to improve its consumption forecast perfor-mance, and hence the quality of the suggestions. Additionally, none of the participants reported that they found the SMS tariff switching prompts bothersome, supporting the findings of other recent work [Bourgeois et al. 2014]. Also, as suggested by some participants of the first study, we implemented the second prototype to enable users to change the frequency of summary reports sent daily by the system. However, no participants changed the frequency of the reports and all kept it at daily option, since they found the SMS reports informative and useful.
around participants’ orientation to autonomy. In other words, the decision of balancing control and autonomy should be left to users where appropriate to cater for individual differences in what levels of system autonomy people are comfortable with. In so doing, users may continue to make use of relevant parts of the system autonomy, rather than taking over full control or abandoning the whole technology [Yang et al. 2014]. Our re-sults suggest that flexible autonomy shows promise for sustaining users’ engagement with an autonomous system, despite its occasional mistakes.
For both studies, the interviews revealed that all participants maintained a strong feeling of control over the system. It is worth emphasizing that the duration of the trial and the presence or absence of renewable energy do not seem to influence this finding. This result becomes more interesting when we consider that existing literature sug-gested that autonomous technologies leave users feeling out of control [Barkhuus and Dey 2003], and that in our application even with the lowest autonomous level (i.e., suggestion-only) the system was continuously monitoring users’ consumption and au-tomatically suggesting tariff changes. Such a feeling of control seems to be boosted by the awareness that the autonomy level can be changed at any time, that input about their own consumption predictions can be provided to the system to help it make bet-ter decisions, and that they are able to easily monitor the performance of the system. This is particularly shown by the participants, with most feeling that incorrect tariff decisions would be largely their responsibility. Recent work [Stout et al. 2014] sug-gested that delegation of autonomy is perceived by users as a means to shift blame from themselves to autonomous system for undesirable outcomes. In contrast, our re-sults show that the ability to delegate autonomy in aflexiblemanner ultimately leads users to feel in control and therefore responsible.
Such a result may be, in part, due to domestic energy consumption being perceived as a very personal matter, over which an automatic system has limited insight. Nev-ertheless, we believe this is an important finding, which suggests that flexible auton-omy may lead people to share the blame with the system and form more collaborative and long term relationship with it, rather than only blaming the system for incorrect actions and stop using it. This is also a promising finding for previous HCI studies [Strengers 2011; Darby 2006] that address the challenge of maintaining user interest and interaction with the eco-feedback systems. It looks like flexible autonomy could be useful to sustain user interaction and may help them to adapt new behaviours in longer run.
6.2. Orientation to Smart Systems
As detailed in our system description, we decided to implement a very simple consump-tion predicconsump-tion strategy in Tariff Agent because we expected it would make it easier for users to interpret the functionality of the system, while offering comparable accuracy to more complex alternatives. Namely, the system was simply using the previous day’s consumption as a prediction for the next day. Although this simple strategy is even indicated on the system’s home page, in both studies some participants perceived the system’s predictions to be smarter and more complex than they are in reality. They suggested that the system applies more advanced pattern recognition (e.g., days of the week) and even that it learned their usage habits, becoming more accurate over the duration of the study. Once again, this finding emerged irrespective of the duration of the study and the presence of wind-generated energy. This result resonates with the findings of Yang et al. [2014] around their study of a commercial smart thermostat: their participants overestimated the abilities of the product, for example in terms of learning when they are at home and when away, leading to some resource wastage.
having such features. This expectation, then, may be due to an ever-increasing ex-posure of the general public to advanced machine learning computer systems. Such exposure is sometimes direct (e.g., Internet search engines), or through media reports. An alternative explanation may be related to our innate talent to learn over time. Per-haps participants expected Tariff Agent to learn like a person would. Even though we carefully avoided any anthropomorphic feature, to avoid any emotional biases, the sys-tem, even by its name, is explicitly referred to as an “agent” which may create such expectations. We believe these results highlight an important implication for future research in interaction with “smart” systems: to try and discover the source of people’s learning expectations.
In the second study, participants comments around who would, or should, own the system if it was real further suggest that Tariff Agent seems to be perceived as more opaque than we had hoped for. Often the preference was for the ownership and oper-ation to lay with the government or with an independent body. We interpret this as an indication that participants are afraid that the performance of a system dealing with energy consumption, tariffs and billing, may be biased to favour the profits of an energy provider. The system is not perceived as a simple and neutral data processor, nobody answered to the ownership question saying that it does not matter. This find-ing resonates with those reported by Rodden et al. [2013], who exposed users to two different video scenarios where an autonomous system mediated energy and tariffs, and found that when the system was presented as being installed and owned by the energy supplier, reactions were much more critical than when it was presented as be-ing installed and owned by the householders themselves. The perceived opacity is at odds with the fact that, at the same time, our participants felt largely responsible for any losses incurred by incorrect tariff selections, rather than blaming the autonomous system. This apparent contrast can perhaps be explained in light of the fact that in our studies the system was clearly presented as developed and operated by a university, a type of organisation generally recognised as trustworthy.
6.3. Design Implications
Building on our two studies, we list design suggestions for the design of autonomous domestic energy systems, where the systems deal with financially sensitive tasks and may disrupt users’ daily activities. Even though these guidelines were originally and more comprehensively reported in [Alan et al. 2014] based only on the results from the first study, we briefly list them again here for completeness, and also because they were confirmed by the results of our longer second study.
—Provide an easy way for users to receive updates about the status and operation of the autonomous system, and allow users to change the frequency of the updates.
—Enable users to instruct the autonomous system by offering them opportunities to de-clare their plans and integrate these plans into the system’s operation.
—Leave the system open to transfer of control by allowing users to adjust the system’s level of autonomy (i.e., when to release or retain autonomy).