MORPHOMETRY OF THE BARAKAR RIVER BASIN, INDIA: A REMOTE
Centre of Advanced Study in Geology, Banaras Hindu University, Varanasi, India
ARTICLE INFO ABSTRACT
In the present paper an attempt is made to describing the regional topography
River Basin. For the above purpose, a detailed morphometric analysis of the river was carried out. Morphometric analysis was done using SRTM data with the help of ArcGIS
the basin is 3161.18 km
The drainage pattern of the study area is dendritic to sub dendritic with stream orders ranging from IV to V orders. Drainage density ranges from 0.30 to 0.37 per
from 3.63 to 5.32. The nature of the drainage pattern the terrain.
Copyright © 2015 Forouzin et al. This is an open access article distributed under the distribution, and reproduction in any medium, provided the original work is properly cited.
INTRODUCTION
Morphometric analysis is very useful tools to know about
drainage morphometry, depositional processes and
environments, and provenance of a river basin and its sediments. Morphometric analysis using remote sensing technique has emerged as a powerful tool in recent decades. This can provide synoptic view of the large area at one time and is very useful in analyzing the drainage morphometry
(Rudraiah et al., 2008). The Barakar River basin
of 3161.18 km2 withtwo sub-basins which range from 1891.46
km2 to 612.47 km2. In the present study morphometric analysis
on sub basin level using remote sensing and GIS was carried out. Barakar River is the most important and largest tributary of Damodar River in the eastern region of India. The River starts its journey from a place near Padma in the districts of Hazaribagh at Jharkhand and travels a distance of around 225 kilometers across the northern region of Chhota Nagpur Plateau from west to east direction. Thereafter, the Baraka River of Jharkhand, which is also known as Rujubalika, joins Damodar River near Dishergarh in the distr
in West Bengal state. The Barakar River flows across the districts of Hazaribagh, Dhanbad and Giridih at Jharkhand.
*Corresponding author: Kanhaiya, S.
Centre of Advanced Study in Geology, Banaras Hindu University, Varanasi, India-221005.
ISSN: 0975-833X
Article History:
Received 15th April, 2015 Received in revised form 20th May, 2015 Accepted 23ed June, 2015 Published online 28th July,2015
Key words:
Barakar River, Bifurcation Ratio, Drainage Pattern, Morphometric analysis.
Citation:Singh, S. andKanhaiya, S. 2015. “Morphometry of the Barakar River Basin, India:
International Journal of Current Research, 7, (7),
RESEARCH ARTICLE
MORPHOMETRY OF THE BARAKAR RIVER BASIN, INDIA: A REMOTE
SENSING AND GIS APPROACH
Singh, S. and
*
Kanhaiya, S.
Centre of Advanced Study in Geology, Banaras Hindu University, Varanasi, India
ABSTRACT
In the present paper an attempt is made to describing the regional topography
River Basin. For the above purpose, a detailed morphometric analysis of the river was carried out. Morphometric analysis was done using SRTM data with the help of ArcGIS
the basin is 3161.18 km2 withtwo sub-basins which range in area from 1891.46 km
The drainage pattern of the study area is dendritic to sub dendritic with stream orders ranging from IV to V orders. Drainage density ranges from 0.30 to 0.37 per km2
from 3.63 to 5.32. The nature of the drainage pattern indicates that the terrain.
is an open access article distributed under the Creative Commons Attribution License, which distribution, and reproduction in any medium, provided the original work is properly cited.
ul tools to know about
depositional processes and
environments, and provenance of a river basin and its . Morphometric analysis using remote sensing technique has emerged as a powerful tool in recent decades. This can provide synoptic view of the large area at one time and is very useful in analyzing the drainage morphometry Barakar River basin covers an area basins which range from 1891.46 . In the present study morphometric analysis level using remote sensing and GIS was carried is the most important and largest tributary of Damodar River in the eastern region of India. The River starts its journey from a place near Padma in the districts of and travels a distance of around 225 kilometers across the northern region of Chhota Nagpur irection. Thereafter, the Barakar River of Jharkhand, which is also known as Rujubalika, joins Damodar River near Dishergarh in the district of Burdhaman r River flows across the districts of Hazaribagh, Dhanbad and Giridih at Jharkhand.
Centre of Advanced Study in Geology, Banaras Hindu University,
METHEDOLOGY AND ANALYTICAL
PROCEDURES
For morphometric analysis drainage map of the study area was prepared from SRTM DEM using ArcGIS10 (Fig.2) adopting the standard procedures (Band, 1986; Morris and Heerdegen, 1988; Gurnell and Montgomery, 1999; Maidment, 2002). The drainage network of the basin and the stream ordering was analysed as per Horton (1945), Strahler (1964), Verstappen (1983), Patton (1988), Ritter
(1999), Macka (2001), Reddy
(2004), Vittala et al. (2004, 2006), Mesa (2006) and Ozdemir
and Bird (2009). The formulae adopted for computation of morphometric parameters are given in T
RESULTS
The present study highlights the morphometric analysis o Barakar River basin involving GIS and other standard morphometric techniques. All the
the Barakar River basin are analy
Available online at http://www.journalcra.com
International Journal of Current Research
Vol. 7, Issue, 07, pp. 17948-17955, July, 2015
INTERNATIONAL
2015. “Morphometry of the Barakar River Basin, India: A Remote Sensing and GIS , 7, (7), 17948-17955.
z
MORPHOMETRY OF THE BARAKAR RIVER BASIN, INDIA: A REMOTE
Centre of Advanced Study in Geology, Banaras Hindu University, Varanasi, India-221005
In the present paper an attempt is made to describing the regional topography and drainage of Barakar River Basin. For the above purpose, a detailed morphometric analysis of the river was carried out. Morphometric analysis was done using SRTM data with the help of ArcGIS-10 software. The area of basins which range in area from 1891.46 km2 to 612.47km2. The drainage pattern of the study area is dendritic to sub dendritic with stream orders ranging from IV
2
, while the bifurcation ratio ranges that the river follows the initial slope of
ribution License, which permits unrestricted use,
METHEDOLOGY AND ANALYTICAL
For morphometric analysis drainage map of the study area was prepared from SRTM DEM using ArcGIS10 (Fig.2) adopting the standard procedures (Band, 1986; Morris and Heerdegen, ery, 1999; Maidment, 2002). The drainage network of the basin and the stream ordering was analysed as per Horton (1945), Strahler (1964), Verstappen (1988), Ritter et al. (1995), Biswas et al.
(1999), Macka (2001), Reddy et al. (2004), Sreedevi et al.
(2004, 2006), Mesa (2006) and Ozdemir and Bird (2009). The formulae adopted for computation of morphometric parameters are given in Table 1.
The present study highlights the morphometric analysis of the iver basin involving GIS and other standard All the morphometric parameters of are analysed and presented in Table 2.
INTERNATIONAL JOURNAL OF CURRENT RESEARCH
Fig.1. Satellite map of Barakar River Basin
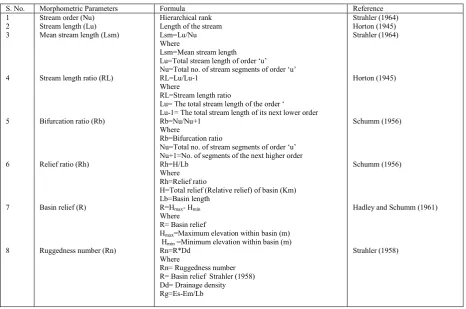
Table 1. Formulae adopted for computation of morphometric parameters of Barakar River
S. No. Morphometric Parameters Formula Reference
1 2 3
4
5
6
7
8
Stream order (Nu) Stream length (Lu) Mean stream length (Lsm)
Stream length ratio (RL)
Bifurcation ratio (Rb)
Relief ratio (Rh)
Basin relief (R)
Ruggedness number (Rn)
Hierarchical rank Length of the stream Lsm=Lu/Nu Where
Lsm=Mean stream length Lu=Total stream length of order ‘u’ Nu=Total no. of stream segments of order ‘u’ RL=Lu/Lu-1
Where
RL=Stream length ratio
Lu= The total stream length of the order ‘
Lu-1= The total stream length of its next lower order Rb=Nu/Nu+1
Where
Rb=Bifurcation ratio
Nu=Total no. of stream segments of order ‘u’ Nu+1=No. of segments of the next higher order Rh=H/Lb
Where Rh=Relief ratio
H=Total relief (Relative relief) of basin (Km) Lb=Basin length
R=Hmax- Hmin Where R= Basin relief
Hmax=Maximum elevation within basin (m) Hmin =Minimum elevation within basin (m) Rn=R*Dd
Where
Rn= Ruggedness number R= Basin relief Strahler (1958) Dd= Drainage density Rg=Es-Em/Lb
Strahler (1964) Horton (1945) Strahler (1964)
Horton (1945)
Schumm (1956)
Schumm (1956)
Hadley and Schumm (1961)
Strahler (1958)
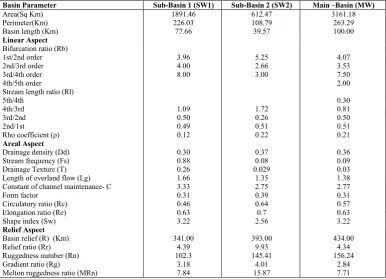
[image:2.595.67.534.469.778.2]17950 International Journal of Current Research, Vol. 7, Issue, 07, pp.17948-17955, July, 2015
9
10
11
12
13
14
15
16
17
Gradient ratio (Rg)
Molton ruggedness ratio (MRn
Drainage density (Dd)
Drainage Texture (Rt)
Stream frequency (Fs)
Form factor (Rf)
Elongation ratio (Re)
Circulatory ratio (Rc)
Length of overland flow (Lg)
Rg=Es-Em/Lb Where
Rg= Gradient ratio Es=Elevation at the source Em=Elevation at the mouth Lb=Basin length MRn=H-Hmin/A0.5 Where
MRn= Molton ruggedness ratio
H=Total relief (Relative relief) of basin (Km) Hmin =Minimum elevation within basin (m) A= Area of the basin (Km2)
Dd=Lu/A Where
Dd=Drainage density
Lu=Total stream length of all orders A=Area of the basin (Km2) Rt=Nu/P
Where
Rt=Drainage texture
Nu=Total no. of streams of all orders P=Perimeter (Km)
Fs=Nu/A Where
Fs=Stream frequency
Nu= Total no. of streams of all orders) A= Area of the basin (Km2) Rf =A/Lb2
Where Rf =Form factor A=Area of the basin (Km2) Lb2=Square of basin length Re=2√ (A/Pi)/Lb Where
Re=Elongation ratio A=Area of the basin (Km2)) Pi=‘Pi’ value i.e., 3.14 Lb=Basin length Rc=4*Pi*A/P2 Where
Rc=Circulatory ratio Pi=‘Pi’ value i.e., 3.14, A=Area of the basin (Km2) P2=Square of the perimeter (Km2) Lg=1/D*2
Where
Lg=Length of overland flow D=Drainage density
Sreedevi et al. (2004)
Melton (1965)
Horton (1932)
Horton (1945)
Horton (1932)
Horton (1932)
Schumm (1956
Miller (1953)
[image:3.595.110.497.513.792.2]Horton (1945)
Table 2. Morphometric Parameter of Barakar River
Basin Parameter Sub-Basin 1 (SW1) Sub-Basin 2 (SW2) Main –Basin (MW)
Area(Sq Km) 1891.46 612.47 3161.18
Perimeter(Km) 226.03 108.79 263.29
Basin length (Km) 77.66 39.57 100.00
Linear Aspect
Bifurcation ratio (Rb)
1st/2nd order 3.96 5.25 4.07
2nd/3rd order 4.00 2.66 3.53
3rd/4th order 8.00 3.00 7.50
4th/5th order 2.00
Stream length ratio (Rl)
5th/4th 0.30
4th/3rd 1.09 1.72 0.81
3rd/2nd 0.50 0.26 0.50
2nd/1st 0.49 0.51 0.51
Rho coefficient (ρ) 0.12 0.22 0.21
Areal Aspect
Drainage density (Dd) 0.30 0.37 0.36
Stream frequency (Fs) 0.88 0.08 0.09
Drainage Texture (T) 0.26 0.029 0.03
Length of overland flow (Lg) 1.66 1.35 1.38
Constant of channel maintenance- C 3.33 2.75 2.77
Form factor 0.31 0.39 0.31
Circulatory ratio (Rc) 0.46 0.64 0.57
Elongation ratio (Re) 0.63 0.7 0.63
Shape index (Sw) 3.22 2.56 3.22
Relief Aspect
Basin relief (R) (Km) 341.00 393.00 434.00
Relief ratio (Rr) 4.39 9.93 4.34
Ruggedness number (Rn) 102.3 145.41 156.24
Gradient ratio (Rg) 3.18 4.01 2.84
MORPHOMETRY
According to Clarke (1966), morphometry is the measurement and mathematical analysis of the configuration of the earth surface, shape and dimensions of its landforms. The morphometric analysis is carried out through measurement of linear, areal and relief aspect of the basin slope contribution (Nag and Chakraborty, 2003). The measurement of various morphometric parameters namely- stream order (Nu), stream length (Lu),mean stream length (Lsm),stream length ratio (Rl),bifurcation ratio(Rb),mean bifurcation ratio (Rbm), relief ratio (Rh),drainage density (D),stream frequency (Fs),drainage texture (Rt),form factor(Rf),circulatory ratio(Rc),elongation ratio (Re) and length of overland flow (Lg) has been carried out and the data are presented in Table 2.
Linear Aspect
The linear aspects include the stream order, stream length (Lu), mean stream length (Lsm), stream length ratio (RL), and bifurcation ratio (Rbm), which are determined and results have been presented in Table 2.
Stream order (Nu)
The designated stream order (Nu) is the first step in the drainage basin analysis. In the present study, ranking of the stream has been carried out following Strahler (1964). The order-wise stream numbers, area and stream length of the two sub-basins are given in Table 2. Both the sub-basins are of forth order while the main watershed is of fifth order Fig.2. It is also observed that there is a decrease in stream frequency as the stream order increases.
Stream length (Lu)
Stream length is measured from mouth of a river to drainage divide with the help of GIS software. This has been computed based on the technique proposed by Horton (1945). The length
of stream segments is maximum in first order streams and decreases as stream order increases in the present case
(Table 2).
Mean stream length (Lsm)
Mean stream length (Lsm) is a characteristic property related to the drainage network components and its associated basin surfaces (Strahler, 1964). This has been concluded by dividing the total stream length of order (u) by the number of streams of segments in the same order. All the values of mean stream length (Lsm) are presented in Table 2. It is seen that, mean stream length values exhibit variation from 2.6 to 36.59.In general, it is observed that Lsm values of both sub-basin indicate that Lsm of a given order is greater than the lower order and less than that of next order (Table 2).
Stream length ratio (RL)
Stream length ratio (RL) is the ratio of the mean length of the one order to the next lower order of the stream segments. All the values of stream length ratio (RL) are presented in Table 2.The steam length ratio between the streams of different order of the study area show a small change in each sub-basin.
Bifurcation ratio (Rbm)
According to Schumn (1956), the term bifurcation ratio (Rbm) may be defined as the ratio of the number of the stream segments of given order to the number of segments of the next higher orders.
Bifurcation ratio (Rbm) shows a small range variation for different regions or for different except where the powerful geological control dominates (Strahler, 1957). All the values of
bifurcation ratio (Rbm) are given in Table 2. The values are
decreasing in case of sub-basin 2 (SW2) where sub-basin 1(SW1) does not show any definite pattern from one to next order. These differences are depending upon the geological and lithological development of the drainage basin (Strahler, 1964). The Rbm values in the sub-basins of the study area range from 3.63 to 5.32.
Relief Aspect
Relief is the elevation difference between the highest and lowest point on the valley floor of the region. The relief measurements like relief ratio (Rr), basin relief (R), ruggedness
number (Rn), Gradient ratio (Rg) and Melton ruggedness
ratio (MRn) have been analyzed and the data are presented in Table 2.
Relief ratio (Rr)
The maximum relief to horizontal distance along the longest dimension of the basin parallel to the principle drainage line is termed as relief ratio (Schumm, 1956). Relief ratio has direct
relationship between the relief and channel gradient. The relief ratio normally increases with decreasing drainage area and size of the watersheds of a given drainage basin (Gottaschalk, 1964). In the study area, the values of relief ratio are ranging from 4.39 to 9.93 Table 2.
Basin relief (R)
Basin relief (R) is the difference in the elevation between the highest and the lowest point of the basin. The basin relief controls the stream gradient and therefore influences flood patterns and the amount of the sediment that can be transported (Hadley and Schumn, 1961).
Basin relief of the sub-basin one (SW1) and sub-basin two (SW2) is ranging between 341 km to 393 km where as basin relief of the main water body (MW) is 434 km.
All the relief values are given in Table 2 and the generalized relief map of the study area is shown in Fig.3.
Ruggedness number (Rn)
[image:5.595.70.530.210.558.2]The ruggedness number (Rn) is expressed as the product of the basin relief and drainage density (Strahler, 1958).The Rn value for main water body (MW) 156.24 and that of sub-basin 1
Fig.3. Elevation map of the study area
(SW1) and sub-basin 2 (SW2) are 102.3 and 145.41 respectively as given in Table 2.
Gradient ratio (Rg)
Gradient ratio (Rg) is an indicator of channel slope which
enables assessment of the runoff volume (Sreedevi et al.
2004). Main water body (MW) having Rg value 2.84 and that of all the sub-basin 1 (SW1) and sub-basin 2 (SW2) are 2.84 and 4.01 respectively as given in Table 2.
Melton ruggedness ratio (MRn)
The Melton ruggedness ratio (MRn) is a slope index that provides spatialized representation of relief ruggedness within the watershed (Melton, 1965). Main water body (MW) has an MRn of 7.71, while that of sub-watersheds SW1 and SW2 are 7.84 and 15.87 respectively as in Table 2.
Areal Aspect
Aerial aspects include different morphometric parameters, like drainage density (Dd), drainage texture (T), stream frequency (Fs), form factor, circulatory ratio (Rc), elongation ratio (Re) and length of the overland flow (Lg). The values of these parameters are presented in Table 2.
Drainage density (Dd)
Drainage density is defined as the total length of streams of all orders per drainage area. Density factor is related to climate, type of rocks, relief, infiltration capacity, vegetation cover, surface roughness and run-off intensity index (Langbein, 1947;
Reddy et al., 2004). The drainage density indicates the
closeness of spacing of channels (Horton, 1932).The amount and type of precipitation influences directly, to the quality and characters of surface run-off. An area with high precipitation such as thundershowers loses greater percentage of rainfall in run-off resulting in more surface drainage lines. Amount of vegetation and rainfall absorption capacity of soils, which influences the rate of surface run-off, affects the drainage texture of an area. The similar condition of lithology and geological structures, semi-arid regions have finer drainage
density texture than humid regions (Rudraiah et al., 2008;
Ahmed et al., 2010). Low drainage density generally results in
the areas of highly resistant or permeable subsoil material, dense vegetation and low relief. High drainage density is resultant of week or impermeable subsurface material, spares vegetation and mountainous relief. Low drainage density leads to course drainage texture while high drainage density leads to fine drainage texture (Nag, 1998). In the present study
drainage density (Dd) varies from 0.30 to 0.37 per km2
indicating low drainage density (Table 2). These values suggesting highly permeable subsoil, dense vegetation cover and coarse drainage texture in the study area.
Drainage texture (T)
The drainage texture (T) is an expression of the relative channel spacing in a fluvial dissected terrain. It depends upon a number of the natural factors such as climate, rainfall, vegetation, rock and soil type, infiltration capacity, relief and stage of development of a basin (Smith, 1950). The value of drainage texture (T) for the sub-basins are shown in Table
2.According to Horton (1945), drainage texture (T) is the total number of stream segments of all orders per perimeter of that area. The drainage density < 2 indicates very coarse, between 2 and 4 is related to coarse, between 4 and 6 is moderate, between 6 and 8 is fine and >8 is very fine drainage texture. In the present study, all values of drainage texture (T) are less than 2 showing very coarse drainage texture.
Stream frequency (Fs)
The total number of stream segments of all orders per unit area is known as stream frequency (Fs) (Horton, 1932). In general it is possible that a basin of same drainage density have different stream frequency and basin of same stream frequency differing in drainage density. In the study area stream frequency (Fs) values of the both sub-basins vary from 0.08 (SW2) to 0.88 (SW1) and that for main basin (MW) is 0.09 (Table 2). It is also observed that the drainage density values of sub-basins exhibits negative correlation with the stream frequency suggesting that there is an increase in stream population with respect to decreasing drainage density.
Form factor (F)
Form factor (F) may be defined as the ratio of the area of the basin and square of the basin length (Horton, 1932). Form factor (F) is a parameter used to predict the flow intensity of the watershed of a defined area and this has a direct linkage to peak discharge (Horton, 1945; Gregory and Walling, 1973). The value of form factor would always be greater than 0.78 for a perfectly circular basin. Smaller the value of form factor, more elongated will be the basin. F values of the study area are given in Table 2. It is found that F values are ranging from 0.31(SW1) to 0.39(SW2) indicating more or less elongated basin in the study area.
Elongation ratio (Re)
Elongation ratio (Re) is the ratio between the diameter of the circle of the same area as the drainage basin and the maximum length of the basin. The elongation ratio (Re) values of the sub-basins are ranging from 0.63 (SW1) to 0.70 (SW2).
Circulatory ratio (Rc)
The circulatory ratio is expressed as the ratio of the basin area (A) and the area of a circle with the same perimeter as that of the basin. The circulatory ratio (Rc) values can attain a maximum of 1.0 where the outline of the watershed is approaching near circulatory (Miller, 1953). The circulatory ratio (Rc) is mainly concerned with the length and frequency of steams, geological structures, land use/land cover, climate, relief and slope of the basin (Rudraiah et al., 2008). In the study area, the Rc value for sub-basin 1 (SW1) is 0.46 indicating elongated shape of the basin whereas that of sub-basin 2 (SW2) is 0.64 suggesting more or less circular sub-basins and these are somehow characterized by high to moderate relief also indicating that drainage system were structurally controlled.
The length of overland flow (Lg) approximately equals to half of reciprocal of drainage density. Length of overland flow (Lg) is the length of water over the ground before it gets concentrated into definite stream channel which affect both hydrological and physiographic development of the drainage basin (Horton, 1945). The length of overland flow (Lg) values of the study area shows variation from 1.35 (SW2) to 1.66 (SW1).
DISCUSSION AND CONCLUSION
The morphometric analysis is commonly done through measurements of linear, aerial and relief aspects of basins. In the Barakar River, the morphometric analysis of the drainage networks shows dendritic to sub-dendritic pattern with more or less moderate drainage texture. This suggests that the river channel fallows the initial slope of the terrain. Mean stream length (Lsm) indicates a very small change in topographic conditions of the basin area. The variation in stream length ratio (Rl) may account for change in slope and topography suggesting that of geomorphic development in streams of the study area took place during the late youth stage (Singh and Singh, 1997; Vittala, 2004). The bifurcation ratio (Rbm) in sub-basins of the river basin indicating that both the sub-basins are falling under normal basin category (Strahler, 1957) whereas the values of relief ratio (Rr) showing that it increases with decreasing drainage area and size of the given drainage basin (Gottaschalk, 1964).
The high ruggedness values of main water body and sub-basin implies that these tracts are more prone to soil erosion and have intrinsic structural complexity in association with relief and drainage density (Vijith and Satheesh, 2006). The large value of gradient ratio reflects the mountainous nature of the terrain. All the values of gradient ratio (Rg) suggesting that main stream flow more of less through the plateau and relatively high value of Rg in case of SW2 confirm the same
(Sreedevi et al., 2004, Thomas et al., 2010). The low drainage
density suggests that it has highly permeable sub-soil and coarse drainage texture (Nag, 1998). The form factor values suggest that sub-basin 1 (SW1) is circular while sub-basin 2 (SW2) is of more or less elongated category. Further, the elongated basin is less efficient in the discharge of run-off than
the circular to sub-circular basin (Rudraiah et al., 2008). The
high values of the elongation ratio (Re) suggest higher relief and steep slope in the course of the river basin (Singh and Singh, 1997). Further, the value of stream frequency indicates that both the sub-basins show negative correlation with increasing stream population related to increasing drainage density.
Acknowledgement
The authors are grateful to the Head of the Department, Centre of Advanced Study in Geology, Banaras Hindu University for providing necessary facilities. Authors also show their gratitude towards University Grant Commission for financial assistance.
REFERENCES
Ahmed, S.A., Chandrashekarappa, K.N., Raj, S.K., Nischitha, V., Kavitha, G., 2010 Evaluation of morphometric
parameters derived from ASTER and SRTM DEM—a study on Bandihole sub-watershed basin in Karnataka.
Journal of Indian Society of Remote Sensing 38:227–238
Band, L.E., 1986 Topographic partition of watersheds with
digital elevation models. Water Resources Research, 22,
15-24.
Clarke, J.I., 1966 Morphometry from maps, Essays in geomorphology, Elsevier Publication Company, New Yark,pp.235-274.
Gottschalk, L.C., 1964 Reservoir sedimentation .In: V.T. Chow (ed), Handbook of Applied Hydrology.
Gregory, K.J and Walling, D.E., 1973 Drainage Basin Form and Process –a geomorphological approach. Edward Arnold, London.
Gurnell AM and Montgomery A.R., 1999 Hydrological application of GIS .Wiley, Chichester, pp. 176.
Hadley, R.F. and Schumn, S.A.,1961 Sediment sources and drainage basin characteristics in upper Cheyenne River Basin .US Geological Survey Water-Supply Paper 1531-B: 198.
Heroy, D.C., Kuehl, S.A., and Goodbred, S.L., 2003 Mineralogy of the Ganges and Brahmaputra rivers: Implications for river switching and Late Quaternary
climate change. Sedimentary Geology, 155, 343-359.
Horton, R.E., 1932 Drainage basin characteristics.
Transactions American Geophysical Union 13,350-361. Horton, R.E., 1945 Erosional development of streams and their
drainage basins: Hydrophysical approach to quantitative
morphology. Geological Society of America Bulletin,
56,275-370
Langbein, W.B., and Others 1947 Topographic characteristics of drainage basins. US Geological Survey Water Supply Paper 968(C), 157.
Macka, Z., 2001 Determination of texture of topography from large scale contour maps. Geografski Vestnik 73(2), 53-62. Maidment, D.R., 2002 ArcHydro GIS For water resources.
ESRI Press, California.
Melton, M.A., 1965 The geomorphic and paleoclimatic significance of alluvial deposits in Southern Arizona.
Journal of Geology, 73, 1-38.
Mesa, L.M., 2006 Morphometric analysis of a subtropical
Anden basin (Tucuman, Argentina). Environmental
Geology, 50, 1235-1243.
Mesa, L.M., 2009 Morphometric analysis of a subtropical
Andean basin (Tucuman, Argentina). Environmental
Geology, 50, 1235-1242.
Miller, V.C., 1953 A quantitative geomorphic study of drainage basin characteristics in the Clinch Mountain area, Virginia and Teimessee, Proi NR 389-402,Tech.Rep 3, Columbia University.
Morris, D.S., and Heerdegen, R.G., 1988 Automatically derived catchment boundaries and channel networks and
their hydrological applications. Geomorphology,
1,131-141.
Nag, S.K., 1998 Morphometric analysis using remote sensing techniques in the Chaka sub-basin, Purulia district, West
Bengal. Journal of Indian Society of Remote Sensing,
26(1&2), 69-76.
Nag, S.K., and Chakraborty, S., 2003 Influence of rock type and structure in the development of drainage network in
hard rock area. Journal of Indian Society of Remote Sensing, 31(1), 625-635
Ozdemir, H., Brid, D., 2009 Evaluation of morphometric parameters of drainage networks derived from topographic
maps and DEM in point of flood. Environmental Geology,
56, 1405-1415.
Patton, P.C., 1988 Drainage basin morphometry and flood .In: Baker V.R., Kochel R.C., Patton P.C. (ed) Flood geomorphology. Wiley, USA., pp. 51-65.
Reddy, G.P.O., Maji, A.K., Gajbhiye, K.S., 2004 Drainage morphometry and its influence on landforms characteristics in basaltic terrain, central India-a remote sensing and GIS
approach. International Journal of Applied Earth
Observation and Geoinformation, 6, 1-16.
Ritter, D.F., Kochel, R.C., and Miller, J.R., 1995 In process geomorphology. William C. Brown, Dubuque.
Rudraiah, M., Govindaiah, S., Srinivas, V.S., 2008 Morphometry using remote sensing and GIS techniques in the sub-basins of Kagna river basin, Gulburga district,
Karnataka, India. Journal of Indian Society of Remote
Sensing, 36,351-360.
Schumn, S.A., 1956 Evolution of drainage system and slopes
in badlands at Perth Amboy, NEW Jessey. Geological
Society of America Bulletin, 67,597-646.
Singh, S., & Singh, M. C., 1997 Morphometric analysis of Kanhar river basin. National Geographical Journal of India, 43(1),31–43.
Smith, K.G., 1950 Standards for grading textures of erosional
topography. American Journal of Science, 248,655-668.
Sreedevi, P.D., Subrahmanyam, K., Ahmed, S., 2004 The significance of morphometry analysis for obtaining groundwater potential zones in a structurally controlled
terrain. Environmental Geology, 47,412-420.
Strahler, A.N., 1957 Quantitative analysis of watershed
geomorphology. Trans American Geophysical Union,
38,913-920.
Strahler, A.N., 1964 Quantitative geomorphology of drainage basin and channel networks .In: VT Chow (ed), Handbook of Applied Hydrology, McGraw Hill Book Co, New York., pp.4-76.
Thomas, J., Joseph, S., Thrivikramaji, K. P., 2010 Morphometric Aspects of Small Tropical Mountain River
System, The Southern Western Ghats, India. International
Journal of Digital Earth, 3(2), 135-156.
Vijith, H., Satheesh, R., 2006 GIS based morphometric analysis of two major upland sub-watersheds of Meenachil
River in Kerala. Journal of Indian Society of Remote
Sensing, 34 (2), pp.181- 185.
Vittala, S.S., Govindaiah, S., Honne, G. H., 2004 Morphometric analysis of sub-watersheds in the Pawagada area of Tumkur district South India using remote sensing
and GIS techniques. Journal Indian Society of Remote
Sensing, 32,351-362.
Vittala, S.S., Govindaiah, S., Honne, G. H., 2006 Digital Elevation Model (DEM) for identification of ground water
prospective zones. Journal of Indian Society of Remote
Sensing, 34,305-310.