ORIGINAL RESEARCH
MR Diffusion Tensor Imaging and Fiber Tracking
in Spinal Cord Arteriovenous Malformations: A
Preliminary Study
A. Ozanne T. Krings D. Facon P. Fillard J.L. Dumas H. Alvarez D. Ducreux P. Lasjaunias
BACKGROUND AND PURPOSE: Diffusion tensor imaging (DTI) of the spinal cord in patients harboring spinal arteriovenous malformations (AVMs) was carried out to evaluate the feasibility of this new technique to determine the displacement of the spinal cord tracts and to correlate morphologic and functional DTI data (fractional anisotropy [FA] and apparent diffusion coefficient [ADC]) with the clinical symptoms.
MATERIALS AND METHODS:Nine patients with spinal cord AVMs were investigated at 1.5T using a sagittal spin-echo single-shot echo-planar generalized autocalibrating partially parallel acquisition diffu-sion-weighted imaging sequence. ADC and FA maps were computed in different regions of interest (both above and below the nidus), and tractography was used to visualize the course of the tracts. The data were correlated with the clinical symptoms and compared with 12 healthy control subjects. RESULTS: At the level of the nidus, tracts were normal, shifted, separated, or interrupted but not intermingled with the nidus. Interruption of the tracts was coherent with the clinical symptoms. In patients with severe neurologic deficits, FA values caudal to the nidus showed a reduced anisotropy consistent with loss of white matter tracts.
CONCLUSIONS:We demonstrate that AVMs may interrupt, displace, or separate the fiber tracts and that clinical symptoms may be reflected by the quantitative FA results and the morphologic loss of fibers distant to the lesion. DTI with fiber tracking offers a novel approach to image spinal cord AVMs and may open a window to understand the complex pathophysiology of these lesions.
I
n recent years, many studies concerning MR diffusion ten-sor imaging (DTI) and fiber tracking have been published concerning both the normal aspect and various pathologies in the brain, including brain arteriovenous malformations (AVMs).1Concerning the spinal cord, this MR technique is more difficult to apply because of the following: 1) the small volume of the spinal cord compared with the brain, 2) diffi-culties in obtaining a homogeneous magnetic field inside the spinal canal, and 3) susceptibility artifacts related to the echo-planar imaging (EPI) technique used typically. Therefore, there is paucity of data concerning spinal cord DTI.2-5Studies reported thus far describe DTI findings in compressive dis-ease, chronic myelopathy, and multiple sclerosis.6-8However, DTI has not yet been reported in vascular malformations af-fecting the spinal cord. AVMs of the spinal cord may give rise to an increase of the extracellular water because of venous congestion and/or a loss of white matter fibers (eg, because of wallerian degeneration after hemorrhage) in the normal-ap-pearing cord distant to the nidus.9,10To further differentiate the above-mentioned possible effects of spinal cord AVMs on the white matter, it appears appealing to use DTI because its principle is based on the anisotropic diffusion of extracellular water molecules11,12within the anisotropic environment of white matter fibers.One purpose of this study was to analyze the quantitative results of the apparent diffusion coefficient (ADC) and the fractional anisotropy (FA) that were measured both cranial and caudal to the nidus to evaluate whether these data can give information on the complex pathophysiology of spinal cord AVMs. Apart from hemorrhage, spinal vascular malforma-tions can lead to neurologic deficits via various pathologic mechanisms, including venous congestion and mass ef-fect.10,13For a particular AVM, however, it is not known which of these pathologic mechanisms is the most relevant one, though this information might affect the therapeutic ap-proach (ie, partial targeted endovascular treatment for com-partments likely to rehemorrhage, endovascular flow reduc-tion to treat venous congesreduc-tion, or reducreduc-tion of size of venous pouches to treat the mass effect).14We hypothesize that the quantitative data could shed light on the pathologic mecha-nism to be encountered in a particular AVM, because, for example, mass effect may lead to an increase in anisotropy (because of compression of fibers),15whereas cord edema be-cause of venous congestion may lead to a decrease (bebe-cause of separation of fibers).16The main goal of the study, however, was to evaluate the feasibility of this new technique to deter-mine the displacement of the spinal cord tracts and to corre-late morphologic and functional DTI data (FA and ADC) with the clinical symptoms.
Materials and Methods
Subjects
Twelve patients with spinal cord AVM referred to our institution for endovascular treatment by transarterial embolization between March 2003 and December 2004 underwent MR imaging before treatment. Three patients were excluded from the present series: 1 because of Received August 14, 2006; accepted after revision November 8.
From the Service de Neuroradiologie Diagnostique et The´rapeutique (A.O., T.K., D.F., H.A., D.D., P.L.), Hoˆpital de Biceˆtre, Le Kremlin-Biceˆtre, Paris, France; Department of Computer Science (P.F.), University of North Carolina, Chapel Hill, NC; Department of Radiology (J.L.D.), Hoˆpital Avicenne, Universite´ Paris, Bobigny, France.
Please address correspondence to Augustin Ozanne, Service de Neuroradiologie Diagnos-tique et The´rapeuDiagnos-tique, Hoˆpital de Bicetre, 78 rue du General-Leclerc, 94275 Le Kremlin-Biceˆtre, Paris, France; e-mail: [email protected]
DOI 10.3174/ajnr.A0541
SPINE
ORIGINAL
previous surgery of the spinal cord and 2 because of excessive move-ment artifacts during scanning. The remaining 9 patients (5 male and 4 female patients) had a mean age of 23.7 years (range: 13–57 years). Clinical and demographic data are described in Table 1. The mean time elapsed between the onset of symptoms and MR examination was 25.7 months, ranging from 3 months to 8 years. Three patients were referred to us less than 6 months after the onset of symptoms. Six patients had an acute onset of symptoms (⬍48 hours), and 3 pre-sented with chronic progressive symptoms. In 1 patient (patient 3), 2 previous embolization sessions had been performed 4 and 3 years before DTI imaging, respectively; in the other patients, no previous embolization had been performed.
The severity of the symptoms was evaluated with the clinical func-tional score that was described previously by McCormick et al.17In
this grading system, grade I is designated to patients whose neurologic examination is normal or who demonstrate a mild deficit without impairment of the function of any limb. In patients at grade II, sen-sorimotor deficits of limbs and/or severe pain and/or sensory deficits responsible for an impairment of the quality of life but compatible with independent and self-sufficient walking are present. Grade III is characterized by severe sensorimotor deficits of the inferior limbs or disabling sensorimotor deficits of the superior limbs. In grade IV, patients have deficits that render them totally dependent.17Three
patients had none or a mild deficit (grade I), 4 patients had a deficit resulting in a decrease in the quality of life (grade II), and 2 patients had a deficit resulting in total dependence in activities of daily living (grade IV). These latter 2 patients (patients 2 and 7) were found to have had a hemorrhagic event, as assessed by the combination of clinical and imaging data. As our routine imaging protocol before embolization included MR imaging, we did not deem it necessary to obtain ethics committee approval to add the DTI sequence; however, informed consent by all of the patients and institutional review board approval for chart and record review were obtained.
MR Imaging Technique
Imaging was performed on a 1.5T MR imaging system with actively shielded magnetic field gradients (maximum gradient: 40 mT/m). The protocol began with conventional sequences: acquisition of a T2-weighted coronal scout followed by a sagittal T2-weighted fast spin-echo (SE) sequence (FOV: 30⫻30 cm; image matrix: 640⫻384; section thickness: 3 mm; TR/TE: 4370 ms/119 ms), a sagittal T1-weighted SE sequence (FOV: 30⫻30 cm; image matrix: 576⫻346; section thickness: 3 mm; TR/TE: 400 ms/12 ms), and an axial T2-weighted gradient-echo sequence (FOV: 20⫻15 cm; image matrix: 256⫻134; section thickness: 4 mm; TR/TE: 1330 ms/27 ms).
DTI was performed using a sagittal SE single-shot echo-planar generalized autocalibrating partially parallel acquisition (GRAPPA) diffusion-weighted imaging sequence with a 2-fold acceleration fac-tor; 2 b values (b⫽0 and 500 s/mm2) along 6 noncolinear gradient
directions (DTI6d) for patients 2, 4, 6, 7, 8, and 9 and along 25
direc-tions (DTI25d) for the remaining patients (1, 3, and 5) were
ap-plied18,19(FOV: 17.9⫻17.9 cm; image matrix: 128⫻128; 12 sections
with section thickness of 3 mm; nominal voxel size: 1.4 mm⫻1.4 mm⫻3 mm; TR/TE: 4600 ms/73 ms for both DTI25dand DTI6d; the
acquisition number was 6). Patients were asked to avoid swallowing and moving the head and limbs during diffusion-weighted imaging.
Image Analysis
Image analysis was performed on a voxel-by-voxel basis by using
ded-icated software (DPTools, http://www.fmritools.org). In addition to Table
[image:2.585.311.514.39.734.2]the 2D parametric FA color maps, 3D white matter fiber tracts were created using the principal diffusion directions method20-22 after
oversampling and interpolation of the DTI dataset (n⫽1 for 6 direc-tions;n⫽10 for 25 directions). In the principal diffusion directions method, the eigenvector corresponding with the largest eigenvalue is extracted from the diffusion tensor field generated from the DTI data-sets in the region where the diffusion is linear, typically for a FA thresholding value of 0.18 and an angulation threshold of 45° (to prevent fibers from sudden transition and to keep tracking based on the connectivity of the neighborhood), as described previously.6,20-22
When morphologically analyzing the fiber tracking (FT), we
qual-itatively described the tracts as normal, as defined previously,6shifted,
separated, or interrupted (partially, ie, across parts of the axial plane, or completely, ie, across the entire axial plane). Concerning quantita-tive data, we made measurements on the FA and ADC maps. We placed regions of interest (ROIs) centrally within the cord to avoid partial volume effects with the CSF using a technique described pre-viously6(Fig 5). As specified in Table 2, we tried to locate the ROIs for
[image:3.585.54.526.61.565.2]all of the subjects cranial and caudal to the nidus. However, in prac-tice, we had to individually tailor the ROI location for each patient. In 2 patients, the AVM nidus was located at the cervicomedullary junc-tion; therefore, measurements cranial to the nidus were not feasible; Table 2: FA and ADC values, qualitative assessments, and angiomorphology in the 9 investigated patients
Patient
ROI Placement
T2
Hyperintensity FA Z-FA ADC (10⫺3) Z-ADC Qualitative Results AVM Type and Comments
1 C6 ⫹(congestion) 0.42 ⫺11.83* 55 ⫺0.34 Separated Perimedullary pial fistula fed by the lateral spinal artery; no measurement at the level of the nidus possible because no nidus-type arteriovenous shunt was present (fistulous AVM)
T5 ⫺ 0.73 ⫺0.25 736 ⫺2.02* Normal
2 C5 0.64 ⫺3.77* 938 ⫺0.47 Normal Glomerular intramedullary AVM fed by
radiculopial and radiculomedullary arteries, false aneurysm, and signs of previous intramedullary hemorrhage present; measurements at the level of the nidus not possible because of artifacts from previous hemorrhage; measurements distal to the nidus not possible because of limited FOV
T2 ⫹(cavity) 0.49 ⫺9.21* 787 ⫺1.63 Separated
T4 ⫹(cavity) 0.36 ⫺14.18* 1196 1.51 Separated
Nidus T5 Partially interrupted
3 C1 ⫺ 0.70 ⫺1.50 862 ⫺1.06 Normal Glomerular intramedullary AVM fed by
the radiculopial network by posterolateral spinal arteries predominantly from the right side; measurement at the level of the nidus not possible because of previous embolization with glue and subsequent artifacts at that level
Nidus C2–3 Partially interrupted
C4 ⫺ 0.77 1.25 801 ⫺1.53 Normal
C6 ⫺ 0.79 1.78 715 ⫺2.11* Normal
4 Nidus C1 0.59 ⫺5.55* 1113 0.87 Separated Glomerular intramedullary AVM fed by
radiculopial arteries; measurement cranial to the nidus not possible because of brain stem location
C2 ⫺ 0.76 0.65 946 ⫺0.42 Normal
C7 ⫺ 0.78 1.63 767 ⫺1.79 Normal
5 T6 ⫺ 0.78 1.58 1011 ⫺0.01 Normal Glomerular extramedullary AVM fed by
radiculopial arteries; measurement at the level of the nidus not possible because of small remaining size of the cord
T8 ⫺ 0.77 1.16 859 ⫺1.08 Normal
Nidus T9 Shifted
T10 ⫺ 0.64 ⫺3.57* 951 ⫺0.38 Normal
6 C2 ⫺ 0.64 ⫺3.59* 873 ⫺0.97 Normal Glomerular intramedullary AVM fed by
the anterior and posterolateral spinal arteries; measurement at the level of the nidus not possible because of small remaining size of the cord
C5 ⫹(cavity) 0.36 ⫺14.12* 1451 3.47* Separated
Nidus C6 Partially interrupted
C7 ⫹(cavity) 0.49 ⫺9.25* 1380 2.93* Separated
T3 ⫺ 0.67 ⫺2.50* 915 ⫺0.65 Normal
7 C2 ⫺ 0.62 ⫺4.45* 1139 1.07 Normal Glomerular intramedullary AVM fed by
the anterior spinal artery with an associated aneurysm that arose from a sulcal artery and concomitant hemorrhage within the cord; measurement at the level of the nidus not possible because of artifacts because of blood degradation products
C4 ⫺ 0.65 ⫺3.48* 1152 1.18 Normal
T1 ⫺ 0.50 ⫺8.72* 1077 0.60 Partially interrupted
Nidus T2 Completely interrupted
T3 ⫺ 0.55 ⫺6.88* 1014 0.11 Partially interrupted
Note:—AVM indicates arteriovenous malformation; FA, fractional anisotropy; ADC, apparent diffusion coefficient.
* These values are statistically significantly different from the normal volunteers whose mean values were 0.748 with a range of 0.7– 0.8 for FA and 1.00 10⫺3with a range of 0.77–1.25
10⫺3
in 1 patient, measurements caudal to the nidus were not possible, because the FOV was too small. Because in some subjects, T2 abnor-malities were present, whereas in others, the cord appeared normal, we placed additional ROIs in the area of T2 hyperintensity and in the normal-appearing cord (Table 2). Measurements at the level of the nidus were only possible in a single subject, otherwise, quantitative measurements at the level of the nidus were not feasible because of susceptibility artifacts, thrombosis, glue artifacts, enlarged venous pouches, residua of old hemorrhages, or small volume of the residual cord. If the T2 hyperintensity had ill-defined margins with concomi-tant swelling of the cord, venous congestion was presumed to be the cause of the hyperintensity compared with gliosis or nonspace-occu-pying syringohydromyelia if the margins were well delineated and the volume of the cord was normal or decreased, a state that we will further refer to as “cavitation.”
Statistical Analysis
We used the method ofZ-scores to compare the values of the patients with those of 11 healthy volunteers (8 men and 3 women; mean age: 36.7 years; range: 20 to 67 years) who were investigated with the same imaging protocol.6Their FA and ADC values were 0.748 with a range
of 0.7 to 0.8 for FA and 1.00 10⫺3with a range of 0.77 to 1.25 10⫺3for
the ADC. FT showed the main white matter tracts (posterolateral corticospinal tracts and posterior lemniscal tracts) in all of the volun-teers. The values of the AVM were considered abnormal when not included in the 95% confidence interval [Z-score⬎2 ,Z⫽(x⫺)/, withx⫽value,⫽mean, and⫽SD] of the healthy volunteers.
Results
The most illustrative cases are reported in Figs 1-6 and show mainly the morphologic aspect of the fiber tracts compared with conventional MR imaging and digital subtraction an-giography findings. In the following, we detail both the FT and the quantitative data of DTI in comparison with morphologic and clinical data.
DTI Results in Relation to the MR Morphology
At the level of the nidus, the fibers were separated, shifted, interrupted, or normal compared with the morphology of fi-bers in healthy control subjects. No fifi-bers running through the nidus itself could be detected, comparing the results of the FT data with the conventional imaging data.
Distant to the nidus, congestive edema was present in 1 patient: FT25dshowed separated fascicles, with global enlarge-ment of the beam of tracts. There was a slight rarefaction of tracts (Fig 1). We found significantly decreased FA (0.42/Z⫽ ⫺11.83) and normal ADC values (0.955 10⫺3/Z⫽ ⫺0.34).
Cranial or caudal to the nidus, a cavitation as explained above was present in 3 patients (Figs 2 and 5). FT demonstrated a loss of tracts with global thinning of the beam. The remaining tracts were still grouped into fascicles and were separated from the mid-line. A significantly decreased mean FA of 0.42/Z⫽ ⫺11.7 (FA range: 0.36 – 0.50) and a normal mean ADC of 1.13 10⫺3/Z⫽ 1.02 (ADC range: 0.79 –1.45 10⫺3) were found.
In the segments of the cord distant to the nidus without T2 hyperintensity where draining veins were present, FA values were marginally decreased compared with those segments where no draining veins were visualized. DTI in normal-ap-pearing cord above and below the nidus and distant to the T2 hyperintensity also showed slightly lower FA values in the group of patients compared with the normal cord of healthy volunteers (mean FA: 0.64Z⫽ ⫺3.7), whereas the ADC was normal without statistically significant differences between both groups.
DTI Results in Relation to the Clinical Symptoms
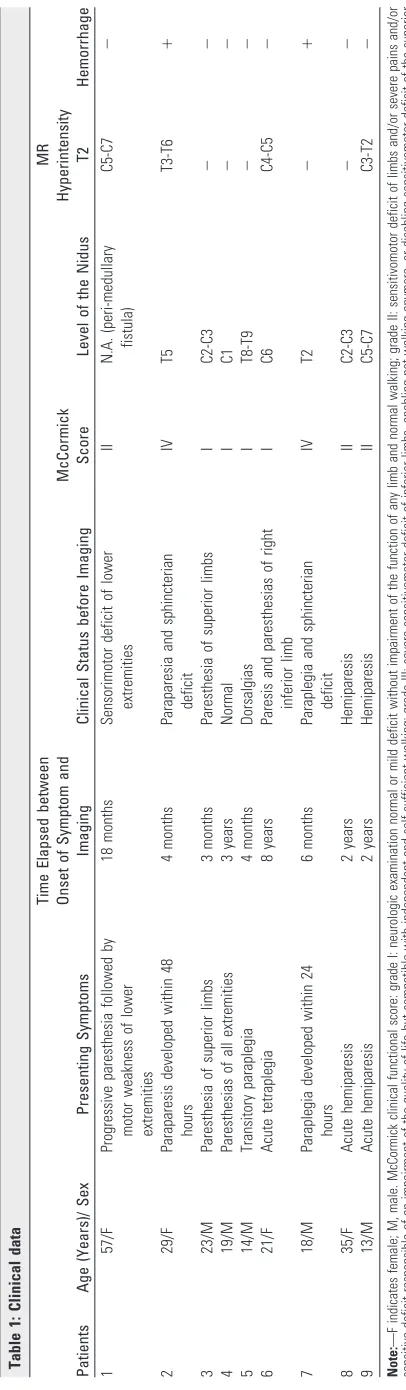
In addition to the above-mentioned correlations of FA and ADC results to MR imaging data, we also performed a cor-relation with the clinical symptoms. At the level of the ni-dus, 1 patient with a severe neurologic deficit (McCormick IV) who became symptomatic because of a spinal hemor-rhage had a complete interruption of the tracts (Fig 6). Five patients had partially interrupted tracts (Figs 3 and 5): 4 of Fig 1.Venous congestion of the spinal cord and
separated tracts (patient 1, DTI25d). This
57-year-old woman presented with a 2-year history of progressive paresthesia in the bilateral lower limbs, followed by further development of leg weakness and sphincter problems. The McCor-mick score was II. A pial arteriovenous fistula that was fed by the lateral spinal artery arising from the left posteroinferior cerebellar artery was found.
A, T2-weighted images showed enlargement of
the spinal cord at the C6 level with
hyperinten-sity reflecting local venous congestion (arrow).
B, There was a dilated vessel at the anterior
surface of the cord, which corresponded with a vein draining the shunt caudally, as depicted on selective injection during angiography.
C, Posterior view of the FT25dshowed separated
fascicles at the level of C6 (arrow), with global
enlargement of the beam of tracts. The remain-ing fibers were grouped together into fascicles. By counting the tracts at the level of the con-gestion (674) and below it (741; ratio: lesion
level/caudal to lesion⫽0.91), we were able to
[image:4.585.54.414.43.263.2]them had a score of McCormick I or II without any obvious previous hemorrhage; the fifth had a more severe clinical score (McCormick IV) and a previous hemorrhage. In 2 patients, the tracts were separated but not interrupted at the level of the nidus, and the clinical score was good (McCor-mick I and II, respectively). In 1 patient, the tracts were shifted without focal interruption, and the clinical status was normal (Fig 4).
Under the assumption that FA and ADC in the normal-appearing cord caudal to the nidus may be altered because
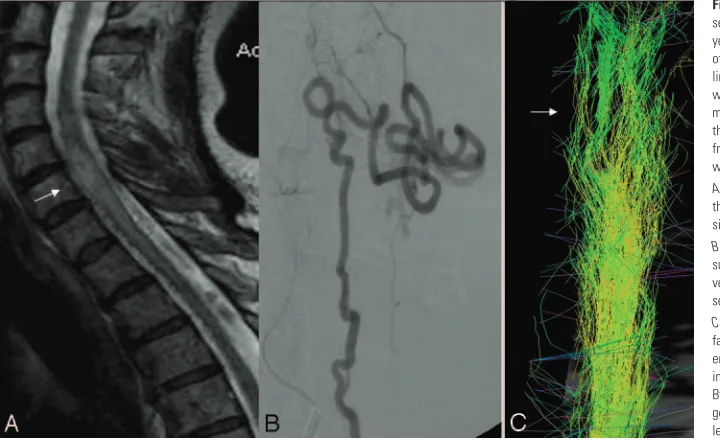
of the AVM, we investigated quantitative DTI results caudal to the cord. Four patients had a good clinical score (McCor-mick I). In these patients, the FA values were normal com-pared with the group of healthy control subjects (mean FA: 0.74/Z⫽0.51), whereas the ADC values were slightly de-creased (mean ADC: 0.849 10⫺3/Z⫽ ⫺1.0). Patients with neurologic symptoms had decreased FA values, both com-pared with the group of healthy volunteers and with the group of patients with good clinical scores. Three patients with a score of II had a mean FA of 0.68 (Z ⫽ ⫺2.5), Fig 2.Cavity in the cord: thinning of the beam of
tracts and separated tracts (patient 2, DTI6d).
This 29-year-old woman presented to our ser-vice 3 months after she had experienced a sudden complete paraplegia. Subsequently, no clinical improvement was noted.
A–C, The T2-weighted (A and B) and
T1-weighted (C) morphologic sequences showed a
central cavity within the thoracic cord, an AVM nidus located at T5, and dilated perimedullary vessels mainly cranial but also caudal to the nidus. There was only a moderate enlargement of the cord, which may have been because of the mass effect of the venous pseudoaneurysm.
D, Anteroposterior view of the angiogram
showed the venous drainage of the arterio-venous shunt. There was a arterio-venous false aneu-rysm at the level of the nidus that was partially thrombosed as depicted on MR imaging (hyper-intensity on both T1 and T2) and surrounded by hemosiderin (hypointensity on T1 and T2), indi-cating a previous hemorrhage, responsible for her initial symptoms.
E, Posterior view of the FT6dcaudal to the nidus
(arrow) showed a global thinning but no inter-ruption of the beam of tracts at the level of the cavity in comparison with the normal size of the
white matter tracts at C7 (double arrows). The
tracts were separated from the midline but still grouped into fascicles.
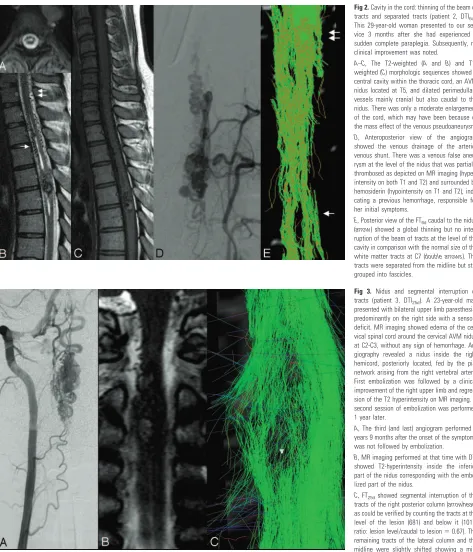
Fig 3. Nidus and segmental interruption of
tracts (patient 3, DTI25d). A 23-year-old man
presented with bilateral upper limb paresthesia, predominantly on the right side with a sensory deficit. MR imaging showed edema of the cer-vical spinal cord around the cercer-vical AVM nidus at C2-C3, without any sign of hemorrhage. An-giography revealed a nidus inside the right hemicord, posteriorly located, fed by the pial network arising from the right vertebral artery. First embolization was followed by a clinical improvement of the right upper limb and regres-sion of the T2 hyperintensity on MR imaging. A second session of embolization was performed 1 year later.
A, The third (and last) angiogram performed 3
years 9 months after the onset of the symptoms was not followed by embolization.
B, MR imaging performed at that time with DTI
showed T2-hyperintensity inside the inferior part of the nidus corresponding with the embo-lized part of the nidus.
C, FT25dshowed segmental interruption of the
tracts of the right posterior column (arrowhead)
as could be verified by counting the tracts at the level of the lesion (681) and below it (1017;
ratio: lesion level/caudal to lesion⫽0.67). The
[image:5.585.56.529.38.590.2]whereas ADC values were similar compared with patients with a score of I (mean ADC: 0.861 10⫺3/Z⫽ ⫺1.0). In the 2 patients with severe neurologic impairment (McCormick IV), FA values caudal to the AVM could be measured for technical reasons in only 1 patient. In this patient, the de-crease in FA values found caudal to the nidus in the normal-appearing cord was most pronounced with a mean FA of
0.55 (Z⫽ ⫺6.8), whereas ADC values were normal (mean ADC: 1.014 10⫺3;Z⫽ ⫺0.11).
Quantitative DTI results in the normal-appearing cord were also investigated with regard to the duration of symptoms. How-ever, here we found no difference between the group of patients who were imaged with a longer latency and the patients imaged in close temporal relation to their symptom onset.
Fig 4.Nidus at the surface of the cord shifting
the tracts (patient 5, DTI25d). A 14-year-old boy
presented 4 months after he experienced a sud-den paraplegia, which secondarily completely resolved (McCormick I).
A–C, MR imaging showed a nidus located close
to the right surface of the thoracic cord, at the level of T8-T9. On these T2-weighted images, no hyperintensity of the cord was visualized.
Dshows the anisotropy that, because of the
small remaining volume of the cord at that level, cannot be determined.
Edemonstrates displacement of the beam of
fibers to the right without focal interruption
(FT25d). Distal to the nidus, the fibers seem to be
more separated compared with the proximal part, which may indicate an increased water content of the cord that is not yet visible on T2-weighted images as edema, which in fact suits the decreased FA values that were found in this area (Table 2).
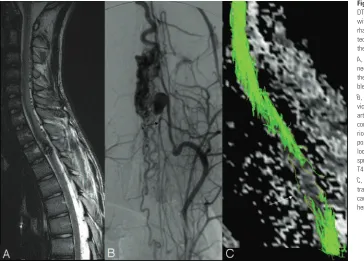
Fig 5.Increase of the tracts (FT6d) after
embo-lization (patient 6, DTI6d). A 21-year-old woman
with cervical spinal cord arteriovenous malfor-mation first presented with a sudden tetraplegia when she was 12 years old. The neurologic status gradually improved (the McCormick score was grade I at the time of referral to our hospital). MR imaging, angiograms, fiber
track-ing before (A, C, andE) and after embolization
(B,D, andF), and FA and ADC images (GandH)
are shown.
At the level of the nidus (arrow), located within
the cord, there was partial discontinuity of the
tracts (E). Above and below the nidus,
conven-tional T2-weighted images (A,B) showed a
cen-tral cavity in the cord. Here, FT6dshowed both a
global thinning of the beam (double arrow in E)
and separated tracts around the central cavity. When we compared the evolution after emboli-zation, angiography demonstrated decrease of
flow inside the nidus and the draining veins (D).
T2-weighted images did not show any modifi-cation of the appearance of the perinidal cord.
The FT6dshowed (F) an increased number of
tracts at the level (arrow) and just above (double
arrow) the nidus, presumably due to a reduction of venous congestion with concomitant higher FA values and therefore better visualization of
fiber tracts. PanelsGandHdemonstrate the FA
values and the ADC map with the ROI
[image:6.585.55.422.38.636.2]Discussion
Background
Spinal cord AVMs are usually diagnosed by conventional MR imaging showing an intramedullary nidus and dilated peri-medullary draining veins.9,23,24MR imaging can also depict potential complications of AVMs, such as hemorrhage (hema-tomyelia or subarachnoid hemorrhage) or venous congestion because of altered venous drainage. This congestive edema of the spinal cord may extend over multiple segments and is due to an increase of interstitial water. Chronic venous congestion leads to slowly progressive neurologic symptoms and spinal cord atrophy. In patients with hematomyelia, AVMs may lead to variable neurologic deficits resulting from direct damage to the gray and white matter.10 Endovascular treatment by transarterial embolization with glue is aimed first at excluding those parts of the nidus that harbor identifiable angioarchitec-tural risk factors, such as intranidal false aneurysms or drain-age into venous ectasias or stenosis. A second goal is to reduce the flow in the nidus and subsequently in the draining veins to decrease the venous congestion.25MR imaging performed af-ter embolization may, therefore, show complete regression of the T2 hyperintensity. Our series of 9 patients with spinal cord AVM investigated with DTI presented with various clinical and imaging findings in terms of the presence of hemorrhage, venous congestion, and the time elapsed between the onset of the symptoms and the admission. Although this group of pa-tients allows us to evaluate the use of DTI in a wide variety of different pathologic mechanisms present in AVM, it makes the investigated group of patients rather heterogeneous. Still, there were certain characteristic findings that warrant further discussion.
DTI at the Level of the Nidus
At the level of the nidus, FT may give additional information compared with the conventional morphologic MR images. As
could be demonstrated in our series, the morphologic aspects of the fiber tracts could be demonstrated in all 9 of the patients, though the exact delineation among the nidus, the intrinsic draining veins, and the white matter was difficult to perceive because of low spatial resolution. In most patients, FT did not show focal interruption of tracts at the level of the nidus. This is coherent with the notion that an AVM, being in the sub-arachnoid or subpial space, does not “infiltrate” the normal spinal cord but in fact displaces or separates the fiber tracts. For brain AVMs, this has been recently illustrated by Ma-ruyama et al,26who, by using FT, were able to show that cor-ticospinal tracts in patients with rolandic AVMs are separated or displaced, but there are no tracts running through the vas-cular malformation. In our series, continuous tracts were cor-related with a good clinical status. If interruption of tracts was present, clinical symptoms corresponded with the interrupted tract (Fig 3: patient with loss of sensation and interrupted posterior white matter fibers). The cause of the interruption of the tracts may be because of one of the following: 1) the real loss of white matter fibers; 2) magnetic susceptibility artifacts because of the hemoglobin degradation products, the nidus, or the draining veins; or 3) an increase of free water in the vicinity of the nidus with subsequent decrease in anisotropy. When the nidus was not located inside the cord but close to its surface, the added value of the FT was not so evident, because T2 sequences could already demonstrate sufficiently the shifted cord distinct from the nidus. Still, FT was able to dem-onstrate the continuity of white matter bundles that were shifted by the nidus. For those patients who did not present with hematomyelia, there was no obvious discordance be-tween the clinical data and the appearance of the tracts (pre-served, shifted, or interrupted) at the level of the nidus as de-picted by FT. Problems of FT arise, however, in patients with hemorrhage, because the interruption of tracts may be the consequence of susceptibility artifacts because of hemoglobin Fig 6.Hemorrhage in the spinal cord (patient 7,
DTI6d). An 18-year-old male patient presented
with a sudden paraplegia because of hemor-rhage in a thoracic AVM. When he was admit-ted 3 months later, the neurologic status was the same (McCormick IV).
A, MR imaging showed a nodular
heteroge-neous signal intensity inside the thoracic cord at the T2 level, corresponding with the point of bleeding.
B, The cord hemorrhage was located in the
vicinity of the nidus that harbored an associated arterial aneurysm in the anterior sulcus of the cord with concomitant mass effect on the
ante-rior spinal artery (arrow). An associated T2
hy-pointensity corresponding with hemosiderin was located at the anterior part of the cord and spread cranially to the midbrain and caudally to T4 level.
C, FT6dshowed an interruption of all of the
[image:7.585.53.417.42.303.2]degradation products and may not be related to damage of the white matter from the hematomyelia. Furthermore, suscepti-bility artifacts from thrombosed pouches, pulsation, and flow artifacts render FT difficult to interpret. Evaluation of routine anatomic sequences in addition to FT images is, therefore, recommended.
DTI in Venous Congestion
In the single patient who presented with venous congestion, we were able to show that the tracts were heterogeneously separated and grouped into fascicles that may correspond with the anatomic fascicles. Two mechanisms may explain this as-pect: a heterogeneous loss of white matter fibers predominat-ing at the periphery of the white matter fascicles or a hetero-geneous repartition of the increase of water in the interstitium related to the angioarchitecture of the intrinsic vascular network.
DTI is mainly based on the directed diffusion of extracellular water and is related to the interaction between the white matter fibers and the extracellular water.27During venous congestion, the increase in extracellular water will, therefore, lead to a de-crease of the FA while the fibers are still intact. FA is more sensitive than SE sequences to detect an increase of water, as Facon et al6 had already reported in compressive pathology of the spinal cord. Depending on the intensity and the duration of the congestion, however, white matter fibers may become irreversibly damaged over time, leading to a further decrease of FA values. Because there has been only 1 patient in our series presenting with venous congestion distant to the nidus, our results have to be interpreted with caution. More patients, especially those with early or mild venous congestion, need to be studied to further assess the effect of venous congestion on FT.
DTI in Cavitation
In patients presenting with sharply delineated T2 hyperinten-sities of the central spinal cord representing either gliosis or nonspace-occupying syringohydromyelia, FT showed a global thinning of the beam. We presume that this thinning is related to a true decrease of the white matter bundles in the vicinity of the lesion as shown by the concomitant decrease of the size of the cord on T2-weighted images. The decrease in FA at these levels further confirms the loss of fibers, whereas the normal mean ADC speaks in favor of a gliosis instead of a syringohy-dromyelia as the most probable morphologic substrate of the observed imaging findings. Nevertheless, quantitative data must be interpreted with caution because of limited spatial resolution of DTI with subsequent partial volume averaging within our longitudinal ROIs. The measurement with the ROI that we applied cannot distinguish between the different com-partments of the spinal cord (ie, gray and white matter) de-picted in high-resolution axial sections. Higher field strengths are necessary to overcome this problem, as shown in animal studies at 7T, where the FA values for normal gray and white matter are 0.59 and 0.92, respectively.28Because we placed our ROIs in the sagittal plane, both white and gray matter areas are likely to be averaged in various and unknown proportions for different patients, thereby affecting the quantitative results considerably.
DTI Findings Related to Clinical Aspects
Caudal to the nidus within the normal-appearing cord, we were able to show a decrease of FA values in patients with poor clinical scores compared with both patients with good clinical scores and the group of healthy control subjects. These find-ings may be related to the loss of fibers because of wallerian degeneration, which has already been described for the brain after stroke.29,30After cerebral infarction, a reduced anisot-ropy within the corticospinal tract remote from the lesion was found 2– 6 months after ischemic stroke, highlighting the po-tential of DTI to detect and monitor the structural degenera-tion of fiber pathways.
Conclusions
In this short series we were able to show the following: 1) DTI of the spinal cord is possible in the presence of vascular mal-formations; 2) AVMs at the level of the nidus can interrupt, displace, or separate the fiber tracts, whereas, distant to the nidus, the effects of congestion or gliosis on the tracts can be perceived; 3) the clinical score can be reflected by the interrup-tion of fibers close to the nidus and by a loss of fibers distant to the lesion; and 4) the quantitative results, especially the FA values, may be related to the clinical symptoms. We conclude that DTI with FT offers a novel approach to image spinal cord AVMs and opens a window to understand the complex patho-physiology of these lesions.
Acknowledgments
We thank one anonymous reviewer for his helpful and con-structive critique. Moreover, we are deeply indebted to Soke M. Chng, MD, and Sean Cullen MD, for final proofreading and editing of the article.
References
1. Yamada K, Kizu O, Ito H, et al.Tractography for arteriovenous malformations near the sensorimotor cortices.AJNR Am J Neuroradiol2005;26:598 – 602 2. Ries M, Jones RA, Dousset V, et al.Diffusion tensor MRI of the spinal cord.
Magn Reson Med2000;44:884 –92
3. Clark CA, Werring DJ, Miller DH.Diffusion imaging of the spinal cord in vivo: estimation of the principal diffusivities and application to multiple sclerosis.
Magn Reson Med2000;43:133–38
4. Bammer R, Augustin M, Strasser-Fuchs S, et al.Magnetic resonance diffusion tensor imaging for characterizing diffuse and focal white matter abnormali-ties in multiple sclerosis.Magn Reson Med2000;44:583–91
5. Cercignani M, Horsfield MA, Agosta F, et al.Sensitivity-encoded diffusion tensor MR imaging of the cervical cord.AJNR Am J Neuroradiol2003;24: 1254 –56
6. Facon D, Ozanne A, Fillard P, et al.MR diffusion tensor imaging and fiber tracking in spinal cord compression.AJNR Am J Neuroradiol2005;26:1587–94 7. Demir A, Ries M, Moonen CT, et al.Diffusion-weighted MR imaging with apparent diffusion coefficient and apparent diffusion tensor maps in cervical spondylotic myelopathy.Radiology2003;229:37– 43
8. Valsasina P, Rocca MA, Agosta F, et al.Mean diffusivity and fractional anisot-ropy histogram analysis of the cervical cord in MS patients.Neuroimage
2005;26:822–28
9. Berenstein AL, Lasjaunias P, ter Brugge, KG.Spinal arteriovenous malfor-mation.In:Surgical Neuroangiography.2nd ed. Berlin: Springer-Verlag; 2004:737– 843
10. Krings T, Mull M, Gilsbach JM, et al.Spinal vascular malformations.Eur Radiol
2005;15:267–78
11. Basser PJ, Pierpaoli C.Microstructural and physiological features of tissues
elucidated by quantitative-diffusion-tensor MRI.J Magn Reson B1996;111: 209 –19
12. Basser PJ, Mattiello J, LeBihan D.Estimation of the effective self-diffusion tensor from the NMR spin echo.J Magn Reson B1994;103:247–54
13. Rodesch G, Lasjaunias P.Spinal cord arteriovenous shunts: from imaging to management.Eur J Radiol2003;46:221–32
14. Rodesch G, Hurth M, Alvarez H, et al.Angio-architecture of spinal cord arte-riovenous shunts at presentation. Clinical correlations in adults and children. The Bicetre experience on 155 consecutive patients seen between 1981–1999.
Acta Neurochir(Wien) 2004;146:217–26; discussion 226 –27
15. Krings T, Reinges MHT, Thiex R, et al.Functional and diffusion weighted magnetic resonance imaging of space-occupying lesions affecting the motor system: imaging the motor cortex and pyramidal tracts. J Neurosurg
2001;95:816 –24
16. Reinges MHT, Schoth F, Coenen VA, et al.Imaging of postthalamic visual fiber tracts by anisotropic diffusion weighted MRI and diffusion tensor imaging. Principles and applications.Eur J Radiol2004;49:91–104
17. McCormick PC, Torres R, Post KD, et al.Intramedullary ependymoma of the spinal cord.J Neurosurg1990;72:523–32
18. Basser PJ, Pierpaoli C.A simplified method to measure the diffusion tensor from seven MR images.Magn Reson Med1998;39:928 –34
19. Pierpaoli C, Basser PJ.Toward a quantitative assessment of diffusion anisot-ropy.Magn Reson Med1996;36:893–906
20. Mori S, Crain B, Chacko V, et al.Three-dimensional tracking of axonal pro-jections in the brain by magnetic resonance imaging.Ann Neurol1999;45: 265– 69
21. Xu D, Mori S, Solaiyappan M, et al.A framework for callosal fiber distribution analysis.Neuroimage2002;17:1131– 43
22. Westin CF, Maier SE, Mamata H, et al.Processing and visualization for diffu-sion tensor MRI.Med Image Anal2002;6:93–108
23. Doppman JL, Di Chiro G, Dwyer AJ, et al.Magnetic resonance imaging of spinal arteriovenous malformations.J Neurosurg1987;66:830 –34
24. Dormont D, Assouline E, Gelbert F, et al.MRI study of spinal arteriovenous malformations.J Neuroradiol1987;14:351– 64
25. Rodesch G, Hurth M, Alvarez H, et al.Embolization of spinal cord arterio-venous shunts: morphological and clinical follow-up and results–review of 69 consecutive cases.Neurosurgery2003;53:40 – 49; discussion 49 –50
26. Maruyama K, Kamada K, Shin M, et al.Integration of three-dimensional cor-ticospinal tractography into treatment planning for gamma knife surgery.
J Neurosurg2005;102:673–77
27. Beaulieu C, Allen PS.Determinants of anisotropic water diffusion in nerves.
Magn Reson Med1994;31:394 – 400
28. Elshafiey I, Bilgen M, He R, et al.In vivo diffusion tensor imaging of rat spinal cord at 7 T.Magn Reson Imaging2002;20:243– 47
29. Thomalla G, Glauche V, Weiller C, et al.Time course of wallerian degeneration after ischaemic stroke revealed by diffusion tensor imaging.J Neurol Neuro-surg Psychiatry2005;76:266 – 68
30. Werring DJ, Toosy AT, Clark CA, et al.Diffusion tensor imaging can detect and quantify corticospinal tract degeneration after stroke.J Neurol Neurosurg Psy-chiatry2000;69:269 –72
31. Voss HU, Watts R, Ulug AM, et al.Fiber tracking in the cervical spine and inferior brain regions with reversed gradient diffusion tensor imaging.Magn Reson Imaging2006;24:231–39