Received Dec 2, 2017 / Accepted Jan 22, 2018
Energy-Aware Scheduler for HPC Parallel Task Base Applications in Cloud
Computing
Fredy Juarez
1,2, Jorge Ejarque
2, Rosa M. Badia
3, Sergio N. González
Rocha
2,5, Oscar A. Esquivel-Flores
2,4TecNM - Instituto Tecnológico Superior de Álamo Temapache
1Barcelona Supercomputing Center (BSC)
2Artificial Intelligence Research Institute (IIIA), Spanish National Research Council
(CSIC), Spain
3Instituto Tecnológico y de Estudios Superiores de Monterrey, ENIC-GIEE-ITESM
4Universidad Veracruzana
5[email protected],{jorge.ejarque,rosam.badia}@bsc.es
[email protected],[email protected]
Abstract. In the world, distributed platforms such as clusters, grids, and clouds spend around 1.5%-2.0% of the total energy consumption and this demand is growing extremely fast. For reducing energy consumption one of the methods is providing scheduling policies in order to allocate tasks on specific resources that impact over the processing times and energy consumption. In this paper, we propose a scheduling system to execute efficiently task-based applications on distributed computing platforms in order to minimize the energy consumption, execution time or both, also we present a dynamic online polynomial-time algorithm that combines a set of heuristic rules and a resource allocation technique in order to get good solutions on an affordable time scale. A prototype implementation of the scheduler has been tested with matrix multiplication DAG generated at random as well as on real task-based COMPSs applications, concluding that our method is suitable for run-time scheduling.
1
Introduction
Recent studies [4] [7] have estimated that around 1.5-2.0% of the total energy consumption is consumed by data centers such as clusters, grids and cloud, and this energy demand is growing extremely fast due to the popularization of Internet services and distributed computing platforms. Regarding the efficiency of data centers, studies have concluded that, in average, around 55% of the energy consumed in a data center is consumed by the computing system and the rest is consumed by the support system such as cooling, uninterrupted power supply, etc. For that reason, green cloud computing is essential for ensuring that the future growth of cloud computing is sustainable [2].
There are several ways to reduce the energy consumed by an application when executed on a distributed platform: It includes the usage of low-power processor architectures or dynamic voltage frequency scaling (DVFS) [6], redesign of algorithms using energy-efficient patterns in compilers [10] or changing the scheduling policies for task-based applications on the available resources [1].
Traditionally, scheduling techniques have tried to minimize the total execution time of an application (makespan - Cmax) [8]
without worrying about the energy consumed. However, there is a trade-off between energy consumed and the execution time, and sometimes increasing the performance for a faster execution implies a higher energy consumption.
the details of the underlying infrastructure. They just need to identify the tasks, which are the methods of the applications, to be executed in the distributed platform. At run-time, COMPSs detects data dependencies between tasks creating a DAG. Once the DAG is created, the COMPSs runtime will use the energy-aware scheduler for allocating and executing the tasks on the available computing resources in order to minimize energy or makespan.
The scheduler has been tested with different kinds of DAGs generated at random as well as on real COMPSs applications. We have evaluated which combination of our proposed algorithm called multi-heuristic resource allocation (MHRA) provides a better solution and energy savings and the execution time in each case, and the effect on the cloud elasticity. Moreover, we have also evaluated the introduced overhead by measuring the time for getting the scheduling solutions for a different number of tasks, kinds of DAG, and resources, concluding that it is suitable for run-time scheduling.
2
Related work
Traditional task scheduling algorithms for distributed platforms such as clusters, grids, and clouds, focus in minimizing the execution time [3, 11] without considering energy consumption. Regarding specific work on energy-aware scheduling two main trends can be found in the literature: 1) pure scheduling software and 2) combined scheduling hardware/software. For combined scheduling, a commonly used technique is taking profit of the Dynamic Voltage Frequency Scaling (DVFS) feature which enables processors to reduce the energy consumption. By using DVFS, processors can run at different voltage, impacting on the frequency and energy consumption.
3
COMP Superscalar overview
[image:2.612.92.528.447.700.2]COMP Superscalar (COMPSs) shown in Figure 1, is a framework that provides a programming model for the development of task-based applications for distributed environments and a runtime to efficiently execute them on a wide range of computational infrastructures such as clusters, grids and clouds. The aim of COMPSs is to provide an easy way to develop parallel applications, while keeping the programmers unaware of the execution environment and parallelization details. The programmers do not require prior knowledge about the underlying infrastructure, they are only required to create a sequential application and specify which methods of the application code will be executed remotely. This selection is done by providing an annotated interface where these methods are declared with some metadata about the directionality of their parameters.
4
Problem formulation
COMPSs translates a sequential program S into a directed acyclic graph (DAG) by evaluating data and task dependencies between parts of code in real time. The generated DAG, represented by G = (T, D) , contains a set of vertexes T, which represents the task invocations, and a set of edges D, which represents dependencies between task invocations. For two tasks an edge of the form denotes a relation task dependency between tasks i, j, where the task j should be executed after task i is completed. In this sense i is called parent and j is called child. While a child j may have many parents i, j is only ready when all parents i have been completed. On the other hand, a Cloud platform can be described as a set of nodes N = {n1, n2, ..., nm}, where node m is represented by nm. Each node nm is responsible for managing a set of virtual machines (VM) Vm = {vm1, vm2, ..., vmk} ,where VM k of node m is represented by vmk. Each VM vmk has a set of processing cores Cmki = {cmk1, cmk2, ..., cmki}, where each core i of VM vmk is represented by cmki.
Finally, the scheduling problem consists on looking for a task scheduling S, which represents the execution order of each task j on the set of available resources. So, the scheduling for cmki (represented by Smki) is given by the expression 1, which represents the order that n task is executed on the i -th core of the k -th VM of m-th node ( ), and the complete scheduling solution S can be represented by expression 2, as the set of schedulings for all the resources of the Cloud.
(1)
(2) (2)
Therefore, the proposed scheduling problem can be modeled as an optimization problem which looks for a solution S that minimizes the bi-objective cost function, as represented in Equation 3.
(3)
5
Power profiling
A power profile of the host used in the cloud is required to estimate the overall energy flow. The process of profiling consist of extracting the mean power values for the possible events of an application. In this section, we explain the methodology used to extract this power profile energy, and the values obtained for our testbed which is composed by AMD and INTEL architectures.
[image:3.612.101.487.556.693.2]a.
Power profiling procedure
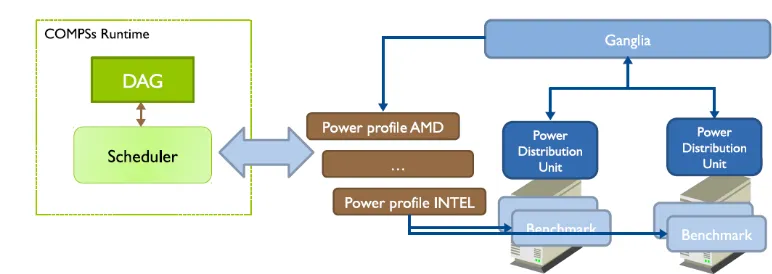
The overall procedure to get the power profile is depicted in Figure 2. The energy provided to the cloud is manager by Power Distribution Units (PDU) which are capable of providing the power provided to the different nodes of the Cloud. The information provided by the PDUs is aggregated by a monitoring system (Ganglia and hsflow in our case) which already provides the resource consumption (network, memory, CPU) per Node and VM. With this system we can run a set of benchmarks which stress the different parts of the system. When the benchmark process has finalized, the power usage information is extracted from Ganglia logs, and it is analyzed to make the power profiles. This power profile is automated by a set of scripts and performed in a setup phase.
[image:4.612.108.506.214.299.2]The power profile obtained for both types of nodes is summarized in Table 1. Finally, due to the fact that both types of servers are located in the same data center the PUE will be the same.
Table 1. Estimated mean power consumption for the different elements of a cloud platform.
Element Description AMD Mean Power Element
Pcmki Core consumption 9.73W 11.02W
Psetupvmk Setup VM 9.49W 18.24W
Pdownvmk Down VM 9.49W 18.24W
Pidlenm Idle state 175.67W 115.30W
Pnetnm Data transfer 30.04W-42.03 MB/s 27.56W-42.03 MB/s
PUE PUE 1.2 1.2
6
Multi-heuristic resource allocation
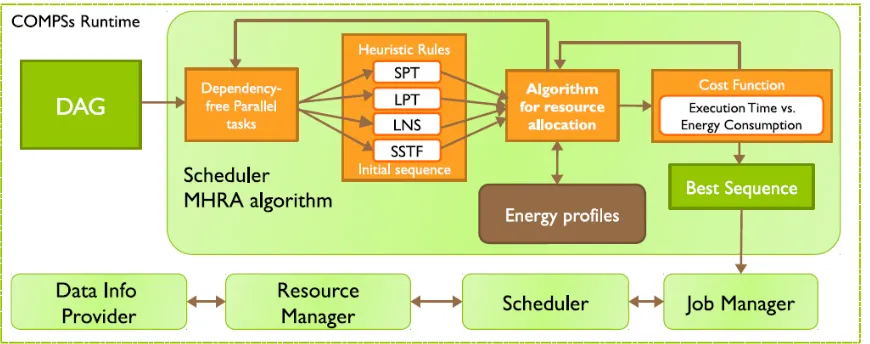
Multi-heuristic resource allocation algorithm (MHRA), which generates scheduling solutions of good quality in near real-time. It is essentially a fast local search algorithm for partial solutions. MHRA builds the solution step by step, taking one task at a time and determining which is the next best location on the infrastructure. Figure 3 shows an overview of the MHRA policy. The MHRA receives as input a DAG that contains the set of tasks to be carried out on the cloud.
The algorithm automatically analyses the DAG and obtains a subset of tasks free of dependencies that can be executed in parallel. Then, for each subset, the algorithm prioritize the tasks them based on different heuristics rules and applies a the resource allocation process which seeks the best resource for each task that minimizes the bi-objective cost function according to the importance factors specified by the user. This cycle between the resource allocation and the objective function evaluation is repeated for each subset of the DAG and heuristic rule. Finally, the scheduler selects the scheduling sequence generated with the heuristic rule which minimizes this cost function.
[image:4.612.86.521.486.658.2]a.
Task resource allocation
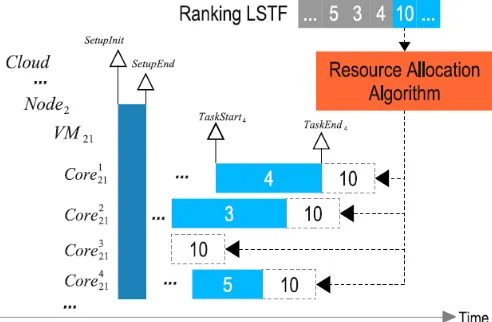
[image:5.612.180.426.149.310.2]After getting an initial set of sequences by applying the rules described above, we proceed to determine which is the best resource for each task. To achieve this, the resource allocation process is applied as shown in Figure 4. It inspects the available resources and selects the best position by evaluating the objective function. The metrics used to evaluate the objective function is on based in energy consumption metrics showed in table 1.
Fig. 4. Initial ranking and resource allocation
7
Experimental evaluation.
This section presents the experiments carried out to evaluate the proposed energy-aware scheduler. The first part of the section describes the configuration used for the evaluation including the machine used to run the scheduling and the cloud infrastructure, the benchmark applications and the heuristic used by the scheduler. The second part presents the results of running the energy- aware scheduling for the different benchmarks, showing the effect of the different factors and heuristics in the consumed energy, makespan, the use of resources and the cloud elasticity. The section is finalized with a set of experiments to evaluate the performance of the scheduling algorithm evaluating how the time to get the scheduling solution grows with the number of tasks and resources.
a.
Experiments.
To carry out the experiments, we have implemented a prototype of the proposed energy-aware scheduler and we have installed it in a DELL Notebook with Intel i7-2760QM CPU 2.40 GHz with 8 cores and 8GB of memory. We have implemented several benchmarking applications with the COMPSs programming model and we have extracted the DAG generated by the runtime which is the input for the scheduler evaluation. We have simulated the scheduling solutions proposed by the energy-aware scheduler for running the applications in an private cloud infrastructure at the Barcelona Supercomputing Center (BSC).
Cloud infrastructure. The private cloud hosted by the BSC consist of two types of computing nodes, AMD and Intel, which are summarized in Table 2. Each node AMD contains 8 cores, a physical memory of 32GB and a storage capacity of 800GB, while each Intel node contains 12 cores, a physical memory of 32GB and a storage capacity of 800GB. For both nodes is considered a VM representative integrated of four cores, 4GB of memory and 200MB.
Table 2. Simulation cloud infrastructure.
Element AMD node Intel node
Nodes
Physical, Memory, Storage
2-32
8, 32GB, 800GB
2-32
12, 32GB, 800GB VMs
Cores, Memory, Storage
2
4, 4GB, 200MB
3
4, 4GB, 200MB
Setup, Down 175 Sec, 03 Sec 85 Sec,02 Sec
Benchmark Applications We have implemented matrix multiplication bench-marking applications with the COMPSs programming model, this DAG is composed of n tasks in parallel with a chain of dependencies. We have executed them in the cluster and the runtime has detected the data dependencies and generated for each application a DAG of tasks.
For each DAG, we have generated three different sizes (small, medium and large) with different number of tasks. Moreover, each task has different duration, consumes a set of different resources, and has a different amount of data dependencies
Scheduler configuration. To generate the scheduling solutions the importance factor has to be selected, to indicate the importance of the energy versus performance and viceversa, and the heuristic rules to rank the priority of a task. The importance factor (α) can take any value between [0,1]. For the evaluation experiments, we have selected different importance factors from 0 to 1 with intervals of 0.1. Regarding the heuristic rules, four heuristics: LPT, SPT, LNS ans LSTF have been selected to classify the initial order of how the scheduler is going to allocate the tasks.
b.
Impact of the importance factor in the energy/makespan trade-off
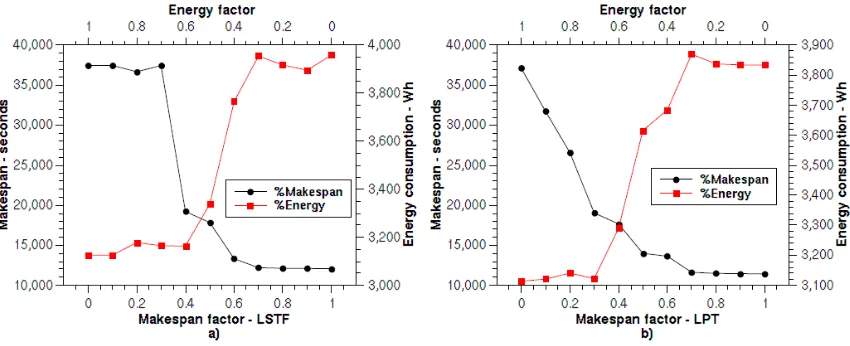
[image:6.612.93.518.452.625.2]The first topic we have studied in the experimentation is the trade-off between energy and time established by the variation of the importance factor. An example of this trade-off is depicted in Figure 5. In that figure, we can see the estimated makespan and energy consumption for the solutions provided by the scheduler for a matrix multiplication (MT) DAG of 800 tasks with different importance factor and applying two different heuristic rules LSTF and LPT. For a factor 1.0 of energy, which corresponds to a factor 0.0 in makespan, we are obtaining the minimum values of energy consumption and the maximum values of the makespan for both heuristics. Subsequently, when the energy importance tends to 0.0, and the makespan factor tends to 1.0, we observe that for both the heuristic rules, the energy consumption is growing to the maximum values and the makespan is decreasing to the minimum values of the makespan.
Fig. 5. Trade-off between energy and makespan.
wants to consider performance or energy (degrading considerably the other term) or select one of the intermediate values, where he can achieve energy saving within an acceptable makespan degradation.
Table 3. Energy consumption - Makespan per importance factor (α) and heuristic rule.
α
SPT LPT LNS LSTF
Wh Cmax Wh Cmax Wh Cmax Wh Cmax
1.0 3,140.3 37,834.4 3,113.6 37,138.0 3,128.5 37,527.4 3,125.9 37,458.8 0.9 3,140.3 37,834.4 3,120.6 31,744.2 3,128.5 37,527.4 3,125.9 37,458.8 0.8 3,140.3 37,834.4 3,140.5 26,598.5 3,181.7 24,208.1 3,177.7 36,675.3 0.7 3,195.7 32,390.9 3,122.6 19,039.0 3,133.5 23,325.6 3,165.0 37,440.2 0.6 3,153.1 35,640.5 3,289.7 17,666.9 3,132.8 19,013.9 3,163.0 19,215.1 0.5 3,183.3 19,607.3 3,616.1 13,990.5 3,578.9 14,469.8 3,338.6 17,842.1 0.4 3,375.4 18,399.9 3,683.6 13,633.8 3,755.8 13,067.8 3,764.6 13,319.0 0.3 3,282.1 18,753.7 3,869.9 11,629.1 3,837.1 11,659.3 3,954.4 12,198.3 0.2 3,827.4 13,701.0 3,837.4 11,482.8 3,811.0 11,651.2 3,917.0 12,124.5 0.1 3,985.7 12,349.4 3,834.1 11,458.0 3,848.8 11,569.1 3,895.8 12,101.6 0.0 4,024.8 12,521.1 3,833.6 11,425.6 3,838.8 11,453.3 3,958.7 12,076.5
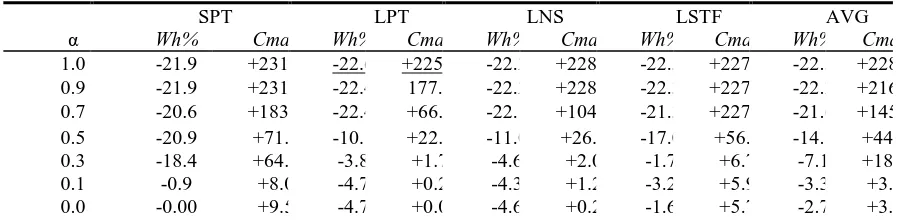
To illustrate it, Table 4 shows the energy savings and the makespan degradation for the different importance factor-heuristic combination. If we decide to save the maximum amount of energy in range 0.7 ≤ α ≤ 1.0, the scheduler can provide energy savings between -21% up to -22%, but paying a makespan increases between +145% up to +228%. If we decide by an average factor in range 0.3 ≤ α ≤ 0.7, the energy savings average is between -7% up to -21% with a smaller makespan increment (+18%). Finally, if we decide to not save energy in range 0.0 ≤ α ≤ 0.3, we could also get a small energy savings average is between -2% up to -7% by the selection of the correct rule, with a negligible makespan increment.
8
Conclusion and future work
In this paper, we have presented an energy-aware scheduling system for task-based applications. The scheduler aims at minimizing a normalized bi-objective function which combines the energy consumption and the makespan (total execution time). Those metrics are combined by an importance factor which enables users and service providers to indicate which is more important for their purposes: save energy or performance.
Table 4. Energy savings - Makespan degradation relationship per importance factor (α) and heuristic rule
α
SPT LPT LNS LSTF AVG
Wh% Cmax Wh% Cmax Wh% Cmax Wh% Cmax Wh% Cmax
1.0 -21.9 +231.1 -22.6 +225.0 -22.2 +228.4 -22.3 +227.8 -22.3 +228.1 0.9 -21.9 +231.1 -22.4 177.8 -22.2 +228.4 -22.3 +227.8 -22.2 +216.3 0.7 -20.6 +183.5 -22.4 +66.6 -22.1 +104.1 -21.3 +227.6 -21.6 +145.4 0.5 -20.9 +71.6 -10.1 +22.4 -11.0 +26.6 -17.0 +56.1 -14.8 +44.2
0.3 -18.4 +64.1 -3.8 +1.7 -4.6 +2.0 -1.7 +6.7 -7.1 +18.6
0.1 -0.9 +8.0 -4.7 +0.2 -4.3 +1.2 -3.2 +5.9 -3.3 +3.8
0.0 -0.00 +9.5 -4.7 +0.0 -4.6 +0.2 -1.6 +5.7 -2.7 +3.8
[image:7.612.82.533.504.616.2]We have implemented a prototype of this scheduler and we have evaluated MT DAGs. We have seen how the scheduler behaves depending on the selected importance factor and its relationship with the makespan and energy consumption. The outcomes of the algorithm show that a considerable energy amount can be saved, depending on the size of the instance. For Medium instance in the case of an energy importance configuration, it allows to save around of 22%.
Future work associated with the integration of the energetic model proposed with COMPSs, also the addition of formulation to calculate the monetary cost associated with the use of VMs and delivery times, with the aim of increasing the rates of return and profits for service providers.
9
Acknowledgements
The author 1 thanks the financial support to TecNM@ITSAT to present the work, the author 4 thanks the financial support to the CONACyT and Universidad Veracruzana and the author 5 would like to thanks to CONACyT-SNI the financial support in order to encourage quality research.
References
1. Anton Beloglazov, Jemal Abawajy, and Rajkumar Buyya. Energy-aware resource allocation heuristics for efficient management
of data centers for cloud computing. Future generation computer systems, 28(5):755–768, 2012.
2. Rajkumar Buyya, Anton Beloglazov, and Jemal Abawajy. Energy-efficient manage- ment of data center resources for cloud
computing: a vision, architectural elements, and open challenges. arXiv preprint arXiv:1006.0308, 2010.
3. Weiwei Chen, Rafael Ferreira da Silva, Ewa Deelman, and Rizos Sakellariou. Using imbalance metrics to optimize task
clustering in scientific workflow executions. Future Generation Computer Systems, 46:69–84, 2015.
4. Jonathan Koomey. Growth in data center electricity use 2005 to 2010. A report by Analytical Press, completed at the request of
The New York Times, page 9, 2011.
5. Francesc Lordan, Enric Tejedor, Jorge Ejarque, Roger Rafanell, Javier Alvarez, Fabrizio Marozzo, Daniele Lezzi, Rau¨l Sirvent,
Domenico Talia, and Rosa M Badia. Servicess: An interoperable programming framework for the cloud. Journal of grid computing, 12(1):67–91, 2014.
6. Akihiko Miyoshi, Charles Lefurgy, Eric Van Hensbergen, Ram Rajamony, and Raj Rajkumar. Critical power slope:
understanding the runtime effects of frequency scaling. In Proceedings of the 16th international conference on Supercomputing, pages 35–44. ACM, 2002.
7. Christy Pettey. Gartner estimates ict industry accounts for 2 percent of global co2 emissions. Dostupno na: https://www.
gartner. com/newsroom/id/503867, 14:2013, 2007.
8. Ilia Pietri, Maciej Malawski, Gideon Juve, Ewa Deelman, Jarek Nabrzyski, and Ri- zos Sakellariou. Energy-constrained
provisioning for scientific workflow ensembles. In Cloud and Green Computing (CGC), 2013 Third International Conference on, pages 34–41. IEEE, 2013.
9. Enric Tejedor and Rosa M Badia. Comp superscalar: Bringing grid superscalar and gcm together. In Cluster Computing and the
Grid, 2008. CCGRID’08. 8th IEEE International Symposium on, pages 185–193. IEEE, 2008.
10. Vivek Tiwari, Sharad Malik, and Andrew Wolfe. Compilation techniques for low energy: An overview. In Low Power
Electronics, 1994. Digest of Technical Papers., IEEE Symposium, pages 38–39. IEEE, 1994.
11. Fan Zhang, Junwei Cao, Keqin Li, Samee U Khan, and Kai Hwang. Multi-objective scheduling of many tasks in cloud platforms.