A thesis
submitted in partial fulfilment of the requirements for the Degree
of
Master of Engineering (Electrical)
in the
University of Canterbury
'by
P.J. BONES
CONTENTS
CHAPTER PAGE
ABSTRACT •••• " •••• It • It • • • • • • • • • • • • • • • • • • • • 1 ..
INTRODUCTION .•.•..•••...•...•....••••• 1.1 The Cardiovascular System .•••.•...
2. 2. 1 .2 The Development of Cardiovascular
Instrumentation .••..•••.•..•••. 10. 2 . ARTERIAL FLOW. . . , . . . • • . . . • .. • • • . .. 1
5 .
2.1 Rheology and Dynamics of Blood Flow15.
2.2 The Effects of Atherosclerosis onArterial Bloodflow . . • . . . • . . . . • . . • 21. 2.3 Blood Flow Measurement : The
Ultrasonic Doppler Flowmeter •••.• 25.
3.
A METHOD OF ASSESSING THE CONDITION OFATHEROSCLEROTIC ARTERIES . . . • • . . . • . . . . • 33 .
.
3.1 System Description. • • • . • . . • • . • • . . •• 34. 3.2 Digital Zero-crossing Detection ••••39.
3.3
Design Considerations .•.•.•••.••.••48.
4 • THE HEART. .. . " • 0. • • • • • • • • • • • • • • • • • • • • • • • (I • It 51 ..
4.1
The Performance of the Heart asa
Pwnp.o9... . . . ..
51.
4.2 Parameters of Heart Performance •••.
58.
5.
A METHOD OF CARDIAC EJECTION FRACTIONESTIMATION EMPLOYING A
SPECIAL-PURPOSE CALCULATOR •..••••.••...•.••.••
66.
5.1
Left Ventricular Volume Estimationfrom Cineangiocardiograms •••••••.
66.
5.2 Rectangular Rule Method-Employing Calculator ••••••..••••• 70.
5.3
Input Transducers ..•.•••••.••••••.75.
5.4
Errors of the C.E.F. Calculation ...79.
5.5
Results using the C.E.F.CHAPTER
6.
PAGE
THE DESIGN OF THE C.E.F. CALCULATOR ....••. 88. 6.1 Basic Description... 88. 6.2 Data Processing . . . • . . . • • . . . .
95.
6.3
Synchronous Control Unit (S.C.U.} ..• 104. 6.4 Construction Details •••...•••....• 111.7.
THE CARDIAC EJECTION FRACTION AS A GUIDETO SURGICAL PROGNOSIS ..•••...••... 111~.
7 "
1 Methode . . . • . . • . . . It • • • • • ., • • • • • • • 115 .
7 .
2 Re s ul t s . . . . iI • • 1$ • • • • • • • • • • • • • • • • 11 7 .7.3
Discussion . . . • . . . • • . • . . . 120.8. SUMMARY: CARDIOVASCULAR INSTRUMENTATION •• 124.
ACKNOWLEDGEMENTS ...•....•.•.•.•••.. 126.
REFERENCES. . . • • . . . . • . . . • . . . . .. • . . . • , It • • 1 27 •
1 •
ABSTRACT
A brief introductory treatment is made of the
physiology and instrumentation of the cardiovascular system. Two areas are singled out for further investigation.
Arterial blood flow is investigated. . In particular the effects of atherosclerosis on the pulse wave propagation through the arterial system are considered. A method for assessing arterial condition employing two ultrasonic
Doppler f10l\Tmeters is proposed. A digital zero-crossing detection system is suggested as a means of producing a relatively simple and inexpensive instrument to provide real-time results.
The performance of the heart as a pump and the
parameters used to assess this performance are considered. One such parameter is the cardiac ejection fraction, which relates the stroke ruld end-diastolic volumes of the heart's left ventricle. A new method of estimating left
ventricular volume from single-plane cineangiocardiograms is described. Called the Rectangular Rule, this method approximates the volume to a series of circular discs. A special-purpose calculator has been developed to
INTRODUCTION
1.1 THE CARDIOVASCULAR SYSTEM
The vital processes in living cells involve the utilisation o~ oxygen and nutrients and the simultaneous elimination of waste products. In the human body the cardiovascular system provides the means ~or this exchange to be carried out continuously, Blood, which contains oxygen, nutrients and waste products, is pumped around the system by the heart.
The heart contains ~our chambers (see Figure 1-1). The two atria act as 'primers' for the ventricles.
Deoxygenated blood returns ~rom the systemic circulation (head and body organs) and is pumped into the pulmonary circulation by the right atrium and ventricle. The pulmonary circulation consists only o~ the lungs, where the blood is supplied with oxygen and waste carbon
dioxide is removed. The oxygenated blood is pumped into the systemic circulation and back around the body by the left atrium and ventricle.
Systemic Circulation
In the systemic circulation, blood is ~orced at high pressures (around 100 mm Hg) throughout a large
J.
major importance in cardiovascular monitoring. The pulmonary circulation is operated at relatively low pressures and is there~ore less critical.
The left ventricle pumps blood into the aorta and thence into other large arteries. These subdivide into smaller arteries and ~inally into minute capillaries. Exchange o~ oxygen, nutrients and wastes between the body
tissue and the blood occurs by di~fusion through the
capillary walls. The capillaries recombine into venules and then into veins.
heart.
The veins finally return to the
Under steady state conditions the amount o~ blood flowing into the systemic circulation must equal the amount o~ blood flowing out. Thus the cross-sectional area and the flow velocity have an inverse relationship, as shown in Figure 1-2. Note also the change in
pressures throughout the circulation. Only a small pressure gradient is needed to drive the blood along the arteries, but a large gradient in the small vessels.
The blood vessels vary w'idely in construction as well as in size. The arteries have thick walls o~ muscle and elastic tissue to withstand the high pressures. The elasticity o~ the walls acts to convert the intermittant
~low of the aorta into the continuous flow o~ the
capillaries. Capillary walls consist only of a thin permeable layer o~ smooth cells. Since the pressure in the venous system is low, veins and venules have relatively thin walls. However, there is a muscular layer which
AREA CM2 600
200
100
ARTERIES VEINS
PRESSURE
mm
Hg
12
20
o~---~~============---Left
ventricle
FIGURE 1-2.
Systemic circulation
-->~
Rightatrium
Vessel cross-sectional area, blood
velocity and pressure in the
Blood
Blood consists mainly of a faintly yellow fluid -plasma - in which are suspended numerous cellular elements, the blood cells. These are of three types: red and
white blood cells and blood platelets.
The major function of the red blood cells is to transport haemoglobin, a complex compound which combines with oxygen. Enough haemoglobin is present for the
transport of 20 ml of oxygen per 100 ml of blood. Normal red blood cells are biconcave discs, about 8 microns in diameter and 2 microns thick. The total number present in the blood (haematocrit) is regulated closely and will depend largely on the degree of physical activity of the person.
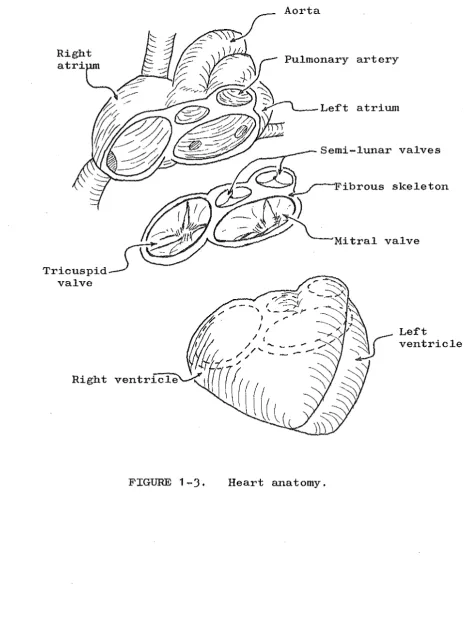
The Heart
The heart is constructed of two separated lattice structures of cardiac muscle, as shown in Figure 1-3. The two ventricles form one structure, the two atria the other. Fibrous tissue, supporting the four heart valves, connects
the two structures. The valves are essential to maintain the directional pumping action of the heart. The amount of work which can be performed by muscle is determined by the amount of oxygen delivered to the muscle. Therefore for the cardiac muscle to cope with the varying load
artery
/ n'''''
Semi-lunarCJ~I
valves_ _
I "
/~)
Fibrous k s eleton'-~~.-"'"~
Mitral valveRight
[image:10.595.56.529.129.749.2]Muscle contraction is stimulated by electrical impulses known as 'action potentials' which travel along the muscle fibres. Once excited, cardiac muscle remains in the contractile state for about 0.3 second. This allows time for the atria or ventricles to complete their contraction. Cardiac action potentials are produced spontaneously and rhythmically by a small piece of
specialised muscle in the right atrium known as the sino-atrial node. The impulse travels throughout the atrial muscle and then is delayed by the atrio-ventricular node which provides the only electrical path between the atria
and ventricles. The spread of the impulse throughout the ventricular muscle is aided by specialised conductive fibres, the Purkinje Fibres.
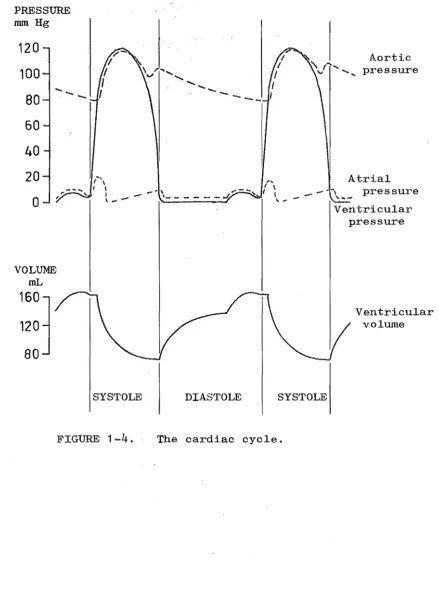
The cardiac cycle comprises a period of relaxation, called diastole, followed by a period of contraction, systole. Figure 1-4 illustrates the changes which occur throughout the cycle of a healthy heart. Blood flows continuously from the great veins into the atria (due to the venous pressure) and approximately 70% flows directly into the ventricles before the atria contract. Atrial contraction then causes the additional
30%
filling. Thus the atria act as primers for the main ventricular pumps. The onset of ventricular contraction causes asteep rise in ventricular pressure as the atrio-ventricular valves close (see Figure 1-4). An additional 0.02 - 0.03 second is required before the ventricular pressure becomes sufficient to open the semilunar valves against the bac~
PRESSURE
mm Hg
120
100
80
60
40
20
[image:12.595.98.538.169.759.2]o
...
-VOLUME
mL
160
1
120
80
~
t \
\ 1': ...
v ...
...
...
----I , .,....'" \ , _ ... ~
t ....
~..-
\- - - -
~SYSTOLE DIASTOLE
9.
Aortic pressure
"" Atrial
( \
I I~ ... _ _ - .-\... pressure
SYSTOLE
Ventricular pressure
Ventricular volume
blood begins to £low out, as evidenced by the sharp
decrease in ventricular volume. At the end o£ systole, ventricular relaxation begins suddenly, the internal
pressure drops and the semilunar valves close. While the aortic valve is open, aortic pressure £ollows
ventricular pressure. However, during diastole, with the valve closed, the pressure decreases as blood £lows along the aorta into the systemic circulation.
1.2 THE DEVELOPMENT OF CARDIOVASCULAR INSTRUMENTATION
From very early times, man has known something about his anatomy. He has been able to carry out postmortem examination on his less £ortunate £ellows; physicians throughout the ages have carried out at least elimentary surgery; £airly obvious parallels were made with the anatomy o£ other mammals. There£ore he soon established the existence o£ the cardiovascular system, and recognised its basic £unction o£ moving blood around the body. Studies o£ blood under the microscope supplied missing in£ormation on its relation with other
physiological systems, and the e££ects o£ various diseases on the blood and cardiovascular system were noted.
The amount o£ in£ormation the physician could gain £rom outside the living body, however, was severely limited. Without any diagnostic instruments, he could only palpate
(£eel with £inger tips) the pulse, listen to the chest directly with his ear and observe external symptoms.
11 .
but enable only a general assessment o£ the patient's condition. The need was evident £or some instruments to aid in monitoring the cardiovascular system.
The £irst instrument to appear was probably the stethoscope. The £amiliar instrument o£ today took some years to evolve £rom early 'ear trumpet' types. The stethoscope provides a mechanical ampli£ication o£ the vibrations reaching the chest wall £rom blood and valve movements o£ the heart. Spectral analysis techniques are now being used to glean more in£ormation £rom
phonocardiograms, which are recordings o£ the heart sounds. Although the £irst e££orts to measure arterial blood pressure were recorded in the 18th century, an indirect method £or the physician to use did not appear until early this century. The method employed an in£latable cu££ and mercury manometer. The cu££ was in£lated
around the arm until the pulse could no longer be palpated; this was taken as the systolic pressure. Then the cu££ was slowly de£lated until the observed oscillations o£
the mercury column reached a maximum; this was interpreted as the diastolic pressure. This technique is 1010wn as sphygmomanometry and the only major changes have been in the method o£ obtaining the diastolic pressure.
transducer at the extra-corporeal end of the catheter, or the transducer is mounted in the catheter tip. The former type lack the high fidelity of the latter, as a consequence of the fluid coupling, but can be used for other purposes (such as injections) simultaneously with pressure monitoring.
In 1791, Galvani recorded his experiments with frogs in which he found that the application of electrical
,
stimuli to muscle would evoke contractions. Most early research in the field was directed at responses to
stimulation, but eventually the galvonometer (named after the original researcher) became sensitive enough to
record potentials produced in muscle fibres between miniature electrodes. The development of the
electrocardiograph (E.C.G.) was of major importance in cardiovascular instrumentation. E.C.G. signals are
produced by currents induced in body tissue by the spread of the excitation potential across the heart muscle.
The recording of these signals is now a standard technique in cardiac monitoring. As well as the
standard 12-lead system of E.C.G. electrode positioning, systems have been devised which, either by analogue or digital means, produce a vector representation of the signals .19
The widespread use of x-rays in other fields lead to their Use in cardiovascular application. The
13.
blood vessel could be observed in detail by direct injection o~ radiopaque material. This process is
known generally as angiography. The addition o~ a ~ast
motion camera and T.V. monitor led to a ~ull cineangio-cardiographic ~acility capable o~ observing and
recording the heart pumping action and condition o~ the coronary arteries.
New Developments
A large proportion o~ new developments in cardio-vascular instrumentation have been directed towards two
~ields. The ~irst is that o~ non-invasive monitoring;
the aim has been to lessen the patient risk involved and the medical skill needed in per~orming monitoring
techniques. The second ~ield is in the analysis o~
measurements and recordings made, with development largely associated with the digital computer.
Probably the most signi~icant recent advance in non-invasive techniques has been in the use o~ ultrasound. Ultrasound instruments ~or observing the heart1s motion and condition in real time, and ~or recording instantaneous bl 00 d 4"1 ~ ows, are now 1n every ay use. . d
17,41
I n ne1 . th ercase is i t necessary ~or the patient to be subjected to any more discom~ort or trauma than that involved in a normal medical examination. Chapter 2 of this thesis investigates arterial blood ~low and the e~~ects of a
for detecting this disease.
CHAPTER 2
ARTERIAL FLOW
A much simplified model of the cardiovascular system is a closed system of 'pipes' connected by a 'pump',
For the system to operate effectively, the pipes must be clear of obstructions, and the pump must provide an
efficient conversion of energy into work and allow no backflow. The first of these factors, the condition of the pipes, mainly concerns the arteries. The flow through these vessels will be considered in this chapter.
2.1 RHEOLOGY AND DYNAMICS OF BLOOD FLOW
The analogy of arteries to pipes indicates that a suitable starting point in a discussion of blood rheology is to consider fluid flow through a pipe. Flow of the fluid occurs as a result of a pressure gradient along the pipe. The simplest analytical case is the ideal laminar flow of a homogeneous fluid in a smooth, rigid pipe.
be
t:::.
P along a length L of the pipe (see Figure 2 -1 (a)). The pressure gradient =t:::.
P/L. By considering a concentric cylinder of fluid, radius r, the velocity can be shown to be:u = (R2 _ r2) • . . • . • . • . . • . . . . • • (2 -1 )
where: R = pipe radius,
~
=
viscosity of fluid.(The derivation of this equation is completed in Appendix II).
Thus for this very idealised situ~tion, the velocity profile is parabolic (see Figure 2-1 (b)). Integrating across the pipe cross-section, the total flow rate can be found:
Q
=4 /j,P. if .R
B.L. ~ VolWlle/time . . . (2-2)
This is known as the Poiseuille equation. Note that, according to this equation, flow is proportional to radius to the fourth power. This in part explains the large difference between the total cross-sectional areas of the arteries and the capillary beds, and the pressure gradients involved (refer to Figure 1-2).
A fluid is defined as a medium which is unable to sustain internal forces at rest. The ideal fluid
considered above is a Newtonian fluid, in which the rate of fluid shear is proportional to the shear stress applied
(a) Fluid flowing in cylindrical pipe.
I---~L!(r,t)
(b) Velocity profile of steady laminar flow of a homogeneous fluid.
>
(c) A more realistic blood flow velocity profile.
rates of shear • The existence of a yield stress
(a stress below which no shearing occurs) has been suggested
6
and although this yield stress is probably extremely small in magnitude, i t may have significant effects in smallvessels. The non-Newtonian properties become insignificant at high rates of shear.48
The presence of a large percentage of red blood cells in the blood has a marked effect on the flow properties. Although the cells are flexible, they cannot sustain a
shearing action, so they tend to move to areas of low rates of shear. As a result they gather in the centre of the vessel. This has the effec·t of increasing the fluid
viscosity in this region and decreasing the viscosity near the vessel walls, producing a flattened velocity profile, as illustrated in Figure 2-1 (c). This profile is similar to that of a
~ingham
Plastic.48 The relative viscosityof blood is dependent on the haematocrit. The relationship
distension of the arteries as the pulse passes is only of the order of
5
to6%
of their diameter because of the unusual rheological properties of the vessels. 3719.
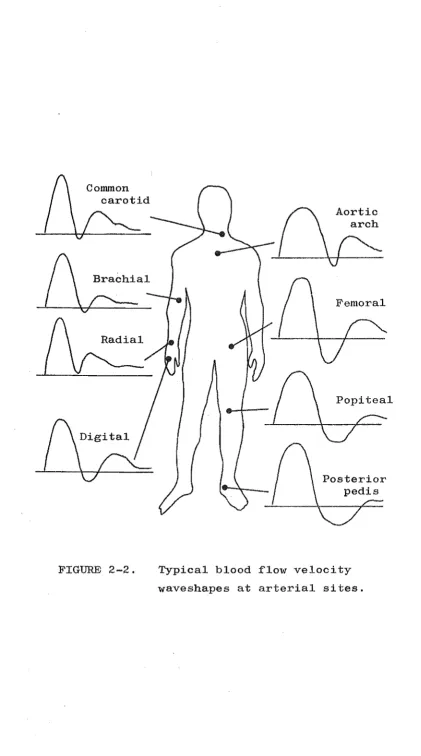
Figure 2-2 shows typical blood flow versus time recordings at various arterial sites.23
The two major factors affecting the pulse pressure waveform and propagation velocity are:
1. stroke volume output of the heart, 2. compliance of the arterial tree
(compliance is the inverse of elastance). Once the pulse has been produced, its propagation is then only affected by the latter factor and minor interference from
anatomical features (mainly reflections from junctions). In the absence of reflected waves, the value of c p ' the pulse wave velocity, is given by:
... "" .. (2
)
where: K
=
volume elastic modulus per unit length of artery,~
::: blood denisty.37The elastic modulus can be found in terms of the pressure and arterial dimensions:
K ::: PP. D . . . • . . • • . . . • . . (2
-h)
2. l':::.D
where: PP ::: pulse pressure,
D ::: inner arterial diameter at diastole,
Conunon carotid
Brachial
FIGURE 2-2.
Aortic
Femoral
Popiteal
Typical blood flow v~locity
[image:23.597.83.505.66.823.2]Good correlation has been obtained between expected and . 22 24
experimental results ~dr pulse wave veloc1ty. '
The pulsatile nature o~ blood ~low coupled to the very branched nature o~ the arterial tree has lead to investigations o~ the possibility of' turbulent ~low
occurring rather than laminar ~low. Just as some o~ the sounds o~ the phonocardiogram are de~initely caused by turbulence in ~low through the heart valves it is
reasonable to expect the same phenomenon in the arteries. The general concensus o~ opinion is that conditions ~or
21 .
turbulence occur, especially in the aorta where velocities are greatest, but ~ully developed turbulence may only
occasionally occur since the periods o~ peak velocity are short.
J7 ,48
2.2 THE EFFECTS OF ATHEROSCLEROSIS ON ARTERIAL BLOOD FLOW
Atherosclerosis is a disease, principally o~ the large arteries, in which ~atty deposits, known. as plaques, appear in the artery wall inside the inner layer o~ smooth cells. These plaques contain a large amount o~ cholesterol. As well as causing restriction o~ the space available ~or
blood ~low, the lumen, the atheromatous plaques are usually associated with degenerative changes in the arterial wall.
o~ten calcium precipitates to ~orm hard calci~ied plaques.
The result is general hardening o~ the arteries
I
(arteriosclerosis). Almost hal~ o~ all hwnan beings die
The first indication of plaque formation within the arterial wall is thickening of the inner layer (intima) and fragmentation of the inner elastic membrane. At this early stage, there is evidence of a slight increase in wall
distensibility~2,48
Once atherosclerosis is well developed, however, the intimal layer becomes fibrous resulting in an increase in the elastic modulus of the affected area. These changes occur to a lesser extent from normal aging, thus a plot of elastic modulus versus age shows a nearly linear relationship.32 Advanced stages of atherosclerosis are characterised by severe calcification of plaques. The wall distensibility is further decreased and the calcified plaques often protrude into the lumenal space.Atheromatous build-up is apparently particularly liable to occur in regions exposed to the full impact of the blood, such as at branches or points of abrupt
curvature, so that it is probable that some mechanism of fluid dynamics contributes to formation.
48
If this effect is due to turbulence occuring at these points, this may provide an explanation for the localisation of plaque formation. Angiographic investigations of patients with coronary arterial disease at The Princess Margaret Hospital have shown that plaques tend to be localised inthe majority of cases. The existence of turbulence
the probability of further build-up at that point, rather than at some other point along the artery wall. It is also possible that plaque formation is more likely at points "\oJ'here the arterial wall experiences maximum flexing. This is especially relevant to the coronary
23.
arteries where considerable flexing occurs with the heart movement.
The arterial wall hardening associated with
atherosclerosis has the effect of increasing K, the volume elastic modulus per unit length. Thus the same pressure changes cause less distension of hardened a:r·teries than of the equivalent normal arteries. A corresponding
increase in pulse wave velocity occurs, by Equation. (2-3), since the blood density is essentially constant. This increase in velocity occurs only in. the regions of
elevated K, so the distributed or localised nature of the plaque formation is a factor in the measured transit time across a artery segment. The blood flow 'wave form is also affected by both the wall elasticity of the vessels through which i t passes and the particular 'geography' of the plaque formation. Gosling ~ al. have documented these changes extensively with arterial segments of
varying atheromatous involvement.23 findings are shown in Figure 2-3.
Examples from their
If complete occlusion of' an artery occurs1
T:::T
norm
(a) A normal arterial segment.
n~·
V
~
C----I-=-=
~-==-~
)
T<T
norm
(b) General wall stiffening without marked narrowing.
(c) General narrowing and wall stiffening.
(d) Large plaques, but normal elasticity.
had to form, the collateral supply may be well formed or
I
only consisting of very small vessels. The velocity of pulse wave propagation is independent of the vessel
diameter, according to Equation (2-3)~ Therefore, assuming that the elastic modulus of the collateral vessels is similar to that of the main artery, the time 'taken for the pulse to pass the occlusion is mainly
dependent on the length of the collateral supply. A larger than normal transit time for the pulse across an arterial segment can thus be taken as an indication of an occlusion.
Equation (2-2) shows that the actual flow occurring as a result of the passage of the pressure pulse is very dependent on the vessel diameter. Thus small collateral vessels will show a la~ge resistance to flow, causing severe damping of the flow waveform. These effects have also been well documented (by correlating results with angiographic findings), and examples are shown in Figure 2_4.23
2.3 BLOOD FLOW MEASUREMENT THE ULTRASONIC DOPPLER FLOWMETER
The measurement of blood flow is a much more difficult task than the measurement of blood pressure.
25.
T<70ms
(a) Short and wide bore collateral supply.
n~
V
'. :~ .. ', ~ : ... ; ~ :4 '.,~. ,,', .. :.'
.. .
.
~ ..., "~'. '.~. ... '
.' .
T<70ms
'''':' ..
(b) Short and narrow collateral supply.
"
.
' .. '(c) Long and wide collateral supply.
. . . '
..
: ' . ~ ~ ~"
,.-. ~ ;:. , .
. . . . • T "
.
".
.
; .. ..'
) , .. '(d) Long and narrow c.ollateral supply.
T>70ms
T>70ms
FIGURE 2-4. Effect of occlusion with collateral supply on waveshapes and transit times
27.
in flow with high fidelity, was the electromagnetic
flowmeter, invented by Kolin in
1936. 33
This instrument has become one of the most widely used types of flowmetersalthough i t is relatively invasive. A cuff transducer must be placed around the vessel to be measured, or a catheter transducer used.
The flowmeters which appear to have the most future as non-invasive instruments are of the ultrasonic Doppler
41
.
type. Many commercial ultrasonic Doppler flowmeters are available which allow the transcutaneous monitoring of flow velocity. The simplest of these generate
continuous ultrasonic waves and receive back-scattered reflections with a double piezoelectric crystal transducer. Aspects of the operation of this continuous-wave Doppler flowmeter are considered in the following.
Ultrasonic Doppler Signals
The ultrasonic Doppler flowmeter was first described 20
in
1961
by Franklin. Conceptually, the operation is straightforward. Consider Figure 2-5, ,..rhich shows a flowmeter probe directed transcutaneously at an artery. The frequency shift of the ultrasound reflected frommoving blood cells in the artery and received by the probe is described by the Doppler shift equation:
6.f
=
2uF cos Q •••••••••••••••••••••• (2-4) cBlood vessel
FIGURE 2-5.
I
(f)
Flowmeter probe
I
1'/' ,
I I
I '
I
,
Transmitting f'requency
=: F
1/' "
I ,I Velocity of' sound
, in tissue =: C
Operation of' the ultrasonic
Doppler f'lowmeter.
Single Doppler component
I~
~<~---~~ Movement with time
6f(t)
f
FIGURE 2-6. Doppler amplitude spectrum produced by unif'orm blood
Q
=
angle of inclination to the direction of flow, c=
velocity of sound in body tissue (approximately1500 m/sec),
u
=
magnitude of blood velocity.The choice of transmitting frequency, F, is based on a number of factors. The absorption of ultrasound
29.
as i t passes through body tissue is dependent on frequency; the higher the frequency the more the absorption per unit distance. The sensitivity of the Doppler flowmeter to
changes in blood velocity is directl.y dependent on F;
by equation (2-4), 6 f is proportional to F.u for given Q.
Thus the choice of F is a compromise between maintaining a satisfactory signal-to-noise ratio (lower absorption means greater reflected signal returns) and satisfactory sensitivity. The normal range of frequencies used for Doppler flowmeters is
5
to 10 MHz.Demodulation of the received si~lal from the flowmeter probe is necessary to recover the Doppler
flowmeter system and the strength of the reflected signal. If the single velocity of the blood is made a function of time, then the frequency of the Doppler component will become a corresponding function of time, ~f(t), but the amplitude has no cause to change. This is illustrated in Figure 2-6.
Effect of Velocity Profile
Clearly the single velocity blood flow considered above is not a real situation; the range of velocities which occurs across the blood vessel gives rise to a
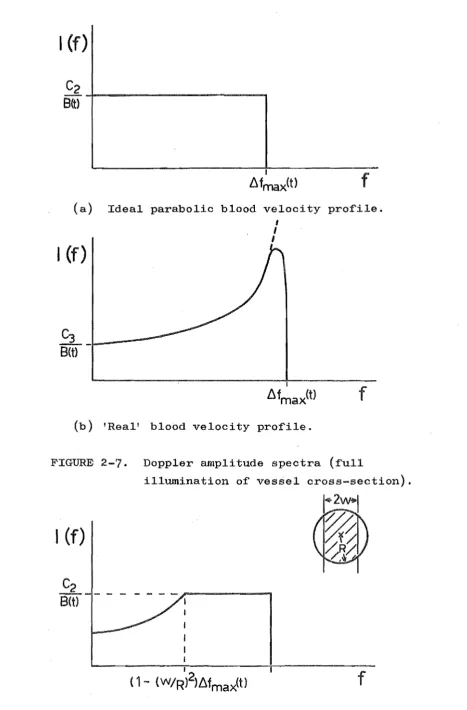
Doppler frequency spectrum. Each frequency in the spectrum corresponds to a velocity, and the amplitude of the spectrum at that frequency is a function of the proportion of blood cells moving with the associated velocity. The ideal homogenous fluid flowing in a pipe, considered in
Section 2.1, has a parabolic velocity profile, which can be shown to give rise to a flat frequency spectrum (see Figure 2-7(a». Since the number of reflecting blood cells 'illuminated'. by the ultrasonic beam at any tilne is essentially oonstant, the area under the amplitude spectrum remains constant as velocities change with time. These results are derived in Appendix III.
The real velocity profile occurring in arteries
differs from the ideal parabolic profile (see Seotion 2.1), and therefore the flat Doppler spectrum is modified.
I
(f)
f
(a) Ideal parabolic blood velocity pro~ile.
I
(f)
I
I I
(b) 'Real' blood velocity pro~ile.
J 1 •
FIGURE 2-7. Doppler amplitude spectra (~ull
illumination o~ vessel cross-section).
I
(f)
. I
(1- (w/R)2}b.f
max
(t)f
[image:34.595.69.537.68.779.2]in the number of reflecting cells with these velocities and a corresponding peak in the amplitude spectrum
(see Figure 2-7(b) and Appendix III).
Effect of Beam Width
The spectra discussed above have been derived considering that the entire cross-section of the blood vessel is illuminated by the ultrasonic beam. However in many cases this is not the case as the artery may be relatively large, and flowmeter probe developments have resulted in narrow beams. If a narrow beam is centred on a vessel with a parabolic profile, the spectrum
produced is shown in Figure 2-8. Since less of the outer, slower blood cells are illuminated by the narrow beam,
while the contribution from the highest velocity cells is retained, the spectrum is biased towards the frequencies in a band below
D.
f .max
in Appendix III.
CHAPTER 3
A METHOD OF ASSESSING THE CONDITION OF ATHEROSCLEROTIC ARTERIES
Atherosclerosis, in its severe forms, is recognised as being responsible for a large percentage of premature deaths. The gradual development of symptoms as a result of the gradual accumulation of atheromatous material has meant that detection usually only occurs at a relatively advanced stage. The early stages of the disease can be expected to be reversible to .some extent, so great
importance must be placed upon methods of early detection. Some methods of arterial investigation, notably
arteriography (angiography) and plethysmography, have been in use for some time, but are not suitable for performing this early detection. Arteriography is an excellent method of locating well-formed plaques, but involves exposing the patient to a relatively large radiation
The effects of atherosclerosis on the pulse wave velocity and shape have been discussed in Section 2.2, and the Doppler ultrasonic flowmeter in Section 2.3. A method has been described by Gosling a • 1 22,23 w h' h 1C
-employed two Doppler flowmeters to monitor changes in the pulse wave as i t moved along a selected artery. The Doppler signals were recorded on analogue tape and processed off-line. Two parameters, the propagation time of the pulse between the two sites and the
"pulsatility i.ndex" of the two waveforms, were derived and correlated with results obtained from angiograms. The results were encouraging. The following is a description and analysis of a proposed system to apply
the same method by different techniques. 'l'he purpose is to simplify the diagnostic procedure and give the clinician an immediate result, while using a relatively inexpensive and uncomplicated instrument. Since the development of the system has not reached the stage of circuitry design or construction, this chapter is limited to description and analysis of the system operation.
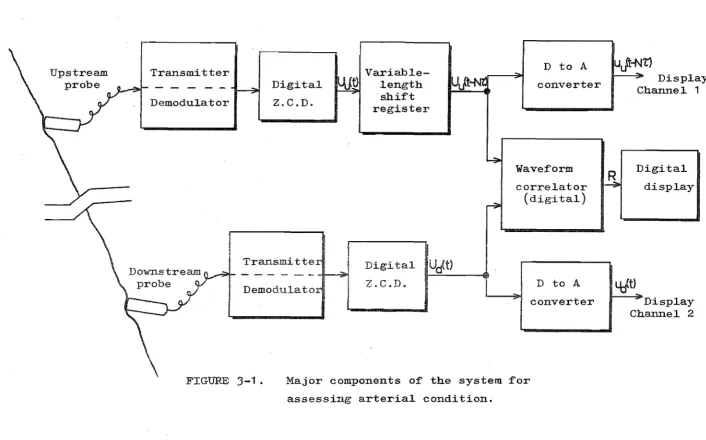
3.1 SYSTEM DESCRIPTION
Upstream probe
Transmitter Demodulator
Digital Z.C.D.
Transmitte
- - - 1 ;ll>I
Demodulato
Variable-shift
ter
iUJ~
Digi tal
IUJt)
!
Z.C.D.D to A converter
Wavef'orm correlator
(digital)
D to A
[image:38.842.60.766.68.507.2]converter
FIGURE
3-1.
Major components of' the system f'or assessing arterial condition.IUJt-Nt)
R
Display Channel 1
Digital display
~
DisplayChannel 2
W
(the lower frequencies give better penetration for
observing deep arteries). The received signal from each
probe is first demodulated, the result being a signal
containing a spectrum of frequencies in the range 0 to
10 kHz, as discussed in Section 2.3. A digital
zero-crossing detector'
(Z.
C. D.) is used to sample arepresentative frequency I1fc' from the Doppler signal,
proportional to the blood velocity. The detector counts
the number of zero-crossings in a preset sample time.
Identical detection systems are used for both f10wmeters.
At the end of each sample period (length,
?::
seconds), two numbers, one from each detector, are stored in a latch.The number from the upstream flowmeter, U , is shifted
u
into the left end of a variable-length shift register.
If the shift register is set to a length of N words, the
rightmost word of the register at any instant t is U u
( t-N '(;') . This word can be compared to the present sample
of the downstream flowmeter, Ud(t). If N is set so
that the leading edges of the delayed upstream pulse
(corresponding to a sharp increase in U (t-N"l:"» and the
u
real-time downstream pulse coincide, then N'l:' is the time
delay of the pulse propagation between the two f10't.,rmeter
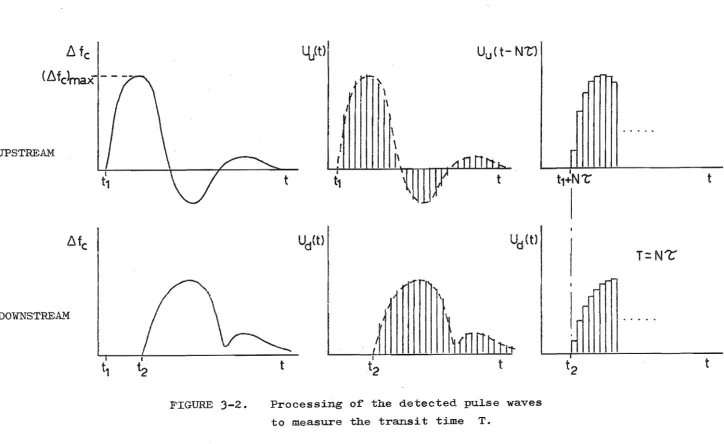
sites. This process is illustrated in Figure 3-2.
Clearly, since
?:
must be of finite size, then N'1::' is only an approximation to T.An. analogue display of the detected velocity
6
fc
(6f
c>max-'- -
--UPSTREAM
l.\
fc
DOWNSTREA-'M
t,
FIGURE 3-2.
4}t}
t
Ud(t)
t
f
f
I
t1
':!..
1\
\
\
1\
n
11
I
t2
(t-
N't1
Ud(t)
t
Processing of the detected pulse waves to measure the transit time T.
I t1+N'L
T=N1:
t2
t
t
W
[image:40.842.39.763.57.501.2]converters. A final low-pass filter on each channel will give a continuous curve for observation by
oscilloscope, or recording by pen recorder. Thus the operator can observe the output waveforms on the
oscilloscope, adj\lst N manually until the leading edges coincide, and read T = N't' of'f' the dial.
As well as evaluating the transit time of the pulse wave between the two arterial sites, further information on the condition of the artery can be obtained from a comparison of' the velocity waveforms. Ohanges in shape are related to the degree of arterial wall hardening and lumen obstruction as discussed in Section 2.2, and
illustrated in Figures 2-3 and 2-4. Gosling et al.22,23 used a digital computer to analyse the waveforms, the pulsatility index being based on harmonic content. It would be advantageous to be able to perform the comparison in real time at the bedside. This is possible with the system described here.
The displayed outputs from the Z. O. D. I S after D to
A conversion are single line functions in time and so can easily be compared by eye on the oscilloscope. However, since a sampled digital representation of the waveforms is available at the outputs of the Z.O.D. IS, a
"correlation factor", R, is given by:
If there are m samples taken in each beat period, then this integration can be achieved with the sampled data by:
Clearly, R is only a significant correlation factor if the time delay, N"t", is properly adjusted to be equal to the transit time, T. Also some normalisation of the waveforms is necessary. This could be achieved by adjusting the flowmeter gains until the displayed peak velocities approximate to a datum line on the oscilloscope
screen.
3.2 DIGITAL ZERO-CROSSING DETECTION
Zero-crossing detection is a method of deriving a representative frequency,
a spectrum of frequencies.
/j. f , from a signal containing c
It is only possible to retain a small amount of the information contained in an unknown signal with a Z.C.D. The frequency, /j. f' , is equal
c
to half the number of zero-crossings of the signal (in the time domain) per unit time, and can only be obtained by averaging the signal over a finite time interval.
However, if the signal's amplitude spectrum, I(f), is
39.
The received signal from the continuous-wave ultrasonic Doppler flowmeter, after demodulation, has been shown to have an amplitude spectrum dependent on the blood velocity profile across the observed vessel and on
the beam width (Section
2.3).
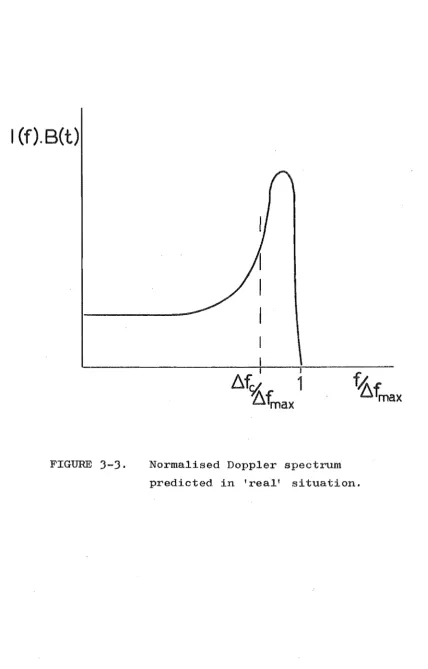
The magnitude of the mean (and maximum) velocity is a function of time, sincearterial flow is pulsatile, but the profile is approximately constant. A constant shape of amplitude spectrum results. The time dependence of the velocity can be considered as an independent function, B(t) and the amplitude spectrum normalised as shown in Figure
3-3.
Both the effects of flattened velocity profile and narrow flowmeter beam produce accentuation of the higher frequencies i l l the Doppler spectrum (refer to Section2.3),
as shown in Figure3-3.
This spectrum is similar to that found experimentally by spectral analysis.50 Thus the signal processed by the Z.O.D. has an amplitude spectrwn with predictable shape and with spread along the frequency axis governed by a function of time.18 50
Flax et a l . ' have suggested that by:
b.f c
=
b.f is given c
I (f).B(t)
FIGURE
3-3.
Normalised Doppler spectrum predicted in 'real' situation.f'i1ter, with b.f' corresponding to the cutof'f f'requency max
of' the filter (see Figure 3-4(b)). Substituting into
equation (3-2) gives:
t:"
f'maxJ
b.f2B
t
f:j f'max df' f'
=
0c
{j,f'
f
max B df'75l
f'max0
=
b.
f'maxlJ3
With f'i1ter cutof'f's ranging f'rom 1 kHz to 10 kHz, results ranged f'rom
!:.l
f' c =0.570
!:.l
f' max to(1
I
j3
:i=0.577).
Thus good experimental verif'ication of' equation (3-2) was f'ound.Applying equation (3-2) to the 'real' amplitude
spectrum of' Figure 3-3 can be expected to give a dif'f'erent
coef'ficient, relating f:jf' to A f' but one which is'
lJ max' c
constant provided the spectral shape is constant. A
coef'f'icient of'
0.7
to0.8
appears likely.Errors in
b.
f' Estimationc-There are a number of' restrictions on the f'idelity
of' the digital Z.C.D. output. The f'irst of' these is the
inherent error in the measured
t:"
l' ..c This error can be
considered to be caused by statistical Inoise' in the
output. Flax ~ a1. 18 have analysed this noise f'or the
analogue Z.e.D., which uses a 1m\" pass f'i1ter to convert
Noise
-""
generator ~
(G.E.C.)
Digital counter (Davco-TTL input)
Low;
pass filter (Krohn-Hite)
TTL buffer
/
~
\
Oscl.lloscope Channel 2
Osc
..
Cha
\
High gain comparator
(a) Digital Z.C.D. test system.
I(f)
I
fcutoff
(::L\fmax)
f
[image:46.595.75.523.102.746.2](b) Spectrum produced in test system.
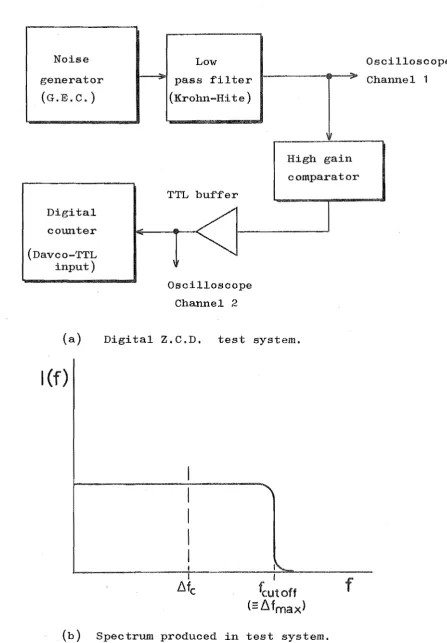
FIGURE 3-~,. Experimental evaluation of the digital Z.C.D.
43.
if' the time constant is large, . the output voltage \\l"ill
tend to an accurate representation of'
IJ.
f' , as long as cIJ.
f' does not change rapidly.c This corresponds to a
long sampling (counting) period of' the digital Z.O.D.
Similarly if' the time constant/sampling period is small,
the output will be able to f'ollow rapid f'luctuations in
~ f' , but any instantaneous estimation of'
IJ.
f' can bec c
expected to be in error.
Zero-crossing detection of' white noise results in a
random pulse train, which can be described statistically
by a Poisson distribution. For an analogue Z.O.D.,
the mean and standard deviation of' the output is given
by:
where: band·
f'
= mean and standard deviation of' the1J.f' estimations, c
18
=
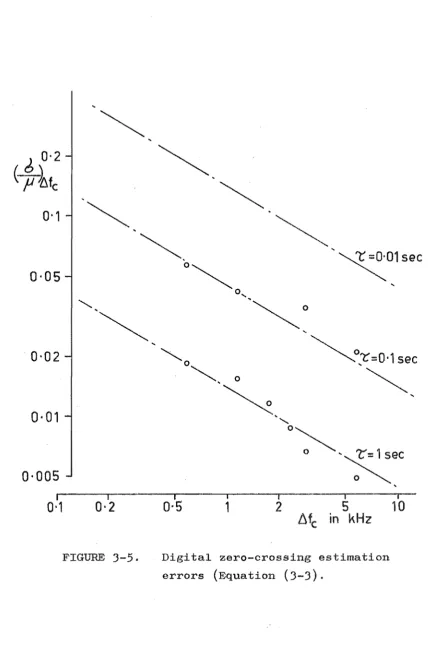
time constant of the Z.C.D.Experiments carried out with a digital Z.O.D. (the test
system of' Figure 3-4(a» show that similar relations
hold wi th ~ replaced by the sample time,
'T
Figure3-5 is a graph of' the results, which indicate that the
f'ollowing approximate relation holds:
0-2
(
t~fc
0-1
0-05
0-02
0-005
I
0-1
~
~
~
~
~01sec
~o:r=O'1
sec
~
I I I I I I
0-2
0·5
1
2
5
10
[image:48.595.74.511.117.773.2]Llfc in kHz
The assumption of the Doppler signal being band-limited white noise is a worst case in relation to errors in
The modifications to the amplitude spectrum, causing
accentuation of the high frequencies, effectively restrict the error, with ~ f constrained wi thin the peaked region.
c
It is evident also, from Figure
3-5,
that the largest error in ~ f c is likely at low values offj,
f corresponding toc
low velocities. The application of the digital Z.C.D.
suggested in this chapter is mainly concerned with observing the higher velocities during the passage of the pressure pulse. Thus the error is unlikely to cause significant output signal degradation.
Bandwidth Considerations
The Z.C.D. output depends on the whole frequency spectrum up to
IJ"
f .max Therefore the instrument bandwidth must be sufficient to allow for the maximum blood velocity which is likely to occur. An empirical value for this is 8 times
u,
the mean flow velocity over one cycle (mean flow18 divided by vessel cross-sectional area). frequency component is:
-2 F u cos Q
(
~fmax)max
= 8 cThus, the maximum
For a transmitting frequency (F) of 5 MHz, Q of 450 and
u
of 40 cm/sec (large artery), the resultant maximum ~fmax is approximately '15kHz. The amount of random noise present will depend on the bandwidth, so maximum signal-to-noiseminimum required. The effect of too much restriction will be clipping of the Z.e.D. output peaks.
The artifacts caused by "wall thump" have been cited as a major restriction on the use of a Z.e.D. for Doppler
23
signal processing. Low frequency Doppler signals arise from ultrasound reflections, from the interface of the arterial wall with blood and with surrounding tissue, due to the vessel distension with pulse passage. The addition of a high-pass filter to the output of the demodulator, with sufficient stop band to attenuate these low frequency
4r
,
"1.
artifacts, will not degrade the digital Z.e.D. output except at very low flow rates. So, wall thump should not impose any restriction on the application of this method.
The digital Z.e.D. is conducting a sampling of the Doppler signal, which contains information on the flow velocity as a function of time. Essentially, therefore, u(t) is being sampled, and the requirements for minimum sampling rate must be satisfied for fidelity of the output. Each sample takes time ~ to compute (count) yet the result
is a single number (the total number of zero-crossings in that time) and so can be considered equivalent to an
instantaneous sample taken at the 7:/2 time. This does not infer that perfect sampling is taking place, sinc~ there is uncertainty associated with the IJ.f' estimate.
c
maximum frequency component which can be recovered
The
independent of the Doppler bandwidth) is governed by the time between samplest which may be made nearly equal to ~.
3.3
DESIGN CONSIDERATIONSThe advantages of the proposed systemt employing a
digital zero-crossing detector for the purpose of assessing atherosclerotic arteries, lie in its simplicity and ability to produce useful resultst in real time, at the bedside. To ensure the simplicity of the design and yet preserve an
accurate output, careful choice of design parameters must be made. Some of these parameters are considered below.
Demodulator Bandwidth
Restriction of the demodulator bandwidth is necessary at low frequencies to remove wall thump artifacts from the Doppler spectrum, and at high frequencies to gain the maximum signal-to-noise ratio. The frequencies concerned can be expected to be in the vicinity of 200 Hz and
15
kHzrespectively, but need to be accurately determined. It would be advantageous to have these values adjustable according to the particular vessel under observation and the age and condition of the patient.
Sample (Count) Time, ~
(T ~ N 7: ), the minimum velocity resolution and the proli£eration o£ digital hardware.
Both the statistical error in the 61: c estimation and the output bandwidth restriction (due to insu££icient sampling rate) will cause degradation 01: the output wave£orm. The statistical error decreases with increasing ~ and with increasing
increasing
A 1:' the sampling restrictions increase with
Ll c'
!C.
The method relies on the comparison o£ wave1:orms during the pulse passage, when velocities are greatest, so the higher Doppler shi£t £requencies can be considered o£ maximum importance. This would suggest that'7:: selection is best made on the basis 01: u(t) bandwidth ( /). £ c errors are least at high
fj
£ ). c For example,~= 10 msec gives a theoretical u(t) bandwidth o£ 50 Hz. The error in /). £ c estimation (based on the worst case o£
a £lat amplitude spectrum, Equation 3-3) is then:
The same choice o£
"t"
("10 msec) ,dll achieve a resolution o£ 10 msec £or the T estimation (£ound to within!5
msec). The minimum velocity resolution corresponds to the minimum £requency o£ zero-crossings which will produce just 1crossing during time ~, so:
( /). 1:)
=
1/'t'
=
1 00 Hz. c. minmaximum frequency of zero-crossing to be handled. For
C;
= 10 msec, 1\ f=
1 5 kH z, and 1\ fU max U c
0.75
L j 1\ f max ,the maximum number is 2250, corresponding to a capacity of 12-bits needed for each channel.
Shift Register Size, N
The shift register is used to store a series of words sequentially, acting as a variable-length buffer. The
maximum register length, N words, must be sufficient for
max
the maximum pulse transit time expected, T
max Thus:
The results of Gosling et
~.2J
suggest that allowing for T :;;;: -100 msec would be adequate.max For
1:'
== 10 msec,N :;;;: 10, so the necessary shift register capacity is max
10 x 12-bit words.
D to. A Converter Filter Cutoff
A converter suitable for transforming the digital Z.C.D. output into an analogue waveform for display, is the weighted resistor, summing amplifier type. A low-pass filter is needed to smooth the resulting stepped waveform. The maximum frequency component of u(t) able to be recovered
.51.
CHAPTER 4
THE HEART
The heart must per£orm its pumping action continuously since cessation £or only a short time means certain death. The pumping action can be monitored in many ways and many parameters o£ per£ormance measured. These parameters enable correct diagnosis ~ld accurate location o£ lesions to be made. In deciding whether surgery is the appropriate course o£ treatment £ora patient with an ailing heart,
however, the cardiologist needs some indication o£
post-operative prognosis ( the probable success o£ the operation). The £actors a££ecting the heart's per£ormance and some o£ the most use£ul parameters (including the C.E.F.) are considered in this chapter.
4.
1 THE PERFORMANCE OF THE HEART AS A PUMPIntrinsic Autore~lation
The Frank-Starling Law27 states that: the greater the heart is filled during diastole, the greater will be the quantity of blood pumped into the aorta during systole. Thus the heart can adapt to a widely varying input of blood.
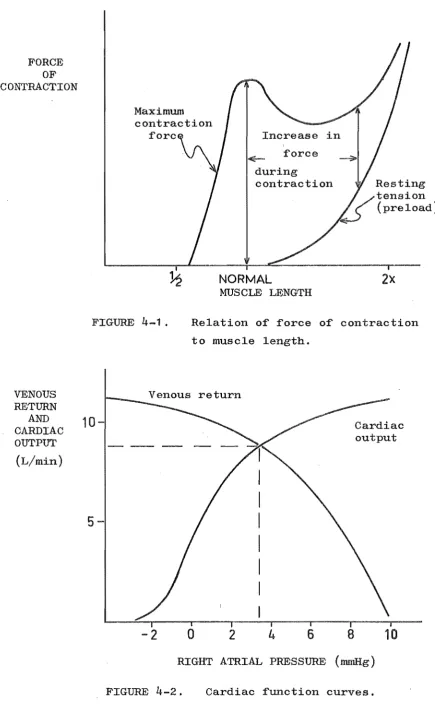
The primary mechanism for this autoregulation can be seen in the relationship of muscle length to muscle tension, arising from feedback in the contracting microsystem (see
When the muscle is at its normal relaxed length at the end of diastole, the contracting force starts at the maximum available and decreases as the fibre lengths decrease. If, however, the heart is filled to a greater extent, the muscle will be stretched at the begimLing of.
systole, with some resting tension (preload). As contraction occurs, a large contracting force is available over a greater range of length, thus more work is performed and a greater amount of blood is ejected.
An important consequence of the autoregUlation
mechanism is that the heart function is almost independent of the aortic pressure (afterload). Also i t allows other body organs to control their blood supply by simply altering
their vascular resistance to flow and thus the venous return.
Control by Nerves
The heart is supplied with two types of control
FORCE OF CONTRACTION
Maximum
Increase in force during
contraction
NORMAL
MUSCLE LENGTH
2x
FIGURE 4-1 . Relation of force of contraction to muscle length.
VENOUS RETURN
CA~~AC
10-OUTPUT (L/min)
5-Venous return
-2
o
2
4
6
8
Cardiac output
10
[image:56.595.52.488.75.798.2]RIGHT ATRIAL PRESSURE (mmHg) FIGURE
4-2.
Cardiac function curves.act to modify the electrical stimuli to the heart muscle. Stimulation of the sympathetic nerves causes an increase in the rate of the S-A node and an increase in conduction in the A-V node. As a result the heart pumps faster and with increased force of contraction. Parasympathetic stimulation has essentially the opposite effect. Very strong action of the latter nerves may cause the heart to stop for a short period.
Cardiac function curves are used to predict the
response of the heart to both external and internal changes. The curves of venous return and cardiac output are related
to the right atrial pressure, which is essentially the preload (see Figure 4_2 27 ). The steady state operating point of the heart function at any time is the point of intersection of the two curves, since the rate of flow into the heart must equal the rate out (averaged over a cycle).
Heart Malfunctions
There are three main types of heart mulfunctions. They are: malfunctions relating to
(1) excitation mechanisms, (2) valves and
(3)
muscle.These three, their effect on pwnping action and their surgical treatment, will be considered briefly here.
(1) Excitation mechanisms. Excess dilation
or ventricles to contract rapidly. The lower frequency and coordinated contractions (up to 200 or 300 beats per minute) are called flutter and very high frequency and random contractions, fibrillation. These malfunctions
55.
result from the one action potential re-exciting muscle which has had time to relax from the contractile state. Pumping action may be seriously impaired or lost altogether i f these conditions persist. Consequently, one quarter of all persons die in ventricular fibrillation.27 A very large pulse of direct current passed through the ventricles can stop fibrillation by simultaneously exciting all the muscle (defibrillation).
Another excitation malfunction, atrioventricular block, occurs i f the action potentials are prevented from reaching the ventricles from the atria. The Purkinje fibres will then excite the ventricles spontaneously, but at a
much lower rate
(15
to40
times per minute) andunsynchronised with the atrial rhythm. The cardiac output is clearly reduced by the low beat rate and lack of
coordinated priming by the atria. An inserted electronic pacemaker may be used to relieve this condition.
Valve malfunction. Efficient heart functioning relies much on the operation of the A-V and semilunar valves
pressure drop. These conditions are known as incompetence and. stenosis, respectively, and may occur singly or together in any of the four heart valves.
Since backflow occurs ,,,hen a valve is incompetent, a heart with this malfunction must expend more work to achieve normal cardiac output. Similarly a stenotic valve demands more cardiac work. Thus these hearts tend to have
considerably thickened muscle. They also tend to become dilated to achieve maximum effect from the Frank-Starling mechanism. Malfunctioning valves can be repaired in some cases, but the success achieved with implantable valve
prostheses has meant that replacement is often the preferred treatment.
(3)
Muscle malfunction. Diseases of the heart muscle are known as myocardial diseases. These diseases directly effect the contractility of the muscle. The most common is ischemia (insufficient blood supply) caused by occlusion or thrombosis of the coronary arteries, resulting from atherosclerosis (described in Section 2.2). When the blood supply to cardiac muscle is diminished beyond acritical level, the muscle not only becomes nonfunctional but actually begins to die. This occurs in a matter of
hours in total ischemia. Dead muscle is replaced by fibrous tissue which tends to stretch, instead of contract, during systole.
per~ormed per beat ~rom a given end-diastolic volume. The Frank-Starling mechanism compensates by increasing venous return and thus the end-diastolic volume, and
57.
attempts to return the cardiac output to normal. The success of this depends on the area and condition o~ the diseased
muscle. I~ good collateral blood supplies to the ischemic area have had time to form, the compensation may maintain normal cardiac output. However, the heart will remain in a dilated state and will not be able to cope with large transient ~luctuations in demand, and is always susceptable
to ~urther disease. Secondary e~~ects o~ myocardial
disease may also occur: excess dilation o~ the heart provides the conditions ~or the occurrence o~ ventricular
~ibrillation and a branch o~ the Purkinje ~ibre conduction
system may be blocked i~ it passes through a diseased area. Surgical techniques are now available ~or treatment
o~ som~ patients with myocardial disease. Bypass gra~ts
can be made to the coronary arteries to restore blood
supply to ischemic muscle areas. As well, areas o~ dead muscle may be removed and the edges o~ good muscle areas rejoined. These surgical operations require the action
o~ the heart to be taken over by an external mechanical system and involve considerable trauma to the patient,
there~ore only patients with a considerable amount o~
4.2 PARAMETERS OF HEART PERFORMANCE
The evaluation of new and existing parameters of heart performance, and their methods of measurement, has been the subject of much recent research. The standard measurements and tests carried out will probably indicate
the existence of a heart malfunction once i t is relatively well established, but may not enable the cardiologist to make
a precise diagnosis. For example, increased heart size, elevated diastolic pressure and a low cardiac output at
rest are well known and characteristic Cindings in left ventricular failure. HO'wever this failure may have resulted from one or a combination of many causes, and, before failure symptoms appeared, there may have been no indication of how well the compensatory mechanisms were coping. For these reasons, new parameters of heart
performance have been suggested and a summary of these is made below. All the parameters relate to the left
ventricle (L.V.).
Stroke Volume (S.V.)
The stroke volume is the difference between the volume of blood contained in the L.V. in diastole and in
59.
act to restore a normal C.O. Together, however,S.V. and CD. are of use in the diagnosis of valvular disease. Significant differences found between C.O. and S.V. x H.R.
(H.R. is the heart rate), where C.O. and S.V. have been obtained independently, is evidence of the occurrence of regurgitant flow. The regurgitant flow volume per beat is given by:
VR
= (
S.V. x H.R.) - C.O.In practice, C.O. can be measured by the Fick expired
air method or dye dilution method, and S.V. by angiography or ultrasound time-motion stUdy.1
7
,25 ,40
End-diastolic Volume (V n)
The end-diastolic volume is the maximum volume of blood the L.V. contains during the cardiac cycle. Vn
(and C.O.) are often normalised to the patient's body surface area and expressed in units of ml/M2
(L/min/~).
In man without clinical evidence of heart disease, Vn has2 31
been shown to be 70
±
20 ml/M . An increase in Vn occurs when the heart becomes dilated, as in most cases ofva~vular and myocardial disease. Thus a significantly
large value for normalised Vn (V
n sometimes reaches four or five times normal) lends weight to a diagnosis of these diseases.1
.5
Left Ventricular Pressure