Ap ea Detectio
A thesis presented for the degree of
Doctor of Philosophy
in Electrical and Electronic Engineering
from the
University of Canterbury
Christchurch, New Zealand
by
Paul Michael J)1acey
B.E. (Hons)
Acknowledgments
I completed this thesis with the support and encouragement of many people.
I am grateful to Dr. Rodney Ford who has continually supported me, as well as providing the research environment, financial backing, and direction in terms of research. I am also grateful to Dr. Jimmy Li, my supervisor for more than three years. Dr. Jimmy Li has trained me to do engineering research, and greatly contributed to the quality of this thesis in terms of the content and the presentation.
I also thank my other supervisors. My first supervisor Dr. Kathy Garden encouraged me into postgraduate studies and supported me during the early stages of my research, giving me guidance in terms of topics for my thesis. Prof. Jim Reilly supervised me for six months and he helped me understand what was required for a Ph.D. thesis. Dr. Phil Bones kindly agreed to supervise me in my final months, and has smoothed the administrative process greatly.
I worked with Dr. David Tappin, the Canterbury Cot Death Fellow, for over a year and greatly enjoyed his openness to new ideas and commitment to producing quality research. Craig Tuffnell and I have worked alongside for many years and developed a friendship which we enjoy to this day. I am very grateful to Craig for his help throughout, from when I first arrived in the BabyLog team, through to the final stages during which he has read my thesis thoroughly. Philip Schluter has helped with statistical analyses and also read some chapters, adding rigour to the results and wTiting. I have enjoyed working with the other members of the BabyLog team-Richard Dove, Janine Larkin, Brent Price, team-Richard Fright and Jeff Brown-fixing computers, programming and spending hours staring at computer screens! I have received guidance from the team in the areas of the data collection, computing hardware, software, and medical interpretation, to name a few. At the Community Paediatric Unit, where I have worked for the last three years, Chris Wilde has been a great help in taking care of all administration problems, and supplying me with coffee!
Several people in addition to those mentioned above have helped with the writing of this thesis. Brenda Satherley has gone over several chapters in detail, and helped me improve the clarity and accuracy of the writing. Peter Gough was a great help when he took me aside and gave me some guidelines on writing, and read some of my work. Fiona Mackay has also proof read some chapters.
I also acknowledge the support of Cardinal Commumty Laboratories and the Cot Death Division of the National Child Health Research Foundation.
Over the last year, my wife Katherine has been a great support, always interested and encouraging me to keep at it. The same is true of my many friends and flatrnates, with whom I have had many wonderful tinles at home, in the mountains, or on the rivers-they continually encouraged me to keep up the work.
Preface
The research presented within this thesis is concerned with the development and application of engineering techniques in the area of medical research, a field that is termed biomedical engineering. The motivation for this research is the investigation of Sudden Infant Death Syndrome (SIDS), or Cot Death.
During 1985, Dr. Rodney Ford, a community paediatrician, became involved in SIDS research in Canterbury. Dr. Ford recognised the need for the application of engineering techniques to help study infant physiology and clinical aspects of SIDS. Thus, Dr. Ford, the late Professor Richard Bates, Dr. Richard Fright, and my first supervisor, Dr. Kathy Garden, began a collaborative research effort between the Christchurch Hospital and the Department of Electrical and Electronic Engineering at the University of Canterbury. To assist in the study of infant physiology, a masters project was undertaken in 1987, by
Mr.
Richard Dove, with the aim of constructing a system to collect and store infant physiological signals. The system has become known as BabyLog [Dove 1988]. Since then, various people have been involved in collecting and analysing these signals, and the group is now known as the BabyLog cot death research group. My research evolved as a part of this project.In 1990, I became involved with the BabyLog cot death research group at Christchurch Hospital through a summer studentship. During this time, I developed software for the BabyLog system, and performed some initial tests on an algorithm for the detection of pauses in breathing during sleep, or apnoeas. Soon after the summer studentship, I began my Ph.D. studies. I extended the initial tests of the apnoea detection algorithm, and from there expanded my research to study apnoea detection in detail. Throughout this time, I have been involved as a member of the research team, which consists of several people with a variety of backgrounds.
When I started this research, my supervisor at the University of Canterbury was Dr. Kathy Garden. She encouraged me into many new areas, and was a constant support for my work. After she moved, Prof. Jim Reilly supervised me for six months, and he worked with me to devise new approaches to my research. I was then supervised by Dr. Jimmy Li for several years, and in partnership with him, I conducted the majority of my research. Finally, Dr. Phil Bones is my current supervisor in conjunction with Dr. Jimmy Li.
Dr. Jimmy Li has contributed to the engineering rigour in this research. He has provided many of the ideas that are the basis of the original research, and has constantly contributed to the work over the last four years. Throughout this thesis, wherever there is any original material, Dr. Jimmy Li has been a part of developing the research.
The structure of this thesis is outlined below, and the original aspects of my research are identified. Some areas of research have involved collaboration with other researchers, and these areas are also identified.
vi
Chapter 1 describes the context of this research, and introduces and provides the motivation for studying apnoea detection. Infant breathi~g and apnoea are described, and possible links to SlDS pointed out. From existing research, the objectives of this thesis are developed.
Chapter 2 explains how the data are recorded, and describes how sleep studies are performed on infants to gather physiological data. The BabyLog system is described, and the breathing signal that is used is discussed in detail. The characteristics that lead to difficulties that are later encountered in terms of accurate apnoea detection are well illustrated. The BabyLog system and signals have been described elsewhere, but the details of the interpretation of the breathing signal are new.
Chapter 3 investigates human expert interpretation of breathing signals and detection of apnoeas. The work was done in conjunction with expert clinicians who had extensive experience evaluating sleep study data. The experts detected the apnoeas, and developed definitions. I performed the analysis of the experts' results, and I also formalised their common interpretations of the breathing signal. The overall work in the chapter is original and was published in a medical journal [Macey et al. 1995].
Chapter 4 is a study of methods of analysing breathing signals. Performance measures for apnoea detection are developed, of which some are standard and one is new. A review of methods that are used for analysing breathing is included to illustrate other approaches to analysing breathing. The original research in the chapter consists of one performance measure, and the application of neural networks, peak-to-peak, and cepstral algorithms to apnoea detection. Previous research is clearly referenced.
Chapter 5 presents a statistical method of apnoea detection, and its application as part of the analysis of physiological data. The basis of the algorithm was originally developed by Dr. Richard Fright. My initial work consisted of testing and optimising the algorithm. I then developed a duration measurement algorithm to use in conjunction with the original apnoea detection algorithm. In the second part of this chapter, the algorithm is used as part of a study of normal babies in their home environment, led by Dr. David Tappin, the then Canterbury Cot Death Research Fellow. In consultation with Dr. Tappin and Ms Kerrie Nelson, a statistician, I developed algorithms for reducing the raw physiological data to a manageable size. Thus, I was involved in collaboration with others in the overall study, which was original research, and I specifically designed some new analysis techniques.
Chapter 6 presents a new method of apnoea detection, and is entirely originaL The motivation and objectives for a new method are explained. The first part involves modeling apnoea signals by describing the signal properties that correspond to an apnoea. While the properties are original research, I relied on the help of Dr. Philip Schluter when designing the statistical tests. The second part of the chapter describes a system that uses the signal properties to detect apnoea. The system includes a standard neural network, but the application is original.
Finally, Chapter 7 concludes and suggests possible future research.
Ford, R. P. K., p, 1. Brown, R. A. Dove, C. S. Tuffnell, and P. M. Macey, "HomeLog: long term recording of infant temperature, respiratory and cardiac signals in the home environment," Journal of Paediatrics and Child Health, Suppl. 1, pp. 26-33, 1992.
Ford, R. P. K., C. S. Tuffnell, P. M. Macey, T. M. Tappin, and M. Sambamoorthy, "Rectal temperature changes and apnea," Conference Program of the Fourth SIDS International Conference, p. 123, Washington, USA, June 23-26, 1996.
Macey, P. M., R. P. K. Ford, P. 1. Brown, J. Larkin, R. W. Fright, and K. Garden, "Apnoea detection: human performance and reliability of a computer algorithm," Acta Paediatrica, vol. 84, pp. 1103-1107, 1995.
Macey, P. M., R. P. K. Ford, and J. S. J. Li, "Reliable apnea detection from an abdominal breathing signal," Presented at: the Fourth SIDS International Conference, Washington, USA, June 23-26, 1996.
Macey, P. M., J. S. J. Li, and R. P. K. Ford, "Designing an expert system for apnoea detection," Proceedings of the Third New Zealand Conference of Postgraduate Students in Engineering and Technology, pp. 83-88, University of Canterbury, Christchurch, July 1-2 1996, 1996.
Macey, P. M., 1. S. J. Li, and R. P. K. Ford, "Expert system for apnoea detection," Engineering Applications of ArtifiCial Intelligence, accepted for publication, January 1998.
Macey, P. M., J. S. 1. Li, and R. P. K. Ford, "Deterministic properties of apnoea in an abdominal breathing signal," Medical and Biological Engineering and Computing, under revision.
Tappin, D. M., R. P. Ford, K. P. Nelson, B. Price, P. M. Macey, R. Dove, J. Larkin, and B.
Slade, "Breathing, sleep state, and rectal temperature oscillations," Archives of Disease in Childhood, vol. 74, pp. 427-431, 1996.
Tappin, D. M., R. P. K. Ford, K. Nelson, B. Price, P. M. Macey, and R. Dove, "Central apnoea is not increased in normal infants after vaccination," Conference Program of The Fourth SIDS International Conference, p. 119, Washington, USA, June 23-26,1996.
Tappin, D. M., R. P. K. Ford, K. Nelson, B. Price, P. M. Macey, and R. Dove, "The febrile stress of routine vaccination does not increase central apnoea in normal infants," Acta Paediatrica, vol. 86, pp. 873-880, 1997.
In preparation:
viii
Table of Contents
Abstract
Acknowledgmen ts III
Preface v
Table of Contents ix
Abbreviations xiii
Cha pter
1.
Introduction
1
1.llNFANTBREATIIING ... 1
1.2 APNOEA AND SIDS ., ... , ... , ... ,." ... ,"', ... , ... , ... , ... 4
1.3 DETECTION METIIODS .... , .... , ... , ... " .. , ... , ... , ... 6
1.4 OBJECTIVES OF RESEARCH ... , ... 10
1.5 SUMMARY ... : ... , ... 12
Chapter 2. Recording and Analysing Breathing Signals
13
2,1 SLEEP STUDIES ... , ... , ... ' ... , ... , ... ,', ... 132.2 THE BABYLOG SySTEM ... ,', ... , ... 15
2.2.1 Overview ... 15
2,2,2 Breathing Signals ... ".' ... ,.,' ... , ... , ... " ... 18
2.2.3 Infant Database ... , .. , ... , ... , .. , ... , ... ", ... , ... 23
2.3 GRASEBY BREATIIING SIGNAL ... , ... , ... 24
2.3.1 Selecting the Graseby ... ,,', ... , .... ", .. "., .... ","" ... , .. ,.," ... , ... 24
2.3.2 The Instrument ... , ... ,' ... ",."." ... ," ... 25
2.3.3 Signal Characteristics ... , ... ", ... , ... , ... , .. , ... "' ... " ... ",." .. , .... 27
2.4 CONCLUSIONS ... , .... " ... " .. " ... , ... " "'''''''''''' " ... ,., ... , ... "" .... ,', ... 31
Chapter 3. Human Expert Interpretation
of
Breathing Signals
33
3.1 EXPERT DETECTION OF APNOEA ... "" .. " ... , .... ,,, .. , ... , ... 333,2 REFERENcEAPNoEAS ... , ... " .... , ... , ... , ... " ... ,., ... ,., ... ,., ... 34
3.2.1 Detlnition ... ,." ... , ... 35
3.2.2 Methodology ... , ... , ... 37
3.2.3 Results ... 38
3.3 INTERPRETATION OF GRASEBY SIGNAL ... , ... 41
3.4 DISCUSSION AND CONCLUSIONS ... , ... , ... , ... 43
Chapter 4. Approaches
to
Breathing Signal Analysis
47
4.] OBJECTIVES ... , ... " ... " ... 474.2 QUANTIFYING PERFORMANCE ... , ... 48
x
4.2.2 False Negatives and False Positives ... , ... .49
4.2.3 Perfonnance Measure ... ,-' ... 49
4.2.4 Confidence Intervals ... 51
4.3 EXISTING METHODS OF ANALYSlNG BREATHING ... 52
4.4 EVALUATION OF A PEAK-TO-PEAK APNOEA DETECTION ALGORlTH!vl ... 56
4.5 FOURIER-BASED METHODS ... 58
-1.5.1.1 Spectrum ... ... 58
4.5.1.2 Spectrogram ... ... 60
-1.5.1.3 Cepstra. ... 60
4.6 NEUR.i\L NETWORKS ... 64
4.6.1 Introduction to Neural Nenvorks ... , ... , ... , ... """, 64 4.6.1.1 Description o/Neural Networks ... , ... 64
-1,6.1.2 Neural Network Design".,.,', ... " ... ... 66
4.6.1.3 Training strategies ... ... 67
4.6.2 Implementation of Neural Network Analyses ... 70
4.7 DISCUSSION AND CONCLUSIONS ... 72
Chapter
Statistical Method of Apnoea Detection: Development and
Application
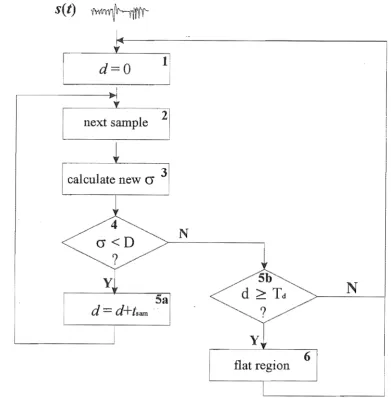
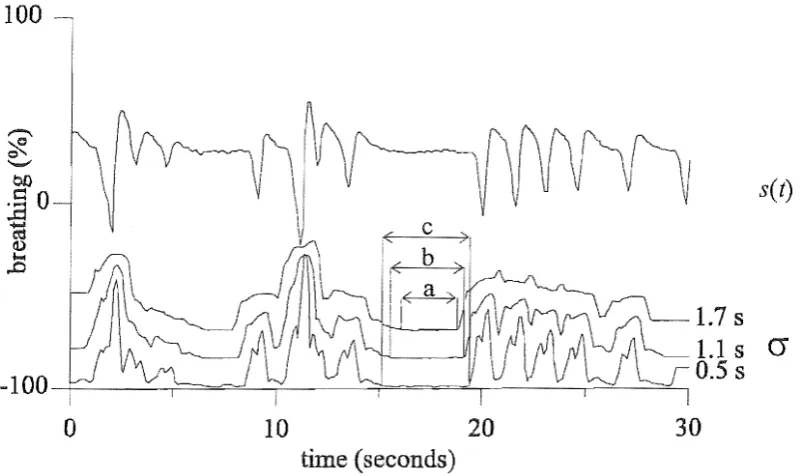
5.1 A STATISTICAL METHOD OF APNOEA DETECTION ... 755.1.1 Detection of Flat Regions ... 75
5.1.2 Measurement of Duration ... 78
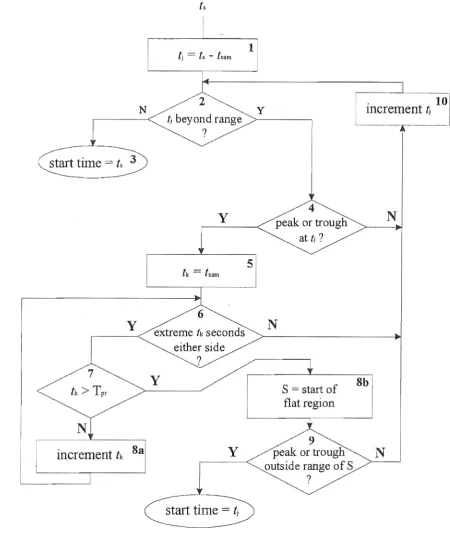
5.1.2.1 Start Time Detection ... 79
5.1.2.2 End Time Detection ... , ... 81
5.1.2.3 Optimum Duration Parameter Values ... 83
5.1.3 Results ... " ... ".,', ... ,', .. " ... 83
5.2 ANALYSIS OF DATA FROM A STUDY OF NORMAL INFANTS ... , ... 86
5.2.1 Nonnal Infant Study: Analysis Requirements ... , ... 87
Calculating Physiological Measures from Raw Data ... 88
5.2.3 Physiological Results ... , ... , .. , ... ,', ... ,., .. ,', ... , ... 92
5.3 DISCUSSION AND CONCLUSIONS ... , ... 95
Chapter 6. Expert System for Apnoea Detection
99
6.1 INTRODUCTION ... , .. , ... 996.2 MODEL OF APNOEAlN AN ABDOMlNAL BREATHING SIGNAL ... 100
6.2.1 Objectives .... , .... " ... , ... ""', ... " ... " .. ,, ... " ... , .... ,'" , .. ,', ... 100
6,2.2 Development of Properties , ... , ... , ... , ... , .. , ... " ... 1 0 I 6.2.2,1 Expert Interpretation and Properties in Signals ... ... ... 101
6. 2. 2. 2 Descriptions o/Properties .. , ... " ... " ... , ... ,,' ... , ... ... "",,103 6. 2. 2. 3 Parameter Tuning ... ... " ... , ... ,', ... ,.' ... 1 03 6. 2.2.4 Verification
0/
Properties .... , ... " ... , ... """"""'" ... , .. , ... , .... , .... 1 04 6.2.3 Detenninistic Properties of Apnoea ... , ... , .... ,"'" ... ,"""'" ... , ... , 1056.2.3.2 Properties of Flat Regions ... 108
6.2.3.2.1 Flatness ... _., ... 108
6.2.3.2.2 Duration ... 109
6.2.3.2.3 Thinness ... 112
6.2.3.2.4 Smoothness ... 113
6.2.4 Optimisation Results ... , ... ', ... " ... ' ... 115
6.2.5 Discriminating Power and Independence of the Properties ... , ... , ... 118
6.3 CLASSIFICATION OF BREATIllNG SIGNALS ... 120
6.3.1 Objectives ... , ... ' ... 120
6.3.2 System Design ... 121
6.3.2.1 Overview ... ... 121
6.3.2.2 Property Measurement ... ... 121
6.3.2.3 Classification. ... 123
6.3.3 Training Criteria ... , ... 126
6.3.3.1 Overall System ... ... 126
6.3.3.2 Properties ... ... 127
6.3.3.3 Neural Network Input Transformations ... ... 127
6.3.3.4 Neural Network ... " ... 127
6.3.4 Evaluation of System Performance and Experimental Results ... 128
6.4 DISCUSSION AND CONCLUSIONS ... 130
Chapter 7. Conclusions
References
133
Abbreviations
[.] integral function (converts to integer)
.(j) jth order statistic
AID analog-to-digital
ALTE Apparent Life-Threatening Event bpm beats per minute (heart rate) ECG electrocardiogram
FFT Fast Fourier Transform GB giga byte
Hz Hertz
MB mega byte
MSE Mean Square Error REM Rapid Eye Movement
Chapter 1
Introduction
Breathing implies life, and without breathing, life as we know it ceases to exist. All creatures that have ever walked on this planet have breathed, from the smallest insects to highly evolved mammals such as Homosapiens.
In humans, breathing functions are so fundamental to the animation of our body that the neurological control of breathing occurs at the subconscious level. Breathing, then, occurs instinctively without thought. People are seldom aware of their breathing and they breathe regardless of what they are doing. At the scene of an accident, upon noticing a body on the ground, a bystander might call out "Are they breathing?" to the same effect as "Are they alive?" This powerful association is again implied by the expression to put a breath of l~fe into something. In some Eastern spiritual traditions, control of one's breathing is believed to be a path to spiritual enlightenment. Whichever way it is considered, breathing is very much associated with living.
During sleep, people breathe without conscious effort. Breathing continues throughout a night's sleep, consisting of regular, even breaths, although there may be periods of more erratic, uneven breaths as well. When sharing a room with another who is sleeping, one expects to hear slow but regular breaths. However, during sleep, people may be breathing regularly- and then they may pause for several seconds, for no apparent reason-and then resume breathing as before. Such a pause is not conscious, yet breathing may cease for five, ten or even thirty seconds. A pause in breathing during sleep is called an apnoea [Thach 1985].
This thesis is concerned with apnoeas. How and why apnoeas occur has been speculated on for years and has motivated considerable research, much of which is ongoing. Apnoeas are commonly studied from breathing signals, and although an apnoea is defmed physiologically as a pause in breathing, there are few definitions of apnoea signals. This lack of definitions results in uncertainty about what signal shape corresponds to an apnoea, and hence leads to difficulties in accurately detecting apnoeas. The research presented within this thesis proposes new definitions of apnoeas in terms of a breathing signal, and also proposes new detection methods.
1.1 Infant Breathing
What is normal breathing? Is a five second apnoea nonnal? Is a thirty second apnoea normal? The answers to these questions are not simple, as there is great variation in what is considered normal breathing.
Breathing is controlled by the body according to a number of factors [Talbot and Gessner
the circulating blood increases. The body cells alter the gas partial pressures in the blood as they consume oxygen and produce carbon dioxid~. The rate of gas consumption and production is proportional to the cellular metabolic rate, which is dependent on factors such as physical activity, and heat production requirements. Chemoreceptors provide information on the oxygen and carbon dioxide partial pressures in the blood, and the carbon dioxide partial pressure in the cerebrospinal fluid of the brain. This information is conveyed to the respiratory control centre in the brain, which adjusts the ventilation of the lungs to maintain gas partial pressures at normal values.
At sea level, most people do not experience apnoeas, but above 6,000 metres regular apnoeas are common [West et al. 1986] At high altitude, one factor that cold contribute to the occurrence of apnoeas is the low level of carbon dioxide, as this could reduce the carbon dioxide partial pressure in the blood and hence reduce the breathing drive enough to allow pauses in ventilation. However, the majority of apnoeas are not caused by reduced levels of carbon dioxide. People with breathing disorders such as Sleep Apnoea Syndrome typically have many apnoeas during a night, regardless of altitude [Guilleminault et al. 1978]. There is considerable variation in people's breathing patterns, and what is a normal pattern of breathing is determined by an individual's physical state and environment.
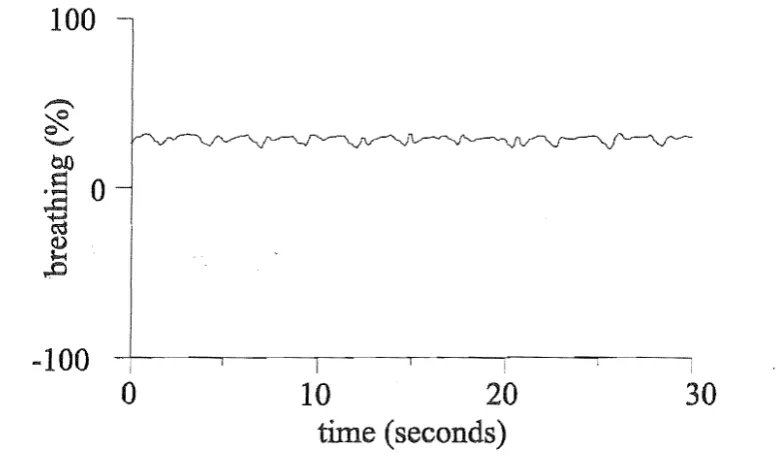
Noimal breathing for infants differs from that of adults. This difference is primarily due to infants' smaller size and elevated metabolic rate [Hill and Rahimtulla 1965], the different oxygen-carrying capacity of the blood [Delivoria-Papadopoulos et al. 1971], and less sensitive chemoreceptors [Wilkie et al. 1987]. Infants have apnoeas during sleep, a fact that is accepted as normal [Gibson 1996a]. In contrast, not all adults experience regular apnoeas. The term "sleep apnoea" in adults refers to a serious breathing disorder, where the breathing passages obstruct normal breathing [Guilleminault et al. 1978J. Apnoeas from two to ten seconds in duration are common in infants, but apnoeas greater than 15 seconds are less frequent [Tappin et al. 1996b]. Apnoeas greater than 15 or 20 seconds in infants are considered abnormal [Kempe et al. 1974, National Institutes of Health 1987, Gibson 1996a]. An example of an apnoea is shown in Figure 1.1.
100
-:::(
~
0-1 ! ~I
\
.
II
i
o
10 20 30time (seconds)
1.1 Infant Breathing 3
While there is variation in the frequency and duration of apnoeas ex-perienced by different infants,
all infants have apnoeas during th~ir sleep, with frequency ranging from less than ten to several hundred per night [Franks et al. 1977, Hoppenbrouwers et a1. 1977, Stein et a1. 1979. Richards et a1. 1984, Hunt et a1. 1985a, Henderson-Smart and Cohen 1986, Cornwell and Laxminarayan 1987, Lee et a1. 1987, Tappin, et a1. 1996b].
There are a variety of apnoea types. The most common is a central apnoea, where both breathing movements and airflow stop, often after a sigh, and then restart (see Figure 1.1)
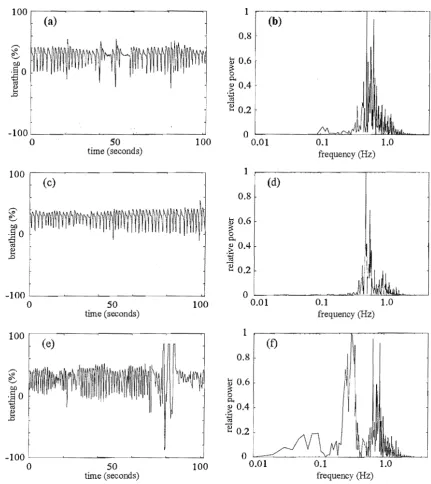
[Franks, et a1. 1977, Stein, et al. 1979, Richards, et al. 1984, Hunt, et at 1985a, Henderson-Smart and Cohen 1986, Cornwell and La;\.minarayan 1987, Lee, et a1. 1987, Tappin. et aI. 1996b]. Sometimes, central apnoeas occur with such frequency that breathing only occurs for half the time, This phenomenon is called periodic breathing or Cheyne-Stokes breathing (see Figure 1.2), Periodic breathing occurs occasionally in infants, but not every night as occurs with central apnoeas [Kempe, et aI. 1974, Franks, et al. 1977, Hunt et al. 1985b, Gordon et aI. 1986, Southall et al. 1986, Gibson 1996a]. Another type of apnoea is tenned obstructive apnoea, where airflow ceases but physical breathing movements continue, sometimes violently [Gibson 1996a]. \Vhile experiencing an obstructive apnoea, an infant behaves as if there is an obstruction in the ainvay [Brouillette et a1. 1982, Brouillette et a1. 1984, Guilleminault et a1. 1984]. Obstructive apnoeas occur less frequently than central apnoeas and are considered abnonnal [Brouillette, et a1. 1982, Brouillette, et aI. 1984, Guilleminault, et aI. 1984, Dunne et a1. 1986, Gibson 1996a]. It has been noted that some obstructive apnoeas are preceded by a central apnoea, and these have been labeled mixed apnoeas [Butcher-Puech et al. 1985, Gibson 1996a]. The purpose of this thesis is to investigate central apnoea in infants.
100
I
~'I~[lli'!ht\~\~\lrl f~1 ~~:II ~~!ll~-t~{
I
-100~---~---~---,---,---~ I
120
o
40 80time (seconds)
Figure 1.2 Periodic breathing: ten second apnoeas interspersed with ten second segments of breathing.
Superficially, central apnoeas appear to be unpredictable. Apnoeas occur more frequently in some infants than others. Infants with certain respiratory disorders tend to have more apnoeas and periodic breathing [Mitchell et a1. 1983, Butcher-Puech, et a1. 1985, Abreu e Silva et a1. 1986a, Abreu e Silva et a1. 1986b, Martin et a1. 1986, Tudehope et a1. 1986, Poets et a1. 1993, Gibson 1996a]. However, according to recent research, most infants have at least ten central apnoeas of five seconds or longer during a night's sleep [Tappin, et al. 1996b].
oxygen saturation is considered unhealthy, but central apnoeas do not appear to be harmful, with no recorded ill-effects [Gibson 1996a]. Other physiological behaviours have been associated with apnoeas, such as a change in heart rate [Haidmayer et al. 1982, Richards, et al. 1984, Butcher-Puech, et al. 1985, Kelly et al. 1986, Peirano et aI. 1988, Kahn et al. 1992, Poets, et al. 1993, Barschdorff et al.
1994], but the precise mechanisms that trigger an infant to stop breathing remain unkno-wn. Indeed, despite much research and many clinical evaluations, the meaning and significance of apnoeas are not completely understood.
1.
2
Apnoea and SIDS
Every year throughout the world, thousands of babies aged between two weeks and twelve months die suddenly and unexpectedly [Gibson 1996b]. There is no apparent cause for such deaths; the baby simply dies during sleep. It is difficult to define this phenomenon, as there is no kno-wn cause, but it is conunonly called Cot Death, or Crib Death in North America. Cot Death is specific to infants (four weeks to one year) as opposed to newborns (up to four weeks) or children (older than one year), and there is a peak in the death rate at three months of age. It is the leading cause of death for children under the age of 15 years in New Zealand and other developed countries. The medical term for this phenomenon is Sudden Infant Death Syndrome, or SIDS [Ford 1986, Hunt and Brouillette 1987, Nelson et al. 1989, Gibson 1996b].
During the 1980's, New Zealand had the highest recorded rate of SIDS in the world with a death rate close to 1% of births in some regions [Ford 1986, Nelson, et al. 1989]. This high rate motivated researchers to conduct an epidemiological study of all SIDS infants and a sample of control infants born in New Zealand over a three year period, resulting in new information on risk factors for SIDS. Three main modifiable risk factors were discovered: prone sleeping (sleeping face down); bottle feeding; and parents who smoke [Mitchell et al. 1991, Mitchell et al. 1992]. Publicising of these factors and uptake of different behaviours has substantially reduced the SIDS rate in New Zealand to average levels relative to other developed countries [Mitchell et al. 1994]. However, the study shed little light on the causes of SIDS.
Other research in New Zealand has focused on the study of infant physiology, searching for physiological mechanisms that could lead to SIDS [Tonkin et al. 1980, Bolton et al. 1993, Tuffnell 1993, Griggs et al. 1995, Macey, et al. 1995, Bolton et al. 1996, Ford et al. 1996, Tappin et al. 1996a, Tappin, et al. 1996b, Tonkin and Gunn 1996]. A hypothesis that is conunon throughout the world is that SIDS is caused by a failure of the respiratory system, and consequently much research focuses on breathing [Guilleminault et al. 1981, Hodgman et al. 1982, Gordon et al. 1984, Dunne, et al. 1986, Kelly, et al. 1986, Oren et al. 1986, Southall 1988, Milner and Ruggins 1989, Kahn, et al. 1992, Gibson 1996b, Katz-Salomon and Mi1erad 1996, Scheffer et al. 1996]. Research into breathing in New Zealand includes the use of physical models to simulate breathing whilst sleeping prone [Bolton, et al. 1993], studying the upper airway [Tonkin, et al. 1980, Tonkin and Gunn 1996], analysing mathematical models of respiration [Tuffnell 1993], and studying hours of recorded breathing data [Brown et al. 1992, Tappin, et al. 1996a].
1.2 Apnoea and SIDS 5
multi~disciplinary team of researchers, combining medical, engineering and statistical expertise. The BabyLog research is centered around hypotheses concerning the physiological control systems of infants, including breathing control and apnoea [Macey, et al. 1995].
An apnoea can be viewed in the context of previous and subsequent physical behaviour, and not as an isolated event; the fact that an apnoea occurred may not be as important as how or
when it occurred. The respiration, temperature and cardiac control systems differ between infants and older children, and it could be the nature of these differences that makes infants susceptible to SIDS.
Although external causes for SIDS have been postulated for many years (for example, in New Zealand and the United Kingdom, the recent theory regarding the production of dangerous gases from mattresses [Sprott 1996]), so far no research has conclusively confirmed any external cause. Hence internal factors are likely to hold the key to the cause of SIDS. In particular, one hypothesis is that infants' respiratory and temperature control systems sometimes fail to cope with significant increases in temperature which, for example, might occur when an infant is trapped under layers of bedding [ponsonby et aI. 1992, Skadberg and Markestad 1996]. Several SIDS babies in Christchurch were discovered totally covered by bedding, and with high body temperatures recorded soon after death. Temperature control is closely related to respiratory control [Tuff nell 1993], and the mechanisms of apnoea may give clues to possible mechanisms of failure of temperature and respiratory controls.
There are indirect links between apnoea and SIDS. The age distribution of the incidence of SIDS matches the age distribution of infants that experience apnoea regularly. Since an infant can simply stop breathing for no apparent reason, could they also simply not resume breathing? Results are inconclusive; there is a higher risk of SIDS amongst infants who suffer obstructive apnoea, but there is no conclusive link between shorter central apnoeas and SIDS [Guilleminault, et al. 1984, Dunne, et aI. 1986, Southall 1988, Kahn, et al. 1992, Gibson 1996a].
Apnoeas have been associated with SIDS in the language associated with infants. Some infants appear to almost die during sleep, but are revived. They are found not breathing, clarnmy-skinned and blue, and sometimes require full cardio-pulnmonary resuscitation to be revived. These are termed Near-Miss Cot Deaths, or Apparent Life-Threatening Events (ALTE's); they are also called Apnoea of Infancy [Ariagno et al. 1983, Brooks 1992J. Infants who have suffered an ALTE are at greater risk of dying of SIDS [Oren, et al. 1986J. The parents of ALTE babies in New Zealand are given monitors to use on their babies during sleep. These monitors are called either Cot Death Monitors or Apnoea Monitors [Ford et al. 1994]. One fact is evident: if an apnoea is long enough, an infant will certainly die. As there is no diagnosis of "death-by-apnoea," if an infant experiences an apnoea and does not resume breathing, and consequently dies, then the cause of death would be unexplained, and therefore diagnosed as SIDS.
specific mechanisms which could lead to SIDS [Stein, et a1. 1979, Hunt, et a1. 1985b, Lee, et aL 1987]. Thus, much effort is being directed tQwards understanding apnoea, breathing and other related factors. While it is accepted that there is no direct link between short central apnoea and SIDS, research continues based upon the premise that the mechanisms of SIDS are related to the mechanisms of apnoea.
1.3 Detection lYlethods
The study of apnoea requires accurate apnoea detection. Detection is performed by analysing recorded breathing signals, as an apnoea is a pause in breathing. There is a variety of medical instruments that produce breathing signals, ranging from hand held monitors to gas partial pressure analysis systems installed at hospital bedsides. These instruments all measure some physiological behaviour associated with breathing, and they produce breathing signals that can be recorded electronically or printed. Recorded signals are usually interpreted by experts such as clinicians. In hospitals throughout the world, breathing is measured and recorded, and apnoeas are detected [Franks, et a1. 1977, Hoppenbrouwers, et a1. 1977, Stein, et a1. 1979, Kelly et a1. 1980, Guilleminault, et a1. 1981, Haidmayer, et a1. 1982, Mitchell, et a1. 1983, Brouillette, et a1. 1984, Pfeiffer, et aI. 1984, Richards, et a1. 1984, Butcher-Puech, et a1. 1985, Hunt, et a1. 1985a, Gordon, et a1. 1986, Henderson-Smart and Cohen 1986, Kelly, et a1. 1986, Martin, et a1. 1986, Oren, et aI. 1986, Southall, et a1. 1986, Tudehope, et aI. 1986, Ward, et aI. 1986, Lee, et a1. 1987, Kahn, et a1. 1988, Peirano, et aI. 1988, Milner and Ruggins 1989, Abraham et aI. 1990, Kahn, et a1. 1992, Poets, et a1. 1993, Macey, et al. 1995, Ford, et a1. 1996, Gibson 1996a, Tappin, et al. 1996b].
An overnight recording of breathing and other physiological variables during sleep is called a sleep study or polysomnographic recording. The field of polysomnography is relatively young, having developed over the last 30 years due to new instrumentation, recording and computing technology [Stein and Shannon 1975]. Polysornnographic systems have been introduced into hospitals to help diagnose patients such as preterm babies and AL TE infants [Dove et aI. 1990], Some systems have also been designed for home use in order to obtain research data [Franks, et a1. 1977, Hunt, et al. 1985a, Gyulay et aI. 1987, Ford, et a1. 1992]. Systems for hospital use tend to record more signals than systems designed for home use, but the data from the home studies is considered valuable as the infant is in its normal environment.
A variety of signals are usually recorded for viewing and analysis. The particular signals recorded depend on the purpose of the study, and the protocol of the study centre. At Christchurch Hospital, infants with common problems such as gastro-oesophageal reflux may have only four signals recorded, for example oesophageal pH, breathing, blood oxygen saturation, and heart rate [Dove, et a1. 1990]. Polysornnographic recordings for more complex cases, such as AL TE infants, usually include several breathing signals, several temperatures, two heart rate signals, blood oxygen saturation, and possibly other variables such as body position. Of all types of signals, breathing is the most commonly recorded, and apnoea detection is performed with almost all recordings of breathing signals.
1.3 Detection Methods 7
apnoea detection is to locate longer apnoeas for viewing by a clinician. Routine hospital studies that record breathing for clinical e.:'aluations use scoring, but concentrate on the apnoeas longer than 15 or 20 seconds, as these are considered clinically significant [Kempe, et al. 1974. National Institutes of Health 1987, Gibson 1996a]. Apnoea detection is also a built-in functionality of breathing monitors. If a long apnoea occurs, it is detected by the monitor and an alarm is triggered [Laxminarayan et al. 1983, Graseby Medical Ltd. 1988]. Apnoea detection for monitoring needs to be automatic with no expert verification; it does not matter if the breathing signal is slightly inaccurate provided that it allows successful detection of any long pauses. The research in this thesis, although relevant to all types of apnoea detection, is focused on the accurate scoring ofapnoeas.
Having defined an apnoea physiologically as a pause in breathing, the question is: "How is an apnoea defined within a breathing signal?" Most breathing signals are not a direct measure of breathing in that they are not exact measures of the ventilation of the lungs, and therefore an apnoea signal must be an indirect measure of a pause in breathing. A signal showing a pause in breathing represents an apnoea, but what constitutes a signal shape that represents a pause in breathing? There is no agreed mathematical description of breathing or pauses in breathing, and so an apnoea is loosely defined by subjective human expert interpretation [Biernacka and Douglas 1993].
Traditionally, a trained expert looks through a printout of a night's breathing and records the apnoeas. As shown in Table 1.1, there is a variety of breathing signal types that are used to detect apnoeas. Many groups detect apnoeas manually, by viewing entire records of breathing [Kelly, et al. 1980, Douglas et al. 1982, Hunt, et al. 1985a, Lee, et al. 1987, Kahn, et al. 1988, Kahn, et al. 1992, Kirjavainen et al. 1996]. Some groups that record data onto computer still detect apnoeas manually [Richards, et al. 1984]. This is the original method dating from when polysomnographic signals were printed using chart recorders, before suitable data recording and storage devices were available [Stein and Shannon 1975]. Usually, all signals are printed out, and experts view these printouts, and search for apnoea patterns appearing simultaneously across several signals [Kahn,
et al. 1988]. Manually detecting apnoeas by viewing entire recordings is a time consuming process. Depending on the display used, analysing one night's data can involve viewing well over 2000 screens of signals [Macey, et al. 1995]. Each apnoea that is detected has its duration measured, and the duration is recorded along with the time of occurrence, and possibly verified by at least one other expert. Trained experts may take from one to two hours to study a full night's recording of a single breathing signal [Macey, et al. 1995]. At present, there are no apnoea detection algorithms that emulate human expert detection.
Group Transducer Type Physical Behaviour Output Analysis
[Kirjavainen, et -static-charge-sensitive bed_ -movement paper manual al. 1996]
[poets, et al. -pressure capsule -abdomen movement paper manual 1993] -inductance -chest & abdomen
volume -nasal thermistors -nasal airflow
[Kahn, et al. -abdominal & thoracic -chest & abdomen paper manual 1988] strain gauges movement
-nasal & oral thermistors -airflow
[Lee, et al. 1987] -nose-piece & flow- -inspiratory flow paper manual through system -airflow
-02 & CO2 nasal analysers -TcP02 & O2
-TcP02 & O2 at ear saturations
-rubber strain gauges -chest & abdomen movement
[Beckerman and -microphone on chest -breath sounds tape manual on
Wegmann 1985] oscilloscope
[Hunt, et al. -impedance electrodes -chest volume paper manual 1985b]
[Butcher-Puech, -abdominal strain gauge -abdominal movement paper manual et al. 1985] -nasal thermistor -upper nasal airflow
[Pfeiffer, et al. -impedance electrodes -chest volume paper manual 1984]
[Richards, et al. -pressure capsnle -abdomen movement tape to manual
1984] paper
[Hodgman, et al. -impedance electrodes -chest & abdomen computer computer &
1982] volume manual
-PC02 monitor -expired CO2
-nasal thermistor -airflow
[ Guilleminault, -abdominal & thoracic -chest & abdomen paper manual et al. 1981] strain gauges movement
-nasal & oral thermistors -airf10w -nasal catheter -expired CO2
!
-ear oximeter -oxygen tension
[Franks, et al. -microwave movement -body movement tape computer &
1977] sensor manual
[Hoppenbrouwers -impedance electrodes -chest & abdomen paper & computer &
, et aL 1977] volume tape manual
-infrared CO2 pressure -expired CO2
monitor
-thermistor -airflow
[Stein and -impedance electrodes -chest volume tape manual on
Shannon 1975] oscilloscope
[image:22.572.60.501.34.733.2]1.3 Detection Methods 9
usually has parameters that are set by the user, requiring some experience with the analysis (as explained by Burgess [1990]). Mason etal. [1974] presented a system that used a peak-to-peak measure to detect apnoeas, but no performance results were published. This method was found to be reliable for some signals [Hoppenbrouwers, et al. 1977]. Rakowski et al. [1986] developed an apnoea detection method based on the flatness of a signal. However, their system required manual input at the start of the analysis, and no performance figures were published [Rakowski et al.
1986]. A method based on detecting apnoeas from flat regions in the signal has reportedly been evaluated and used successfully [Brockert et al. 1982], but results were not published. In the main, few commercial packages or customised analyses have published in depth details of their analysis algorithms and the performances of their algorithms, and so their accuracy and reliability is unknown.
Some groups have measured the performance of detection algorithms, A detection algorithm analysing an expired CO2 breathing signal for long apnoeas, in a monitoring situation, was
compared to a human scorer and found to have 1-2% false positives and 2-3% false negatives [Laxminarayan, et al. 1983]. However, an adult system using a breathing signal produced by impedance plethysmography (chest volume and abdomen movement) had sensitivity ranging from 94% down to 40%, with 18% to 36% of detections being false detections [Gyulay, et al. 1987],
Algorithms using different start and end definitions were compared, demonstrating that apnoea durations varied significantly, and apnoea density (apnoea seconds per hour) could double depending on the method used [Hunt et al, 1988]. BabyLog uses a detection algorithm but requires human expert verification [Ford, et al. 1992], Biemacka has evaluated a detection algorithm and concluded that it was of little use [Biemacka and Douglas 1993]. Bruckert et al. [1982] presented detailed results of their algorithm compared to one expert, and found from 1 % to 26% false negatives, and from 1 % to 21 % false positives. Several breathing signals including airflow were used, and it is unclear which signals the results were derived from. The performance figures are also difficult to compare against those of other groups, as the original false positives were re-presented to the expert who reclassified up to 17% of events.
Commercial systems rarely include figures on the accuracy of apnoea detection [Miles et al.
1989, Burgess 1990]. A study of three commonly used systems has been published, showing that even the most sophisticated apnoea analysis required that the users ... be highly trained in polysomnography and have at least 90% inter-rater reliability ... , and that 50 to 100 records
needed to be manually scored to set analysis parameters, with ongoing validation once or twice per month [Burgess 1990]. A second system showed initial agreement between automatic apnoea analysis and individual scorer of 90%, but it was noted that It is difficult to maintain this level of accuracy ... with frequent apnoeas [Burgess 1990]. The third system did not claim automatic apnoea detection, but called its analysis a "Scoring Assistant" [Burgess 1990]. Another system describes its classification of central apnoeas as "less successful" than analyses of other parameters [Miles. et al. 1989]. Thus, despite the fact that these systems recorded mUltiple signals, there were significant inaccuracies in the apnoea detection results.
analyse according to criteria that were not documented in the paper [Richards, et al. 1984]. Butcher-Puech defined the end of a central apnoea as the resumption of two or more breaths within three seconds [Butcher-Puech, et al. 1985]. A few signal definitions have been developed. Some groups that recorded more than one breathing signal defined central apnoea as occurring when more than one breathing signal was flat, but flat was never defined [Butcher-Puech, et aL
1985, Kahn, et al. 1992]. Rakowski et al. [1986] had an expert user set a threshold below which a signal was considered "straight" (the equivalent of flat), and an apnoea signal was defined as being straight for greater than a given duration. In another example, a flat signal was defined as being below a threshold of 25% of the previous breath [MacFadyen et al. 1988]. This definition could cause inconsistencies, as the relative amplitude of the previous breath ranges from a large, as with the sigh prior to the apnoea shown in Figure 1.1, to normal or small, as in Figure 1.2. A system designed for apnoea monitoring uses a slightly lower threshold of 15% of the previous breath [Laxminarayan, et al. 1983]. A peak-to-peak measure has been used, where an apnoea is defined as occurring where the time between two peaks is greater than a set duration [Mason et al. 1974, Revow et aL 1986]. An alternative approach has been used to test apnoea monitors. Rather than defining a signal mathematically, a series of training signals is used, effectively defining apnoea by example; the training signals can be either simulated or actual recorded data [Zoldac et al. 1993, Leverich et a1. 1994]. Overall, apnoea definitions in terms of signal are rare, and almost no detection performance figures have been presented.
The problems of apnoea detection and the need for definitions of apnoea are well documented in the literature. In 1988, Southall reported such, stating: The description of respiratory patterns is beset with the difficulties of definition ... , and Clearly there is a need for accepted definitions of apnoea... [Southall 1988]. Richards et al. [1984], in explaining their 21 % observer variability,
mentioned that: The onset and end of a pause are not always easy to detect .... A conference on apnoea monitoring concluded that standard definitions for apnoea were urgently needed [National Institutes of Health 1987]. Miles et al. [1989] stated that apnoeas are difficult to distinguish, .. . partly due to the fact that no major clinical organization has established unequivocal event definitions. Kendrick et al. [1990] did a study on the scoring of apnoeas during sleep, and
concluded: (1) There is not complete agreement on the definitions of scoring apnoea, and (2) until such time as universal definitions are agreed, the precise definition of each type of apnoea
should be included in epidemiological and intervention studies [Kendrick, et al. 1990]. To quote
a recent review, A major problem in evaluating sleep studies is that there are no universal standards for scoring [apnoeas} [Gibson 1996a]. Yount is more precise, explaining: At the
current time no group has defined the maximal amplitude and shape of signal change that will
be declared to be a breath using each of the available transducing techniques. and as a result
the absence o.fbreathing effort [apnoea} is not established quantitatively [Yount 1989].
1.4 Objectives of Research
1.4 Objectives of Research 11 interpretations. Mathematical descriptions in particular are lacking. Secondly, the mathematical details of detection methods are rarely described, and descriptions that do exist usually require subjective interpretation. Thirdly, there are no standard reference sets of apnoeas or performance standards for apnoea detection. A lack of scientific rigour in the development of signal definitions and detection algorithms may be contributing towards the current lack of understanding of the exact mechanisms of apnoea. Therefore, the focus of this thesis is to improve apnoea definitions and apnoea detection methods.
Although it may be possible to use other breathing signals to increase the available information, this research is based on a single signal. Detection algorithms usually analyse one breathing signal [Laxminarayan et al. 1982, Burgess 1990, Macey, et al. 1995, Convin et al. 1996],
and experts often detect apnoeas using a single breathing signal, even though they may also use other types of signal such as oxygen saturation or heart beat to evaluate the severity of the event [Barschdorff, et al. 1994]. For the majority of home recordings, only one breathing signal is recorded [Ford, et al. 1992]. Therefore, any definitions or detection algorithms that aim to be widely applicable must apply to a single signal. Hence, the scope of this thesis is restricted to studying only one signal, and developing thorough defmitions and detection algorithms for that one signal.
The goals of apnoea detection research include developing universal definitions that match human expert opinion of what signal shape constitutes an apnoea, and developing detection algorithms that detect apnoeas with a similar degree of accuracy to human experts. As a start towards these goals, the specific objectives of this research are as follows:
1. To construct a reference set of apnoea and non-apnoea events. Before definitions and detection methods can be developed, a reference is required. Human experts are the ultimate reference of what an apnoea is, and therefore the aim is to use human experts to develop a reference set of apnoea signals consisting of breathing signals and the apnoeas within those signals.
2. To develop a mathematical description of signal shape that accurately defines apnoea. A mathematical definition of apnoea within a breathing signal is a model of apnoea which can be adapted to a particular reference set of breathing signals and apnoeas. The aim is to eliminate any subjective reference and develop a completely objective description.
3 . To develop performance measures for a detection system. A performance measure quantitatively describes how well a human expert or an apnoea detection algorithm performs, and is required in order to evaluate and compare detection algorithms. If groups used similar performance measures then results could be easily and appropriately compared. Each clinical result or research finding could be published with a reference to the accuracy of apnoea detection, and commercial apnoea detection software could include details of performance.
5. To develop applications of apnoea detection. in the context of analysing phvsiological behaviour associated with apnoea. Apnoea detection fits within the context of studying physiological behaviour. Mathematical algorithms that precisely define the physiological analysis within which apnoea detection is performed would allow for accurate and rigorous analyses of physiological behaviour.
1.5 Summary
Breathing is common to all people but breathing patterns differ, especially between infants and adults. An apnoea is a pause in breathing during sleep, and infants have frequent apnoeas during a night. Apnoeas in infants are investigated, as it has been suggested that they are related to SIDS. In analysing apnoea, reliable detection methods and accurate definitions are needed, and these are the motivation for this research.
Chapter 2
Recording and Analysing Breathing Signals
This chapter explains how breathing signals are recorded during overnight sleep studies. The recording system and breathing signal used in this research are presented, and the breathing signal characteristics are described in detail, along with the characteristics of the instrument that produces the signal.
2.1
Sleep Studies
Apnoea detection is performed on breathing signals recorded during overnight sleep studies, otherwise known as polysomnographic studies. Over the last 20 years, the field of polysomnography has developed into an important clinical area, with both research and clinical studies regularly performed in most major hospitals around the world [parmalee et al. 1972, Stein and Shannon 1975, Franks, eta!. 1977, Hoppenbrouwers, et aL 1977, Stein, et aL 1979, Guilleminault, et al. 1981, Douglas, et aI. 1982, Haidmayer, et al. 1982, Hodgman, et al. 1982, Mitchell, et al. 1983, Richards, et al. 1984, Butcher-Puech, et al. 1985, Gordon, et al. 1986, Henderson-Smart and Cohen 1986, Kelly, et al. 1986, Southall, et al. 1986, Wilson, et aI. 1988, Milner and Ruggins 1989, Abraham, et aI. 1990, Ford, et al 1992, Kahn, et al. 1992, Poets, et al. 1993, Gibson 1996a].
A polysomnographic study is defined as a recording of many signals (poly-) during sleep (-somno-), with the signals displayed as graphs either on paper or computer screen (-graphic) [Stein and Shannon 1975, Burgess 1990, Biernacka and Douglas 1993]. Typically, a variety of physiological signals are recorded overnight, while a patient sleeps. Examples of signals recorded include heart rate, breathing and temperatures. The current instrumentation, recording, and display technologies enable large volumes of data to be recorded and studied.
information regarding an individual infant, and also general physiological information that relates to all infants.
The instrumentation, recording and display methods vary between polysonmographic systems, ranging from event recorders, which are essentially sophisticated monitors with the capacity to record two or three signals for a few minutes [Corwin, et aL 1996], to sleep laboratories with comprehensive data collection and display systems, including dozens of instruments [Lee, et al. 1987]. Different systems may be used to study similar physiological behaviours and hence record similar physiological signals, but there are many different instnunents that can produce anyone type of signaL Even if two polysonmographic systems use the same model of instrument, the recorded signal can differ between systems due to instrument calibration, the sensors used, and the manner in which the sensors are attached. Different systems also record data in a variety of ways, such as: printing out on paper [Stein and Shannon 1975, Kahn, et al. 1988]; storing average values [WaHoo et aL 1989]; or storing a fully sampled set of signals [Dove, et al. 1990]. The result is that data recorded with one system or instrument are likely to have different characteristics to data recorded with another system or another instrument.
Systems designed for adults are generally not suitable for infants [Stein and Shannon 1975]. Adults tend to be more cooperative than infants and tolerate more invasive monitoring, such as a mask over the face for measuring ventilation. Infants usually try to remove any sensor attached to their face so the majority of instruments that are used to measure infants' breathing measure chest or abdomen behaviour. There is less physical space on babies, with premature infants sometimes smaller than an adult's hand, and the number or size of sensors used for adult sleep studies may not be practical for infant studies. Some instruments have different sensors for adults and babies, but often other, child specific, instruments are used [Stein and Shannon 1975, Corometrics 1985, BOC 1986, Graseby Medical Ltd. 1988, Dove, et al. 1990]. Compared to adult studies, there are usually fewer signals recorded during infant sleep studies. The result is that infant studies tend to reeord fewer data and use less direct measures of physical behaviour than adult studies.
Although a variety of signals may be recorded, some types are more eommon than others. Along with circulation, respiration is a constant process that is essential to life and that reflects the health of a person. When diagnosing patients, clinicians evaluate respiration and circulation: the trade-mark of a doctor is a stethoscope, with which he or she listens to air flowing in and out of the chest, and to the heart beating. There are many instruments available to measure breathing and, during sleep studies, several breathing signals are often recorded in order to obtain a clear representation of breathing. In fact, breathing is recorded during almost all polysomnographic studies.
2.2 The BabyLog System 15 As the recording and display technology becomes more affordable compared to ten or twenty years ago, polysomnographic systems are becoming common in most major cities, and for many types of presenting conditions, sleep studies are routinely performed [Burgess 1990].
2.2 The BabyLog System
This section describes BabyLog [Dove, et al. 1990], a polysomnograpbic system that is used to collect the data for the research presented in this thesis. The name "BabyLog" has also come to refer to the cot death research group based at Christchurch Hospital but, unless explicitly stated, within this thesis BabyLog refers to the polysomnographic system.
2.2.1 Overview
BabyLog is a sleep study system which originated from Christchurch Hospital, and which is currently used in several other New Zealand hospitals [Dove 1988, Dove, et al. 1990]. The system is specifically designed for monitoring babies. In essence, BabyLog produces and records a number of signals that are measures of physiological behaviours. The hardware and software are custom designed to meet the requirements of the clinicians and researchers performing the studies. Although BabyLog is a general purpose polysomnographic system, it is most commonly used to study babies with respiratory disorders, gastro-oesophageal reflux, and ALTE's. Studies are also done in the home using HomeLog, a portable version of BabyLog [Ford, et al. 1992]. Currently, home studies are mainly used for research purposes [Brown, et al. 1992, Tappin, et al. 1996a, Tappin, et al. 1997]. Home studies typically involve recording fewer signals than hospital studies, but the studies are performed over a longer period of time, usually every night for at least one week. All data presented in this thesis have been recorded using the BabyLog and HomeLog systems.
BabyLog includes hardware for data acquisition between instruments and an IBM compatible PC, and the software to sample and store the data. Signals produced by various instruments are passed through a 12 bit AID converter and sampled at rates appropriate to the signals being recorded. Examples of signals and rates at which they are sampled include temperature at 1Hz, breathing and heart rate at 10Hz, and ECG at 100Hz, as shown in Table 2.1. Each night's recording usually lasts 12 to 16 hours and contains 2MB to 5MB of data (or about 15MB if an ECG signal has been recorded). Data from home studies are recorded in approximately weekly blocks that are usually between 10MB and 20MB in size. The recordings are stored on removable optical disks, allowing immediate access to all data. For each night's recording, a complete set of signals can be displayed and analysed.
Instrument Signal Physiological Behaviour Sample Home
-- Rate (Hz)
Link (BabyLog breathing chest and abdominal impedance 10 No
instrument) paradoxical (measures of volume) 10
breathing
ECG 100
heart rate I
BabyLog nasal & breathing airflow at nose and mouth 10 No oral thermistors
BabyLog temperatures sites: auxilla, shin, rectal, anal, 1 Yes temperature 100m environment & forehead
(temperature sensitive diodes)
Corometrics Neo- breathing chest impedance (measure of 10 Yes
Trak 502 ECG chest volume) 100 No
heart rate 1 Yes
Graseby MR 10 breathing abdominal movement 10 Yes
Mercury switch position rotation of 00
, 900, 1800 or 2700 1 No
(on front, side or back)
OhmedaBiox blood O2 saturation absorption of red light by blood, 1 )fo
heart rate at some extremity (finger, toe, 1 ear)
pH probe (with oesophageal pH pH in oesophagus 1 No
BabyLog instrumentation)
Table 2.1 BabyLog signals and the instruments that produce them are shown. The physiological behaviour being measured is described, along with the sampling rate and whether the signal can be recorded in the home environment using HomeLog.
the throat, and hence these invasive signals are only recorded when necessary [Dove, et al. 1990]. The Corometrics Neo-Trak 502, hereafter referred to as the Corometrics, is another instrument that produces a breathing signal [Corometrics 1985]. The Corometrics is routinely used in hospital studies, often in addition to the Graseby, and also produces a heart rate signal and ECG signal. However, the Corometrics requires expertise in attaching the sensors, and is more invasive than the Graseby with two sensors stuck with electrode gel on either side of the chest [Corometrics 1985]. During a BabyLog hospital study, typically at least one heart rate and one breathing signal are recorded in addition to other signals. Figure 2.1 shows a two minute segment of a typical recording that includes two breathing signals (Channel C and Channel F) and two heart rate signals (Channel B and Channel D).
2,2 The BabyLog System 17
16e.BI
BEl. EI
Channel: A "Sa02:" X
Channel: B "Pulse (oxO" bpro
I
2ee.o~
_ _
~
_ _ _ _ _
...---____
~
___
~
r58.8
~
Channel: C "Chest Vol (cora)" X
lae
'Ol {
_lB8.01
U
~M;~
28··fh':~~~
I
50.0
~
Channel: F "Grasehy" x
108.0
-lBB.B
~
Channel: Ii "Red.al TeMp f," oC
38.0'
I
36.01
~0-.0---2-0~·.-B---4~a-.B---6-B~·.0---8-B~(.-0---1-B~0-.-B----1-2-B-.~0
[image:31.572.65.501.50.361.2]6:41:32 15/8/91 seconds 0:49:32 15/8/91
Figure 2.1 An example of a BabyLog display that illustrates six out of a total of eleven signals recorded during this particular study. Channel A is the percentage of oxygen saturation of the blood; Channel C is the Corometrics breathing signal; Channel D is the heart rate in beats per minute (bpm) as produced by the Corometrics; Channel F is Graseby breathing; and Channel N is rectal temperature in degrees Celsius. An apnoea event can be seen starting at 60 seconds, with the breathing signals (Channels C and F) being fiat, the pulse (Channel B) increasing, and a desaturation event shown by the blood oxygen level (Channel A) decreasing.
Many commercial systems only allow limited adjustment of recording or analysis parameters, or may not describe algoritluns used for automatic event detection [Burgess 1990], Along with recording data, BabyLog has the capacity for viewing and analysing data, and displaying results. The data can be displayed in a variety of ways, and displays are often used to visually confirm calculated results, For example, simply displaying the recorded temperature data for a whole night has revealed the presence of rectal temperature oscillations, as seen in Figure 2.2, a phenomenon that had not previously been described in the literature [Brown, et al. 1992, Griggs, et al. 1995]. The BabyLog signals have minimal pre~filtering, and are as close as possible to the raw physiological data.
The standard signals recorded in the home are different to the standard signals recorded in the hospital. In hospital, sleep studies are performed for diagnostic purposes and the presenting condition dictates the number and type of signals recorded. An infant with gastro~oesophageal
88.8 Channel: L "Rectal Tel'l'lp L6" oC 87.5
86.5
86.0=,~ ______ ~~ ______ ~~ ______ ~~ ______ ~~ ______ ~~ ____ ~~1
a . a 2 ~ 0 4 .8 6. a 8.8 10.8 12 .8'
28:4:25 29/8/94 hours 8:4:25 313.13/94
Figure 2.2 Temperatnre oscillations are illustrated, as seen in an overnight HomeLog recording of rectal temperatnre. Note also that the infant had 12 hours ofumnterrupted sleep whilst the data was being recorded, a rare occurrence for BabyLog (hospital) studies.
et al. 1996a]. As part of various research projects, signals from each night's recordings are compared or combined, and therefore a characteristic of research studies is that the same signals are recorded each time. To minimise the disturbance to the child and to simplifY the task of connecting the sensors, a small number of signals are recorded: Graseby breathing and temperatures. Hence, Graseby breathing is the only signal common to almost all BabyLog and HomeLog sleep studies.
The BabyLog system has been in use for ten years, and has been proven clinically. HomeLog has also been in home use for over six years, and there have been many publications based on the data recorded [Brown et al. 1990, Brown, et al. 1992, Tuffnell 1993, Macey, et al. 1995, Ford, et al. 1996, Macey et al. 1996a, Macey, et al. 1996b, Tappin, et aI. 1996a, Tappin. et al. 1996b, Macey et al. 1997, Tappin, et al. 1997, Macey et al. 1998]. The main feature of the BabyLog system that distinguishes it from other polysomnographic systems is the accuracy of the signals in terms of the physical behaviour being measured, avoiding assumptions that lead to a blurring or reducing of the infomlation contained within the signals.
2.2.2 Breathing Signals
As shown in Table 2.1, the BabyLog system includes four instruments to measure breathing:
1. Graseby (abdomen movement); 2. Corometrics (chest volume);
3. Thermistors (airflow at nose and mouth); 4. Link (chest volume & abdomen movement).
None of these signals is inherently better than the others, and they have their own advantages and disadvantages. As noted by Miles [1989]: Non-invasive respiration recordings are often impaired by movement artifact, physical displacements of the sensor, and changes in body