ORIGINAL RESEARCH
Tract-Specific and Region of Interest Analysis of
Corticospinal Tract Integrity in Subcortical
Ischemic Stroke: Reliability and Correlation with
Motor Function of Affected Lower Extremity
P.-F. Tang Y.-H. Ko Z.-A. Luo F.-C. Yeh S.-H.A. Chen W.-Y.I. Tseng
BACKGROUND AND PURPOSE: TS analysis has been suggested as a useful method to evaluate the fiber integrity of white matter tracts. This study investigated the intrarater and interrater reliability and validity of a TS analysis for the CST and compared the results with those of a ROI-based analysis. MATERIALS AND METHODS: Diffusion spectrum imaging was performed on 7 patients with subcortical ischemic stroke on a 3T MR imaging system. For the TS analysis, seed regions were placed at the cerebral peduncle and the medial portion of the primary motor cortex to reconstruct the tracts of the CST for motor control of the lower extremity. The mean GFA was measured at the PLIC by calculating the weighted sum of the GFAs sampled by the CST tracts at this segment. For the ROI-based analysis, the posterior two-thirds of the PLIC were enclosed on the GFA maps, and the mean GFA in this ROI was calculated.
RESULTS: The results showed good-to-excellent intrarater and interrater reliability on the seed region/ ROI placement (mean values ⬎0.80) and mean GFA values (ICCs⬎0.90) for both the TS and ROI-based analyses. Both the GFAPLIC-TSand GFAPLIC-ROIvalues were highly correlated with the motor function of the affected lower extremity (r⫽0.76 and 0.80, respectively;P⬍.05).
CONCLUSIONS:We demonstrated good reliability and validity of the TS and ROI-based analyses of the CST corresponding to lower extremity motor control in patients with subcortical ischemic stroke.
ABBREVIATIONS:AH⫽affected hemisphere; BG⫽basal ganglia; BOLD⫽blood oxygen level– dependent; CP⫽cerebral peduncle; CST⫽corticospinal tract; CV⫽coefficient of variance; DSI⫽ diffusion spectrum imaging; DTI⫽diffusion tensor imaging; FA⫽fractional anisotropy; FMA-LE⫽ Fugl-Meyer assessment of lower extremity; GFA⫽generalized fractional anisotropy; GFAPLIC-TS⫽ GFA value of the PLIC calculated by using the tract-specific method; GFAPLIC-ROI⫽GFA value of the PLIC calculated by using the ROI-based method; ICC⫽intraclass correlation coefficients; M1⫽ primary motor cortex/precentral gyrus; MMSE⫽Mini-Mental State Examination; NIHSS⫽National Institutes of Health Stroke Scale; PLIC⫽posterior limb of the internal capsule; ROI⫽region of interest; SD⫽standard deviation; TS⫽tract-specific; UH⫽unaffected hemisphere
U
sing MR DTI to assess the integrity of white matter tracts in patients with stroke is potentially valuable to correlate the motor impairments and to predict functional outcomes.1,2 It has been reported that FA, which is a quantitative index of the directional anisotropy of water molecular diffusion de-rived from the diffusion tensor, is an effective measure of fiberintegrity.3 Decreases in FA have been found in the affected
tracts at infarct regions and regions with wallerian degenera-tion.1,4,5Knowledge about tract integrity after stroke may
al-low for both the accurate stratification of functional recovery and the planning of effective customized rehabilitation pro-grams for individual patients.
Most studies have used ROI-based analysis of FA maps to detect white matter changes in patients with stroke.2,6,7Using
ROI-based analysis, researchers manually select certain white matter regions with the aid of anatomic landmarks. This ap-proach depends on raters’ familiarity with the brain anatomy and is thus subject to poor interrater and intrarater reproduc-ibility.8Recently, several studies have suggested that TS anal-ysis may be more objective, specific,9-11and reliable11,12than ROI-based analysis to evaluate the integrity of white matter fibers. The TS analysis method uses diffusion tractography as a guide to quantify the FA of a specific fiber tract bundle.9,11,13-16 Compared with ROI-based analysis, TS analysis has the ad-vantage of exploring the fiber integrity anywhere along a tract of interest, and thus, it is not limited to regions identifiable by anatomic landmarks.
Performing tractography of a long tract bundle such as the CST often encounters interruption of the tracts in patients
Received September 1, 2009; accepted after revision October 21.
From School and Graduate Institute of Physical Therapy (P.-F.T., Y.-H.K., Z-A.L) and Center for Optoelectronic Biomedicine (F-C.Y., W.-Y.I.T.), College of Medicine, National Taiwan University, Taipei, Taiwan, Republic of China; Physical Therapy Center (P.-F.T.) and Depart-ment of Medical Imaging (W.-Y.I.T.), National Taiwan University Hospital, Taipei, Taiwan, Republic of China; Department of Psychology (S.-H.A.C.), National Taiwan University, Taipei, Taiwan, Republic of China; Division of Psychology (S.-H.A.C.), Nanyang Technolog-ical University, Singapore.
This work was supported by grants from the National Science Council (NSC95-2314-B-002-238-MY3 to P.-F. Tang, National Taiwan University, Taipei, Taiwan, and NSC97-2752-M-002-011-PAE to W.-Y.I. Tseng, National Taiwan University Hospital, Taipei, Taiwan) and in part by the Department of Medical Imaging in the National Taiwan University Hospital and 3T MRI Laboratory in National Taiwan University Hospital, Taipei, Taiwan. Please address correspondence to Wen-Yih I. Tseng, Center for Optoelectronic Biomedi-cine, College of MediBiomedi-cine, National Taiwan University, No. 1, Jen-Ai Rd., Sec. 1, Taipei 100, Taiwan, Republic of China; e-mail: [email protected]
Indicates open access to non-subscribers at www.ajnr.org DOI 10.3174/ajnr.A1981
BRAIN
ORIGINAL
with stroke.17-19This is because the FA values tend to decrease,
and the tensor orientations become disorganized in the infarct location and its surroundings. The tracking procedure of the tractography algorithm would come to a halt when the FA value or proceeding angle does not pass a default threshold. Even if the tractography is not interrupted, it is still difficult to obtain a minor branch of a tract bundle from the tractography because the tensor orientation is predominantly pointing to-ward the orientation of the major branches. Analysis of our unpublished laboratory data supported that these difficulties pose a great challenge to TS analysis of the CST if a minor branch, such as that corresponding to the lower extremity mo-tor control originated from M1, is to be assessed. In this study, we used DSI to address these problems.20,21DSI entails the acquisition of⬎200 diffusion-weighted images over the whole brain, where each diffusion weighting corresponds to a spe-cific encoding point in theq-space. DSI tractography has been demonstrated to differentiate the CST from other crossing fiber tracts, including the corpus callosum, superior longitu-dinal fasciculus, and middle cerebellar peduncle, and it has been shown to separate the branches arising from different cortical areas responsible for the movement of different body parts.22,23
Previous studies have investigated the reproducibility of TS analysis in patients with amyotrophic lateral sclerosis and in premature infants.9,11The same studies in patients with stroke are still lacking. Although there have been many studies by using ROI-based analysis to reveal the correlation between the FA and motor function in patients with stroke,1,2,4,24,25such
functional correlation studies by using the TS quantitative analysis have not yet been established. As for diffusion tensor tractography, only a qualitative analysis of the CST has been performed to relate the degrees of tract interruption and func-tional outcomes.17-19,26,27
Therefore, the goal of this study was to establish the reli-ability and validity of the TS analysis method. We acquired DSI data from patients with subcortical ischemic stroke, re-constructed the whole CST originating from the M1 region corresponding to the lower extremity motor control, and quantified the GFA at the segments covering the PLIC. The purpose of this study was 2-fold. First, we investigated the reliability of TS analysis of the CST or, more specifically, the intrarater and interrater reliability of the GFA values. Second, we tested the validity of the TS analysis by correlating the GFA values with the clinical motor function scores of the affected
lower limbs. In this study, the performance of the ROI-based analysis was also evaluated and compared with the TS analysis.
Materials and Methods
Subjects
Patients with stroke were recruited from the stroke registry of the Neurology Department at the National Taiwan University Hospital. The inclusion criteria of the patients to participate in this research were the following: 1) having first-ever ischemic stroke based on clin-ical imaging reports and physician diagnosis; 2) presenting subcorti-cal stroke with unilateral hemiplegia or hemiparesis; 3) showing mild-to-moderate severity of stroke, corresponding to the NIHSSⱕ1528; 4)
being between 40 and 80 years old; and 5) having no contraindica-tions for MR scanning, such as an electrical device implanted in the body or claustrophobia. Patients were excluded if they had cortical stroke, unstable medical conditions, impaired cognitive function, or were unable to communicate. All participants signed an informed consent form approved by the institutional review board.
We evaluated the function of cognition with the MMSE.29
Impair-ment in sensation, range of motion, and motor function of the af-fected lower extremity were evaluated by using the FMA-LE.30We
used Manual Muscle Testing31to check whether there was any muscle
weakness of the unaffected lower extremity. The reliability and valid-ity of these clinical assessments have been established.32-34
Seven patients with subcortical ischemic stroke participated in this study (4 men and 3 women; mean age, 59.2⫾7.9 years; 5 with right subcortical lesions and 2 with left subcortical lesions). The 7 subjects were all right-handed and right-footed before their stroke episode. All of them showed early (within 3 days of onset) NIHSS scores ranging from 2 to 8, indicating mild to moderate stroke in the acute stage (Table 1). All patients had normal cognitive function (MMSE⬎24, out of a total of 30) and intact sensory function of the affected lower extremities (FMA-LE sensory score of 24, out of a total of 24). One participant had moderate range of motion limitation at the hip and ankle joints of the affected lower extremity. The FMA-LE motor score of the affected lower extremities of the subjects ranged from 12 to 34 (out of a total of 34), indicating mild-to-moderate residual motor impairment (Table 1). All of the patients underwent MR imaging scanning⬃90 days (93.6⫾5.9 days) after stroke onset.
MR Data Acquisition
Patients were scanned on a 3T MR imaging system (Magnetom Trio; Siemens, Erlangen, Germany) with an 8-channel phased-array head coil. Head movement was restricted with expandable foam cushions.
Table 1: Demographics of stroke subjects
Subject Sex Age Handedness Footedness
Lesion Location
NIHSS (42)
Post-Onset Days
FMA-LE Sensation
(24)
FMA-LE Range of Motion (22)
FMA-LE Motor (34)
MMSE (30)
1 M 59.2 R R R corona radiata 7 89 24 15 12 29
2 F 66.1 R R R BG, PLIC 5 99 24 22 34 28
3 M 49.3 R R L thalamus 8 102 24 22 28 29
4 F 65.4 R R R corona radiata 4 87 24 22 34 25
5 F 69.0 R R R corona radiata 5 89 24 22 34 26
6 M 54.6 R R L thalamus, PLIC 7 98 24 22 28 30
7 M 50.7 R R R corona radiata 2 91 24 22 34 30
Mean 59.2 93.6 24.0 21.0 29.1 28.1
SD 7.9 5.9 0.0 2.7 8.1 1.9
An axial plane parallel to the anterior/posterior commissure line was determined for the section orientation of both the subsequent struc-tural MR imaging and the DSI scans. To provide an anatomic refer-ence, a T2-weighted fast spin-echo sequence was performed with 35 contiguous axial sections covering the whole brain (TR/TE⫽5290/ 102 ms, flip angle⫽150°, FOV⫽250⫻250 mm2, matrix⫽256⫻
256, section thickness⫽3.9 mm). The DSI data were acquired by using a pulsed gradient twice-refocused spin-echo echo-planar imag-ing sequence.35In this study, 203 diffusion gradient vectors were
ap-plied, each corresponding to one of the isotropic 3D grid points in the
q-space.36The maximum diffusion gradient was equivalent to the
maximum diffusion sensitivity (bmax) of 6000 s/mm2. The DSI data
were obtained at 2.9⫻2.9⫻2.9 mm3isotropic resolution (TR/TE⫽
9100/142 ms, flip angle⫽90°, FOV⫽370⫻370 mm2, matrix⫽
128⫻128, section thickness⫽2.9 mm). As a result, a total of 203 diffusion-weighted brain volumes were acquired, where each volume consisted of 45 transaxial sections encompassing the whole brain. We used a standard procedure to stabilize the head and body of the par-ticipants during the scanning to minimize the problem of head mo-tion. The total scan time was⬃45 minutes for each participant. All participants were able to tolerate the whole scanning section.
MR Data Analysis
Two raters (Z.-A.L. and Y.-H.K.), who are licensed physical therapists specialized in neurologic physical therapy and had had 2 years of intensive training on MR data acquisition and analysis, were first trained by the set of analysis guidelines described below. The relatively fair spatial resolution of the GFA maps on which the seed region/ROI areas were selected may also affect the reliability of the seed region/ ROI placement. To ameliorate this potential problem, the raters used the subjects’ T2-weighted structure images to guide the identification of anatomic landmarks on the GFA maps.
TS Quantitative Analysis
Having acquired the DSI data, the probability attenuation function at each pixel was reconstructed by performing a Fourier transform of the signal intensity in theq-space. The orientation distribution func-tion was then calculated by using the second moments of the proba-bility attenuation function in different radial directions.20The GFA,37
a quantitative index derived from the orientation distribution func-tion to indicate diffusion anisotropy, was calculated at each pixel. The fiber vectors at each pixel were also defined by selecting the peak orientations of the orientation distribution function.23
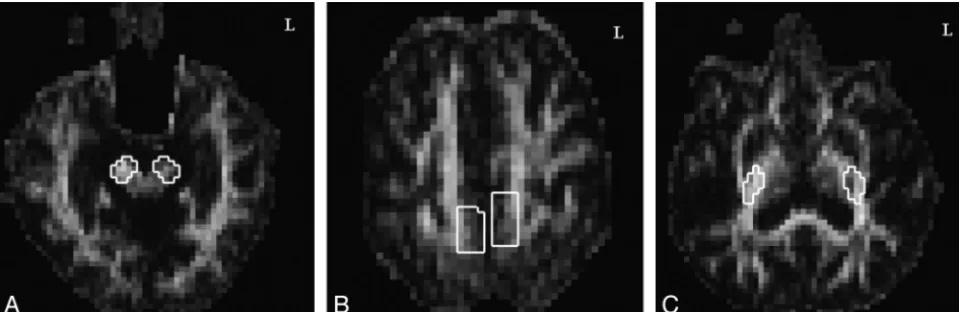
The reconstruction of the CST tractography was performed by a modified streamline method22by using the in-house software DSI Studio (http://sites.google.com/a/labsolver.org/dsi-studio/). The seed points for initiating the fiber tracking were placed at 2 seed regions: the CP at the midbrain level (Fig 1A) and the M1 (Fig 1B). The CST corresponding to motor control of the lower extremity was obtained by tracking through the 2 seed regions. The selection of the seed region at the CP was outlined by choosing the 2 sections containing the CP at the midbrain and then enclosing the pixels containing the CP area. The seed region at the lower extremity region of the precentral gyrus was defined as follows. First, from the vertex downward, we selected the first 4 sections that allowed clear identification of the precentral sulcus, precentral gyrus, cen-tral sulcus, and postcencen-tral gyrus. Second, we encompassed the region corresponding to motor control of the lower extremity in the precentral gyrus. The seed region that was thereby defined usually spanned 4 columns of pixels on each bank of the medial longitudinal fissure, and the seed region was typically located be-tween the precentral sulcus and central sulcus. To determine the propagating direction of a fiber vector in the seed region, trilinear interpolation was applied on the fiber orientations of neighboring voxels at the 8 corners. If voxels contained multiple fiber orienta-tions, the orientation closest to the previous propagating direction was selected for interpolation. The next point of the fiber tract was determined by the propagating direction. The procedures were performed recursively and terminated when the turning angle ex-ceeded a specific threshold, 32°, or when the tract reached a voxel without fibers. Using this method, the fiber tracts passing through both seed regions were retained to represent the CST originating from the lower extremity motor control of the M1 (Fig 2). The sections showing the PLIC were determined on the GFA map, and the weighted-average of the GFA at the PLIC segment, denoted GFAPLIC-TS, was calculated by multiplying the GFA of each pixel with a weighting factor proportional to the number of CST tracts passing through the same pixel. The measurement was performed in both the unaffected and affected hemispheres. We grouped the data according to affected and unaffected hemisphere in this study because previous research has suggested that handedness does not directly affect CST fiber characteristics38and that analysis of our
own unpublished data of 10 healthy adults shows that neither handedness nor footedness has an effect on GFA values of the CSTs of the 2 hemispheres.
Fig 1.Seed region and ROI placement on GFA maps at the (A) CP and (B) M1 in the TS analysis and at the (C) PLIC in the ROI-based analysis of bilateral CSTs corresponding to the lower
[image:3.594.55.535.43.199.2]ROI-Based Analysis
The mean GFA values at the PLIC segments were also calculated by using the ROI-based analysis. On all sections containing the PLIC on the GFA map, the posterior two-thirds of the PLIC were selected as the ROI to represent the lower extremity motor control area (Fig 1C). We obtained the GFA values of all selected pixels and calculated the mean GFA of the ROI at the PLIC, denoted GFAPLIC-ROI. The
mea-surement was also performed in both the unaffected hemisphere and affected hemisphere.
Statistical Analysis
To establish the intrarater and interrater reliabilities of the TS and ROI-based analyses, 2 raters (Y.-H.K. and Z.-A.L.) analyzed the data twice with a 1-week interanalysis interval. The intrarater and
interra-ter reliabilities were investigated on the seed region placement for the TS analysis and ROI placement for the ROI-based analysis. The statistics were used to evaluate the agreement of pixel coordinates for both the seeds at the CP and the motor control of the lower extremity at the M1 for the TS analysis, as well as at the PLIC for the ROI-based analysis. Avalue⬎0.80 was considered excellent agreement, and between 0.60 and 0.80 represented substantial levels of agreement.39
The intrarater and interrater reliabilities for the mean GFAPLIC-TSand mean GFAPLIC-ROIwere evaluated by ICC3,140and the standard error
of measurement.41An ICC value⬎0.75 was regarded as good
reliabil-ity.41The standard error of measurement (S
x公1⫺rxx, whereSxis the standard deviation of the set of observed values andrxxis the reliabil-ity of coefficient of the measure) is the standard deviation of the measurement errors, and thus smaller standard errors of measure-ment corresponds to better reliability of the GFA measures.41
By correlating the mean GFAPLIC-TSand GFAPLIC-ROIof the af-fected hemisphere analyzed by rater 1 (Z.-A.L.) with the FMA-LE rated by rater 2 (Y.-H.K.), by using the Pearson correlation coeffi-cients, we measured the relationships between the fiber integrity of the CST of the affected hemisphere and the motor function of the affected lower extremity.
The comparisons between the mean GFAPLIC-TSand GFAPLIC-ROI,
between their SDs, and between their CVs (⫽SD/mean) were per-formed by using a 2-tailed pairedttest. Statistical significance was considered forP⬍.05.
Results
Reliability
For the TS analysis, thevalues of intrarater reliability for the coordinates of the seeds in both the unaffected hemisphere and affected hemisphere ranged from 0.87 to 0.97 for rater 1 and from 0.79 to 0.95 for rater 2 (Table 2). Thevalues of interrater reliability ranged from 0.81 to 0.90 for the unaf-fected hemisphere and from 0.86 to 0.98 for the afunaf-fected hemi-sphere (Table 2). These results indicated substantial-to-excel-lent intrarater and interrater agreement on the seed region placement at the CP and the motor control of the lower ex-tremity at the M1.
The ICCs for intrarater reliability for the mean GFAPLIC-TS
in both the unaffected hemisphere and affected hemisphere ranged from 0.83 to 1.00 for rater 1 (P⬍.05) and from 0.96 to 1.00 for rater 2 (Table 3). The ICCs for interrater reliability for the mean GFAPLIC-TSwere 0.85 for the unaffected hemisphere
and 1.00 for the affected hemisphere (Table 3). The standard error of measurements of the mean GFAPLIC-TSin all intrarater
and interrater analyses wereⱕ0.01 (Table 3). The high ICCs and small standard error of measurements indicated excellent intrarater and interrater reliability for the mean GFAPLIC-TS
values.
For the ROI-based analysis, thevalues of intrarater reli-ability for the coordinates of the ROIs in both the unaffected hemisphere and affected hemisphere ranged from 0.93 to 0.98 for rater 1 and from 0.76 to 1.00 for rater 2 (Table 2). The mean
values for interrater reliability were 0.90 for the unaffected hemisphere and 0.91 for the affected hemisphere (Table 2). The results indicated excellent intrarater and interrater agree-ment for the ROI placeagree-ment at the PLIC.
The ICCs for intrarater reliability for the mean GFAPLIC-ROIvalues in both the unaffected hemisphere and
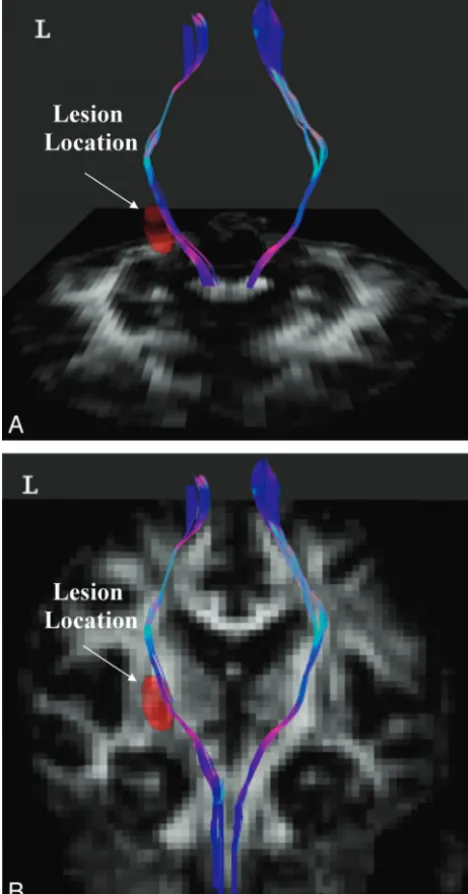
Fig 2.Tractography of bilateral CSTs corresponding to lower extremity motor control in a
[image:4.594.53.287.50.497.2]affected hemisphere were 0.99 or 1.00 (P⬍.05) for both rat-ers. The ICCs for interrater reliability were 1.00 for both the unaffected hemisphere and affected hemisphere (Table 3). The standard errors of measurements were 0.01 for all in-trarater and interrater reliability with the ROI-based analysis (Table 3). Therefore, there was excellent intrarater and inter-rater reliability for the mean GFAPLIC-ROIvalues.
Clinical Correlation of Motor Function of the Lower Extremities
We used the data analyzed by rater 1 to calculate the correla-tions between the GFA values of the affected hemisphere and
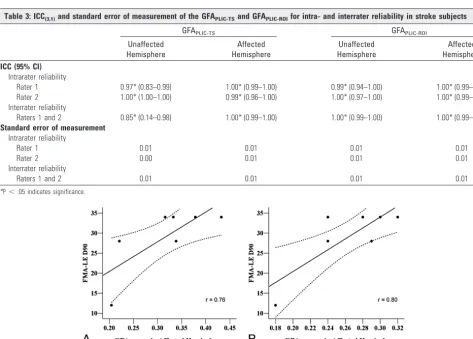
the FMA-LE motor scores. The results showed significantly high correlations of the FMA-LE motor score with the GFAPLIC-TS (r ⫽ 0.76, P ⬍ .05) (Fig 3A) and with the
GFAPLIC-ROI(r⫽0.80,P⬍.05) (Fig 3B).
Comparison of GFAPLIC-TSand GFAPLIC-ROI
We used the data analyzed by rater 1 to compare the differ-ences between the GFAPLIC-TSand GFAPLIC-ROI(Table 4). The
GFAPLIC-TSwas highly correlated with the GFAPLIC-ROIfor the
[image:5.594.52.537.58.207.2]affected hemisphere (r⫽0.90,P⬍.05), but not for the unaf-fected hemisphere (r⫽ ⫺0.15,P⬎.05). The values for the mean GFAPLIC-TSof the unaffected hemisphere (0.43⫾0.02) Table 2: Kappa values for agreement on the seed region and ROI placement in the TS and ROI-based analyses
Subject
TS Analysis ROI-Based Analysis
Intrarater Interrater:
Raters 1 and 2
Intrarater Interrater:
Raters 1 and 2
Rater 1 Rater 2 Rater 1 Rater 2
UH AH UH AH UH AH UH AH UH AH UH AH
1 0.93 0.93 0.95 0.82 0.85 0.90 0.95 0.93 0.91 0.95 0.87 0.84
2 0.97 0.97 0.87 0.82 0.87 0.90 0.95 0.95 0.93 0.99 0.93 0.93
3 0.94 0.87 0.93 0.89 0.82 0.87 0.93 0.94 0.91 0.89 0.86 0.92
4 0.92 0.88 0.79 0.83 0.81 0.98 0.95 0.95 0.84 0.89 0.89 0.93
5 0.96 0.93 0.93 0.91 0.90 0.90 0.95 0.95 1.00 0.76 0.92 0.91
6 0.97 0.94 0.92 0.92 0.89 0.86 0.98 0.94 0.89 0.82 0.91 0.90
7 0.93 0.97 0.89 0.93 0.84 0.92 0.95 0.97 0.91 1.00 0.89 0.94
Mean 0.95 0.93 0.90 0.87 0.85 0.90 0.95 0.95 0.91 0.90 0.90 0.91
[image:5.594.54.527.211.549.2]SD 0.02 0.04 0.05 0.05 0.03 0.04 0.01 0.01 0.05 0.09 0.03 0.03
Table 3: ICC(3,1)and standard error of measurement of the GFAPLIC-TSand GFAPLIC-ROIfor intra- and interrater reliability in stroke subjects
GFAPLIC-TS GFAPLIC-ROI
Unaffected Hemisphere
Affected Hemisphere
Unaffected Hemisphere
Affected Hemisphere ICC (95% CI)
Intrarater reliability
Rater 1 0.97* (0.83–0.99) 1.00* (0.99–1.00) 0.99* (0.94–1.00) 1.00* (0.99–1.00) Rater 2 1.00* (1.00–1.00) 0.99* (0.96–1.00) 1.00* (0.97–1.00) 1.00* (0.99–1.00) Interrater reliability
Raters 1 and 2 0.85* (0.14–0.98) 1.00* (0.99–1.00) 1.00* (0.99–1.00) 1.00* (0.99–1.00) Standard error of measurement
Intrarater reliability
Rater 1 0.01 0.01 0.01 0.01
Rater 2 0.00 0.01 0.01 0.01
Interrater reliability
Raters 1 and 2 0.01 0.01 0.01 0.01
*P⬍.05 indicates significance.
Fig 3.Scatterplots of the correlation between (A) the GFAPLIC-TSof the affected hemisphere and the FMA-LE motor score (r⫽0.76), and (B) the GFAPLIC-ROIof the affected hemisphere
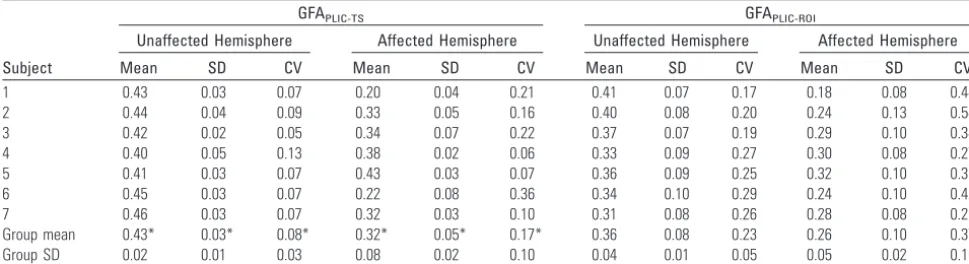
and affected hemisphere (0.32 ⫾ 0.08) were significantly greater than the mean GFAPLIC-ROIof the unaffected
hemi-sphere (0.36⫾0.04) and affected hemisphere (0.26⫾0.05) (P⬍.05). The CVs for the mean GFAPLIC-TSof the unaffected
hemisphere (mean CVs ⫽ 0.08) and affected hemisphere (mean CVs⫽0.17) were significantly smaller than those of the mean GFAPLIC-ROI(mean CVs⫽0.23 for the unaffected
hemi-sphere, 0.37 for the affected hemisphere) (P⬍.05).
Discussion
By analyzing the DSI data of the patients with subcortical isch-emic stroke, we investigated the reliability and validity of TS analysis on the CST, and we compared the performance with that of the ROI-based analysis. We found excellent intrarater and interrater reliability for both TS- and ROI-based analyses in the seed region or ROI placement and in the mean GFA values. In the affected hemisphere, the mean GFA measured from both analyses showed high correlation with the motor function of the affected lower extremity. Although the GFA values measured by both analyses were correlated, the TS anal-ysis yielded significantly higher mean GFA and lower variance than did the ROI-based analysis.
Several factors may affect the agreement on seed region and ROI placement. The rater’s knowledge and familiarity with brain anatomy is a key factor in determining the proper selec-tion of the seed region and ROI, which in turn influences the reliability of the seed region and ROI placement.8In this study,
using a set of guidelines and the T2-weighted template, in addition to adequate personnel training, may have helped us establish excellent reliability in both analyses.
Our excellent intrarater and interrater reliability for the seed region and ROI placement have led to the excellent reli-ability of the measured GFA values. Hong et al9used both
TS-and ROI-based analyses to investigate the interrater reliability of the FA values of the pyramidal tracts at the CP in patients with amyotrophic lateral sclerosis. Hong et al9found
signifi-cantly higher interrater reliability of FA values in the TS anal-ysis (Spearman correlation coefficientrs⫽0.91) compared with those in the ROI-based analysis (rs⫽0.70). In contrast, our results did not show poorer reliability of the GFAPLIC-ROI
as compared with that of the GFAPLIC-TS. This discrepancy
may be due to the relatively clearer boundary of the CST at the PLIC region than at the CP. Furthermore, the pyramidal tracts in the brain stem are close to the space containing the CSF9
and to other crossing tracts.22Therefore, the ROI-based
anal-ysis at the brain stem region is more subject to partial volume effects than at the PLIC region.
Ozturk et al8investigated the intrarater and interrater
reli-ability of the FA at the PLIC region by using ROI-based anal-ysis in 5 healthy controls and 7 subjects with closed-head in-juries. They reported a low level ( ⫽ 0.08) of intrarater reliability and a fair level (⫽0.31) of interrater reliability, which may be related to the long interanalysis interval (4 –12 weeks) and no use of a template for ROI delineation. In sum-mary, according to our results, both the TS quantitative anal-ysis and the ROI-based analyses are reliable approaches for DSI data analysis and may be performed in future clinical DSI studies. The set of clear guidelines, adequate training of raters, and better ROI delineation at the PLIC region may lead to better results for reliability than the previous reports.
In this study, we found significantly good-to-excellent cor-relation of the GFAPLIC-TSor GFAPLIC-ROIwith the FMA-LE.
Previously, similar studies have been performed by using ROI-based analysis of DTI data to show a high correlation between the FA values and the overall muscle strength of the affected extremities (by using the total score of Manual Muscle Testing or Motricity Index)2,42and the hand function6,7in patients with subacute or chronic ischemic stroke. Using the TS anal-ysis, we have successfully demonstrated that the fiber integrity of the affected CST corresponding to the lower extremity mo-tor control originating from the M1 is strongly correlated with the motor function of the affected lower extremity (r⬎0.75). Our findings suggest that the integrity of the CST fibers orig-inating from the M1 plays an important role in lower extrem-ity motor recovery. Our approach may allow future research using the TS analysis to study the relationships between the fiber integrity of a particular fiber tract and the motor function of a particular body part.
Our findings that the correlation between the GFAPLIC-ROI
and the FMA-LE of the affected lower extremity (r⫽0.80) was slightly higher than that between the GFAPLIC-TS and the
FMA-LE (r⫽0.76) may be due to differences in the CST fibers selected by the 2 analyses. Studies by using functional MR imaging in patients with ischemic stroke have found that the brain activation areas during unilateral movement of the af-fected lower extremity include the ipsilesional M1, supple-mentary motor area, and secondary sensorimotor corti-ces.43,44The descending motor fibers originating from these
[image:6.594.53.538.59.191.2]areas all pass through the PLIC region. Our TS quantitative analysis included only the spared CST fibers originating from
Table 4: Mean, SD, and CV of the GFA values by TS analysis and ROI-based analysis (rater 1)
Subject
GFAPLIC-TS GFAPLIC-ROI
Unaffected Hemisphere Affected Hemisphere Unaffected Hemisphere Affected Hemisphere
Mean SD CV Mean SD CV Mean SD CV Mean SD CV
1 0.43 0.03 0.07 0.20 0.04 0.21 0.41 0.07 0.17 0.18 0.08 0.44
2 0.44 0.04 0.09 0.33 0.05 0.16 0.40 0.08 0.20 0.24 0.13 0.54
3 0.42 0.02 0.05 0.34 0.07 0.22 0.37 0.07 0.19 0.29 0.10 0.34
4 0.40 0.05 0.13 0.38 0.02 0.06 0.33 0.09 0.27 0.30 0.08 0.27
5 0.41 0.03 0.07 0.43 0.03 0.07 0.36 0.09 0.25 0.32 0.10 0.31
6 0.45 0.03 0.07 0.22 0.08 0.36 0.34 0.10 0.29 0.24 0.10 0.42
7 0.46 0.03 0.07 0.32 0.03 0.10 0.31 0.08 0.26 0.28 0.08 0.29
Group mean 0.43* 0.03* 0.08* 0.32* 0.05* 0.17* 0.36 0.08 0.23 0.26 0.10 0.37
Group SD 0.02 0.01 0.03 0.08 0.02 0.10 0.04 0.01 0.05 0.05 0.02 0.10
the M1 area. Our ROI-based method enclosed the posterior two-thirds of the PLIC, which included not only spared CST fibers originating from the M1 but also those originating from other secondary cortical motor areas. Because all of these fi-bers contribute to motor recovery, this might lead to a slightly higher correlation between the GFAPLIC-ROIand the FMA-LE.
Although the GFAPLIC-TSand GFAPLIC-ROIin the affected
hemisphere were highly correlated with each other and both values were correlated with the motor function of the affected lower extremity, the TS analysis yielded higher mean GFA val-ues and less variability, as revealed by the lower standard de-viation and coefficient of variance of GFA values, than did the ROI-based analysis. One reason for this discrepancy may be that the ROI-based method possibly includes pixels with evi-dently low GFA values, whereas the tractography preferen-tially passes through the relatively spared regions and samples pixels with relatively higher GFA values. Another reason may be due to the method for calculating the mean GFA values. In our TS analysis, the mean GFAPLIC-TSwas calculated as the
weighted sum of the GFA values of each individual pixel, with the weighting factors scaled to the number of tracts passing through the same pixel. This was to give more weighting to pixels with a greater number of fibers passing through than to those with fewer fibers passing through. In contrast, in our ROI-based analysis, the GFA values of the selected pixels were averaged with equal weights, which was consistent with con-ventional ROI analysis.2,6,7
Generally speaking, due to the inherent differences in the GFA sampling and calculation, the ROI analysis focuses more on functional-related regions of white matter, whereas the TS analysis allows for investigation of fiber properties of tract-specific regions and provides information about properties of particular fiber tracts of interest. The strength of the ROI-based analysis is that the obtained GFAPLIC-ROIvalues can be
considered to represent the overall integrity of a white matter region, where both injured and spared fibers involved in lower extremity motor control are enclosed. Thus, the GFAPLIC-ROI
would show a high correlation with a more general clinical outcome measure, such as the FMA-LE, of lower extremity motor control. Using ROI-based analysis, however, may po-tentially enclose fibers originating from different cortical mo-tor areas, which makes it difficult to differentiate the degree of contributions from different motor areas to the recovery of lower extremity motor control. On the other hand, the TS analysis has the advantage of specifically evaluating the degree of integrity in the relatively spared tract region of the CST fibers originating from the lower extremity motor control re-gion of the M1. This method also has the potential to allow researchers to examine other specific fibers of interest, such as those originating from secondary motor cortical areas. With this specificity of the fibers reconstructed by using the TS anal-ysis, the GFAPLIC-TSmay inevitably yield a slightly smaller
cor-relation with the global clinical outcome measure FMA-LE than the GFAPLIC-ROI. Therefore, the decision regarding which
method to be used in a study will depend on the purpose of the study.
There are a few limitations of this study. First, the sample size may be too small for the generalization of our results on rater comparison. We have performed similar rater compari-son on DSI data of 10 healthy subjects by using the same
anal-ysis algorithm. The results yielded the similarly high intra- and interrater reliabilities. Second, the success of the TS analysis relies mainly on the accurate reconstruction of the tractogra-phy over the entire CST. The tractogratractogra-phy may be interrupted in severe stroke, where low GFA values involve a large area, or in hemorrhagic stroke, where some derivatives of hemoglobin may induce severe magnetic susceptibilities. Further research on patients with greater stroke severity will be needed. Third, scan time required to acquire DSI data may potentially in-crease the likelihood of patient motion, which then can cause blurring of the image data and reduce the angular resolution of the orientation distribution function,45consequently
result-ing in the failure of the tractography reconstruction. In this study, all participants tolerated the scan time well and pre-sented little head motion during the scan. The tractography of the CST was successfully reconstructed from all of the partic-ipants, but difficulties may arise when it is applied to patients with a wider range of clinical problems.
In this study, the seeds/ROI placement is selected manually by following a set of guidelines. An emerging method of re-constructing white matter fibers is by using functional MR imaging-guided fiber tracking technology. This technology has been performed in healthy participants46and in patients
with brain tumors47,48by using DTI. This methodology has
potential to be used in patients with stroke for mapping the cortical representations for upper and lower extremity motor function and guiding the placement of seeds for reconstruct-ing CST fibers associated with upper and lower extremity mo-tor function. However, we also foresee 2 major difficulties when applying this technology in patients with stroke. First, patients with stroke may have difficulty performing isolated joint movements without any associated movements or spas-ticity, which then may cause larger head motion during MR imaging.44,49Second, the BOLD signals in ipsilesional M1 may
be significantly decreased or even absent while patients with stroke perform movements with the affected upper or lower extremity.50-53 Movement-related BOLD signals may shift
from the primary motor cortex to secondary association mo-tor networks or even the contralesional hemisphere in re-sponse to stroke lesions.53,54More research will be needed to
validate the usage of this new technology in patients with stroke.
Conclusions
In this study, we have demonstrated good reliability and va-lidity of the TS analysis method and ROI-based analysis method of the CST. Both analysis methods indicate that the GFA values at the PLIC segments of the CST in the affected hemisphere are highly correlated with motor function of the affected lower extremity in patients with ischemic stroke. The different mean GFA and its variance derived from the 2 meth-ods imply that the inherent differences in sampling and calcu-lation of the 2 methods might provide different information about the tract integrity.
Acknowledgments
References
1. Liang Z, Zeng J, Liu S, et al.A prospective study of secondary degeneration following subcortical infarction using diffusion tensor imaging.J Neurol Neu-rosurg Psychiatry2007;78:581– 86
2. Thomalla G, Glauche V, Koch MA, et al.Diffusion tensor imaging detects early wallerian degeneration of the pyramidal tract after ischemic stroke. Neuroim-age2004;22:1767–74
3. Basser PJ.Inferring microstructural features and the physiological state of tissues from diffusion-weighted images.NMR Biomed1995;8:333– 44 4. Liang Z, Zeng J, Zhang C, et al.Longitudinal investigations on the anterograde
and retrograde degeneration in the pyramidal tract following pontine infarc-tion with diffusion tensor imaging.Cerebrovasc Dis2008;25:209 –16 5. Yu C, Zhu C, Zhang Y, et al.A longitudinal diffusion tensor imaging study on
wallerian degeneration of corticospinal tract after motor pathway stroke.
Neuroimage2009;47:451–58
6. Lindberg PG, Skejo PH, Rounis E, et al.Wallerian degeneration of the corti-cofugal tracts in chronic stroke: a pilot study relating diffusion tensor imag-ing, transcranial magnetic stimulation, and hand function.Neurorehabil Neu-ral Repair2007;21:551– 60
7. Stinear CM, Barber PA, Smale PR, et al.Functional potential in chronic stroke patients depends on corticospinal tract integrity.Brain2007;130:170 – 80 8. Ozturk A, Sasson AD, Farrell JA, et al.Regional differences in diffusion tensor
imaging measurements: assessment of intrarater and interrater variability.
AJNR Am J Neuroradiol2008;29:1124 –27
9. Hong YH, Sung JJ, Kim SM, et al.Diffusion tensor tractography-based analy-sis of the pyramidal tract in patients with amyotrophic lateral scleroanaly-sis.J Neu-roimaging2008;18:282– 87
10. Kanaan RA, Shergill SS, Barker GJ, et al.Tract-specific anisotropy measure-ments in diffusion tensor imaging.Psychiatry Res2006;146:73– 82
11. Partridge SC, Mukherjee P, Berman JI, et al.Tractography-based quantitation of diffusion tensor imaging parameters in white matter tracts of preterm new-borns.J Magn Reson Imaging2005;22:467–74
12. Wang S, Melhem ER.Amyotrophic lateral sclerosis and primary lateral
sclerosis: the role of diffusion tensor imaging and other advanced MR-based techniques as objective upper motor neuron markers.Ann N Y Acad Sci
2005;1064:61–77
13. Berman JI, Mukherjee P, Partridge SC, et al.Quantitative diffusion tensor MRI fiber tractography of sensorimotor white matter development in premature infants.Neuroimage2005;27:862–71
14. Mori S, Crain BJ, Chacko VP, et al.Three-dimensional tracking of axonal projections in the brain by magnetic resonance imaging. Ann Neurol
1999;45:265– 69
15. Mori S, van Zijl PC.Fiber tracking: principles and strategies—a technical review.NMR Biomed2002;15:468 – 80
16. Sage CA, Peeters RR, Gorner A, et al.Quantitative diffusion tensor imaging in amyotrophic lateral sclerosis.Neuroimage2007;34:486 –99
17. Cho SH, Kim DG, Kim DS, et al.Motor outcome according to the integrity of the corticospinal tract determined by diffusion tensor tractography in the early stage of corona radiata infarct.Neurosci Lett2007;426:123–27
18. Jang SH, Bai D, Son SM, et al.Motor outcome prediction using diffusion
tensor tractography in pontine infarct.Ann Neurol2008;64:460 – 65 19. Jang SH, Park KA, Ahn SH, et al.Transcallosal fibers from corticospinal tract
in patients with cerebral infarct.NeuroRehabilitation2009;24:159 – 64 20. Wedeen VJ, Hagmann P, Tseng WY, et al.Mapping complex tissue architecture
with diffusion spectrum magnetic resonance imaging.Magn Reson Med
2005;54:1377– 86
21. Wedeen VJ, Reese TG, Tuch DS, et al.Mapping fiber orientation spectra in cerebral white matter with Fourier-transform diffusion MRI.In: Proceedings of the Eighth Meeting of the International Society for Magnetic Resonance in Medicine. Berkeley, CA: International Society for Magnetic Resonance in Med-icine, 2000:82
22. Wedeen VJ, Wang RP, Schmahmann JD, et al.Diffusion spectrum magnetic
resonance imaging (DSI) tractography of crossing fibers. Neuroimage
2008;41:1267–77
23. Yeh FC, Wedeen VJ, Tseng WYI.A recursive algorithm to decompose orienta-tion distribuorienta-tion funcorienta-tion and resolve intra-voxel fiber direcorienta-tions.In: Inter-national Society for Magnetic Resonance in Medicine 16th Scientific Meeting and Exhibition, Toronto, Ontario, Canada, May 3–9, 2008
24. Maniega SM, Bastin ME, Armitage PA, et al.Temporal evolution of water dif-fusion parameters is different in grey and white matter in human ischaemic stroke.J Neurol Neurosurg Psychiatry2004;75:1714 –18
25. Pierpaoli C, Barnett A, Pajevic S, et al.Water diffusion changes in wallerian degeneration and their dependence on white matter architecture.Neuroimage
2001;13:1174 – 85
26. Lai C, Zhang SZ, Liu HM, et al.White matter tractography by diffusion tensor
imaging plays an important role in prognosis estimation of acute lacunar in-farctions.Br J Radiol2007;80:782– 89
27. Nelles M, Gieseke J, Flacke S, et al.Diffusion tensor pyramidal tractography in patients with anterior choroidal artery infarcts.AJNR Am J Neuroradiol
2008;29:488 –93
28. Brott T, Adams HP Jr, Olinger CP, et al.Measurements of acute cerebral
infarction: a clinical examination scale.Stroke1989;20:864 –70
29. Folstein MF, Folstein SE, McHugh PR.“Mini-mental state”: a practical method for grading the cognitive state of patients for the clinician.J Psychiatr Res
1975;12:189 –98
30. Fugl-Meyer AR, Jaasko L, Leyman I, et al.The post-stroke hemiplegic patient, I: A method for evaluation of physical performance.Scand J Rehabil Med
1975;7:13–31
31. Hislop HJ, Montgomery J.Daniels and Worthingham’s Muscle Testing: Tech-niques of Manual Examination.Philadelphia: Saunders; 2002
32. Albert M, Cohen C.The test for severe impairment: an instrument for the assessment of patients with severe cognitive dysfunction.J Am Geriatr Soc
1992;40:449 –53
33. Duncan PW, Propst M, Nelson SG.Reliabitily of the Fugl-Meyer assessment of sensorimotor recovery following cerebrovascular accident. Phys Ther
1983;63:1606 –11
34. Molloy DW, Standish TI.A guide to the standardized Mini-Mental State Ex-amination.Int Psychogeriatr1997;9(suppl 1):87–94; discussion 143–50 35. Reese TG, Heid O, Weisskoff RM, et al.Reduction of eddy-current-induced
distortion in diffusion MRI using a twice-refocused spin echo.Magn Reson Med2003;49:177– 82
36. Kuo LW, Chen JH, Wedeen VJ, et al.Optimization of diffusion spectrum im-aging and q-ball imim-aging on clinical MRI system.Neuroimage2008;41:7–18 37. Tuch DS.Q-ball imaging.Magn Reson Med2004;52:1358 –72
38. Westerhausen R, Huster RJ, Kreuder F, et al.Corticospinal tract asymmetries at the level of the internal capsule: is there an association with handedness? Neu-roimage2007;37:379 – 86
39. Landis JR, Koch GG.The measurement of observer agreement for categorical data.Biometrics1977;33:159 –74
40. Shrout PE, Fleiss JL.Intraclass correlations: users in assessing rater reliability.
Psychol Bull1979;86:420 –28
41. Portney L, Watkins M.Foundations of Clinical Research: Applications to Practice.
Upper Saddle River, NJ: Pearson Education; 2009
42. Kunimatsu A, Aoki S, Masutani Y, et al.Three-dimensional white matter trac-tography by diffusion tensor imaging in ischaemic stroke involving the corti-cospinal tract.Neuroradiology2003;45:532–35
43. Enzinger C, Johansen-Berg H, Dawes H, et al.Functional MRI correlates of lower limb function in stroke victims with gait impairment. Stroke
2008;39:1507–13
44. Luft AR, Forrester L, Macko RF, et al.Brain activation of lower extremity movement in chronically impaired stroke survivors. Neuroimage
2005;26:184 –94
45. Chiang WY, Wedeen VJ, Reese TG, et al.Motion artifact for diffusion spectrum imaging.In: International Society for Magnetic Resonance in Medicine15th Scientific Meeting and Exhibition, Berlin, Germany, May 19 –25, 2007
46. Staempfli P, Reischauer C, Jaermann T, et al.Combining fMRI and DTI: a
framework for exploring the limits of fMRI-guided DTI fiber tracking and for verifying DTI-based fiber tractography results.Neuroimage2008;39:119 –26 47. Kleiser R, Staempfli P, Valavanis A, et al.Impact of fMRI-guided advanced DTI
fiber tracking techniques on their clinical applications in patients with brain tumors.Neuroradiology2010;52:37– 46
48. Smits M, Vernooij MW, Wielopolski PA, et al.Incorporating functional MR imaging into diffusion tensor tractography in the preoperative assessment of the corticospinal tract in patients with brain tumors.AJNR Am J Neuroradiol
2007;28:1354 – 61
49. Luft AR, Smith GV, Forrester L, et al.Comparing brain activation associated with isolated upper and lower limb movement across corresponding joints.
Hum Brain Mapp2002;17:131– 40
50. Dobkin BH, Firestine A, West M, et al.Ankle dorsiflexion as an fMRI paradigm to assay motor control for walking during rehabilitation. Neuroimage
2004;23:370 – 81
51. Jang SH, Kim YH, Cho SH, et al.Cortical reorganization associated with motor recovery in hemiparetic stroke patients.Neuroreport2003;14:1305–10
52. Kim YH, You SH, Kwon YH, et al.Longitudinal fMRI study for locomotor
recovery in patients with stroke.Neurology2006;67:330 –33
53. Ward NS, Newton JM, Swayne OB, et al.Motor system activation after subcor-tical stroke depends on corticospinal system integrity.Brain2006;129:809 –19
54. Ward NS, Cohen LG.Mechanisms underlying recovery of motor function