Abstract—In this paper, renewable energies have been re-addressed with respect to the potentials and feasibility of being incorporated in process industries. Within a process, utility system is considered to be the most appropriate place for using sustainable energies. For integrating the renewable energies, the pinch analysis is applied as the main tool to provide opportunity for energy conservation. The results demonstrated that the power generation by the wind is the most cost effective and environmentally friendly option for energy conservation in comparison to the other sustainable resources. However the tidal energy stands the least due to the long payback period. Also, a computer program has been developed, using MATLAB 7.3, to screen out different scenarios and perform economic study. The outcome data showed that, there are several different opportunities for the integration of alternative energies. Finally, this method has been applied to a case study and various retrofit projects have been identified, each of which has certain amount of CO2 reduction and estimated values for the required investment, saving potential and payback period.
Index Terms— Renewable energy, pinch analysis, energy
conservation, utility system.
I. INTRODUCTION
Renewable energy technologies are developing rapidly. It is generally anticipated these new resources, solar, wind, biomass, geothermal, hydropower and tidal will be increasingly economic competitive with fossil fuels. Utilizing fossil fuels in order to meet rising demands has negative effects on the environment. The latest computer models predict the global temperature could raise 1 to 3 degree Centigrade by the middle of next century if current trends persist [1]. Whereas, the Renewable Energy Sources (RES) that use the domestic resources have the potential to provide energy services with zero or almost zero emissions of both air pollutants and greenhouse gases, due these positive effects make the sustainable energies the environmentally suitable alternatives.
A worldwide research and development in the field of RES is carried out during the last two decades. Virtually, all of the renewable have been used by humans for centuries to provide energy services. For example, wind power has been used for powering sailing ships for over 1000 years [2]. Geothermal hot water has been employed for bathing, washing and other direct heating purposes [3]. Hydropower first began to produce electricity in the 19th century, and before that, it
Manuscript received June 21, 2008. This work was supported in part by the Iranian Fuel Conservation Organization (IFCO).
M. H. Panjeshahi is with the Department of Chemical engineering, University of Tehran, Tehran, P.O. Box: 11155-4563 Iran (e-mail: [email protected]).
L. Ahmadi is with the Department of Energy Engineeering, K.N. Toosi University of Technology, Teharn, P.O. Box: 1999143344 Iran (corresponding author to provide phone: (+)98-21-22272723; fax: (+)98-21-22410128; [email protected]).
S. Perry is with the Process Integration Department, University of Manchester, Manchester, P.O. Box: 88, UK (e-mail: [email protected]).
provided mechanical energy for grinding grains and running machinery around the world. Nowadays, only small fraction, about 10%, of the world’s primary energy is provided by the renewable sources [4]. Therefore, more attention should be paid to the incorporation of these energies into the industrial scale projects.
In this study, the potential and the capability of the Renewable Energies Integration into the Process industry (REIP) have been investigated. To achieve the above objective, a mathematical model, Renewable Energy Model (REM), has been developed. Furthermore, the comparison between the sustainable energies has been inspected and the most appropriate ones amongst the other recourses have been decided. In the REM, the utility systems, as the most appropriate place for using the alternative energies, are studied as part of a sustainable industrial activity that retains the capacity of ecosystems to support both life and industrial activities.
II. PROCESSINTEGRATION
Process integration is a systematic approach that looks at the unity of the holistic system rather than individual units and streams that make-up the process. It refers to the system-oriented, thermodynamics-based, integrated methodologies to the analysis, synthesis and retrofit of process plants. This technique emphasizes on analyzing the overall picture and the system insights first and then delving into the details of the equipment, simulation and other details [5]. The objectives of the process integration are to increase the energy conservation and minimize the fuel consumption, generation of the emissions and wastes. The integration using pinch analysis technology [6] and [7] helps in better understanding of the interactions in the system and results in sound decisions of the performance.
Pinch Analysis technology as the superior integration tools for design as well as retrofit projects, deals with the pollution prevention and resource recovery. In this approach, Site Utility Grand Composite Curve (SUGCC) has been graphed. The steam loads at different levels, shown in SUGCC, have been decreased due to the reduction of the generated power by conventional plant through REIP. To achieve the above objective, a mathematical model, REM, of sustainable integration has been developed. The model has then been solved through an algorithm via a mathematical-iterational procedure.
III. MATHEMATICALMODELOFRENEWABLE INTEGRATION
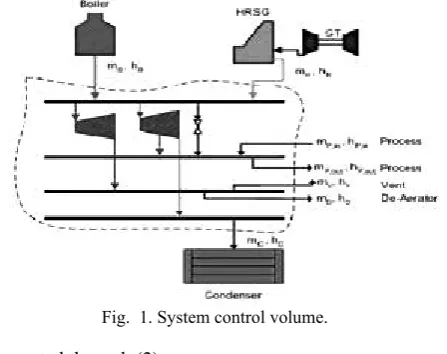
For integrating the renewable energies into process industries, related balances on the steam network have been illustrated (Fig. 1). The mass balance equation has been written via (1) and the energy balance of the network is
Renewable Energies and Utility Systems
Fig. 1. System control volume.
represented through (2).
, , 1
, , , , 2
The conservational equations on the turbine control volume have been expressed by (3). , , , ., 3
In the above equation FT is the throttle flow (the same as m) and α refers to the turbines with the same input steam levels. The turbines with the same output steam level, β, are demonstrated via (4). , , , ., 4
The above equations yield to (5). , 5
The minimum generated power through turbines has been carried out via the Willans line, the (6), 7), 8) and (9) are used [8]. n1 is the slope and Wint is the intercept the Willans line; ∆His is the isentropic enthalpy change. 6
1 ⁄ ∆ 7
⁄ ∆ 8
∆ 9
The reduction of generated power has been achieved through (10). , , , 10
The cost of saved steam at each level is represented by (11). Steam Saving at each level Saved steam in level Cost of Steam 11
The capable amount of throttle flow reduction of turbine has been illustrated via (12). , ., , ., 12
The amount of energy conservation has been carried out through (13). Energy Saving = Saved steam ⁄ Initial amount of steam 13 The cost calculations have been written by (14) [9], [10] and [11]. Investment cost = Saved steam Cost of each RES 14
The payback period (pb) and the value of conserved power (PS) can be obtained via Eq.(15) and Eq.(16) respectively. ⁄ 15
16
The emission reduction (EmR), CO2, NOx, SO2 and ash of the integrated plant through the renewable energies is illustrated through (17) [12]. 17
The computational procedure is outlined in Fig. 2. A case study, which is developed in Department of Process Integration, University of Manchester, has been applied to investigate the REIP.
IV. CASESTUDY
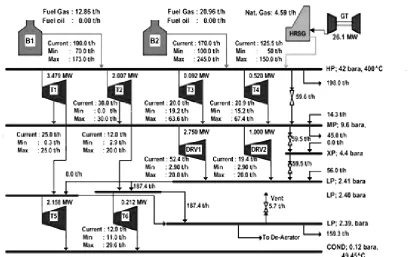
Fig. 3 shows an existing site utility system. Steam generated at high pressure (HP), which is distributed around the site, along with steam at medium pressure (MP), and low pressure (LP). Steam is expanded through a network of steam turbines from the HP main to the lower pressure mains. Steam is used for process heating from the HP, MP and LP mains, Turbines T1 to T6 generate electricity. Turbines T5 and T6 are condensing turbines. Turbines DRV1 and DRV2 are driver turbines connected directly to process machines. The maximum, minimum and the current flows in each part of the system have been shown in Fig.3. The ancillary data for the utility system in Fig.3 are given in Table 1. Data for the steam turbines are given in Table 2 [8].
The most important results of the calculations were demonstrated and discussed.
V. RESULTSANDDISCUSSION
It has been noted from the result that wind and hydropower are the most economically competitive amongst the other renewable energies. The tidal source payback is so high, approximately 11 times of the wind, which makes it an inappropriate alternative for integration purpose.
The energy conservation as the result of applying the REIP methodology, with the objective of energy system evaluation and power generation, has been achieved. The results have been demonstrated 5.132% energy saving. The results show that by integrating more RES, however the energy conservation increases; the system reliability decreases due to the steam turbine shut-down problem.
A. Environmental Issues
[image:4.595.333.523.51.213.2]The REIP methodology has been introduced to replace the alternatives to reduce the utilization of conventional resources. The emission reduction as the result of applying the REIP has been presented. Global warming has been increasingly associated with the contribution of CO2. As shown in Fig. 5, the CO2 reduction achieved through REIP is so high that makes renewable energies suitable choices for global warming concern. Sulfur dioxide (SO2), which leads to lung diseases, and nitrogen oxides (NOX) that are produced from burning conventional types, are the major contributors to smog and acid rain. Fig 6, illustrated the SO2 and NOX reduction resulted from alternative integration.
Table I. Ancillary data for the site utility system.
[image:4.595.313.540.258.476.2]Ambient temperature 25 °C Boiler feedwater temperature 80 °C Cooling water temperature 25 °C Site power demand 50 MW Minimum power import 10 MW Maximum power import 50 MW Minimum power export 0 MW Maximum power export 20 MW Power cost (import) 0.045 $.KWh-1 Power value (export) 0.06 $.KWh-1
Table II. Steam turbine data for the utility system.
Turbine: Stage a b L T1: HP-MP 0 1.96 0.228 T1: MP-LP 0 3.15 0.010 T2: HP-MP 0 1.825 2.802 T2: MP-LP 0 3.152 0.193
T3 0 1.43 0.429
T4 0 1.47 0.289
T5 0 1.46 0.229
T6 0 1.045 0.588
DRV1 0 1.5 0.100
[image:4.595.68.274.392.515.2]DRV2 0 1.53 0.040
Table III. Fuel costs for the utility system.
Fuel Net heating value (kJ.kg-1) Price
($.kg-1) ($.kWh-1) Fuel oil 40,245 0.071 0.0063 Fuel gas 32,502 0.103 0.0115 Natural gas 46,151 0.160 0.0125
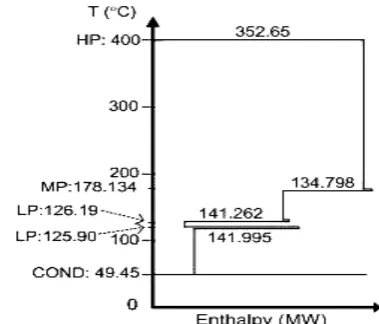
Fig. 2. The Site Utility Grand Composite Curve (SUGCC).
Table IV. Comparison of IC and Pb of different renewable energies.
RE source IC (MM$) Pb (yr)
Solar 11.42598 11.575
Wind 1.523464 1.543
Biomass 5.332124 5.401 Hydropower 2.285196 2.315
Tidal 1.713897 17.360
Geothermal 4.951258 5.015
[image:4.595.316.537.500.631.2]Fig. 3. CO2 and Ash reduction through REIP.
Fig. 4. SO2 and NOX reduction through REIP.
[image:4.595.88.249.544.681.2] [image:4.595.58.279.709.777.2]geothermal makes air and water pollution due to naturally occurring element in the water and steam. On the other hand, the geothermal energy is a reliable source that can run for 24 hours a day and its power plant is smaller than the most types specially the solar power plant. Thus, took into consideration the capability of both energies, geothermal and solar, for integrating, the geothermal alternative is the more suitable choice in industrial plants. Totally, it has been noted from the result that the wind energy is the more optimum choice for being integrated into the process industries. Tidal energy with the highest investment cost and payback period is not suitable option for REIP.
VI. CONCLUSION
Global warming and environmental aspects become of the more important concerns due to the distribution of pollutants as the result of fossil fuel consumption. Fossil fuel usage is a large contributor to the production of anthropogenic greenhouse gas (GHG) emissions. To reduce the effects of consuming the conventional types, renewable energies as the clean and sustainable sources need to be cooperated. For utilization of the potential of alternative technologies and firm and reliable power generation, they should be integrated into process industries. Although the efficiency of energy conservation from the primary sources to the useful forms is improving, the energy consumption is increasing simultaneously.
In this paper, a systematic method for Renewable Energy Integration into Process industries, REIP, in site utility systems has been developed. This computational method has been emphasized on the efficient use of energy through pinch technology concept with the objective of reducing the environmental effects considering the economical issues. To achieve the above aim, a mathematical model, Renewable Energy Model (REM), has been introduced. The REM accounts for different scenarios to be considered for integrating purpose. The amount of investment cost, payback period, energy saving and pollutant reduction have been accomplished via the REM. Also through a simultaneous consideration of investment cost and emission reduction, has been considered for selecting the optimum alternative to be integrated into the plant. To get the integration results, related coding in MATLAB 7.3 has been done.
The results on wind energy have been demonstrated the lowest investment cost of 1.523464 MM$ and the payback period of 1 years and 7 months with the energy saving of 5.132%. Integrating the wind energy has made the high emission reduction achievable, the CO2 reduction has been accomplished 4856.041 ton/yr, the SO2 reduction is 16.567 ton/yr, the NOx reduction is 14.853 ton/yr and the ash reduction is 314.217 ton/yr. To conclude, the wind energy is the most optimum choice for REIP. The computations have been illustrated that the hydropower and the geothermal sources are the appropriate alternatives after wind energy. Moreover, the results of integrating the tidal energy show that the, tidal energy integration is not competitive choice.
NOMENCLATURE
A Turbines number at same input steam level
CMM current and minimum load difference, t/h D Turbines number at same output steam level EmR emission reduction, kg
EmRRE emission reduction per each RE, kg/kW FT,Cur current throttle flow, t/h
FT, Min minimum throttle flow, t/h m throttle flow, kg/s
PS power saving, $
PT,Cur current generated power, MW
RE renewable energy
REC renewable energy cost, $/kW
REIP renewable energy integration into process OREIP optimum of REIP
SP saved power, kW StS steam saved, $
Wint intercept of the Willans line, kW
α turbines with the same input steam levels
β turbines with the same output steam levels
∆ Difference
Subscripts
B boiler C condenser D de-aerator
H HRSG, Heat Recovery Steam Generator in inlet
is isentropic
j number of steam levels k total number of turbines
P,in from process into system P, out from system into process V vent
REFERENCES
[1] A. Demirbas. (2005). Potential application of renewable energy sources, biomass combustion problem in boiler power systems and combustion related environmental issues. Progress in energy and combustion science. 31, pp.171-192. Available:
www.Sciencedirect.com
[2] S. Heier. Grid integration of wind energy conversion system. England: J. Wiley & Sons Ltd, 1998.
[3] M. Kanoglu, I. Dincer.(2007). Geothermal energy use in hydrogen liquefaction. International Journal of Hydrogen Energy. 32(17), pp.4250- 4257. Available: www.Sciencedirect.com
[4] J.W. Tester, E. M. Drake, M. J. Driscoll, M. W. Golay and W. A. Peters.(2006). Sustainable Energy-Choosing Among Options. Delhi: Prentice-Hall of India Private Limited.
[5] T. Mohan. (2005). An Integrated Approach for Techno-Economic and Environmental Analysis of Energy from Biomass and Fossil Fuels. MSc. Dissertation. Texas A&M University.
[6] G.T. Polley, M.H. Panjeh Shahi and M.P. Nunez.(1990). Pressure drop considerations in the retrofit of heat exchanger networks. Trans I Chem E. 68A.pp.211-220.
[7] G.T. Polley, M.H. Panjeh Shahi. (1991). Interfacing heat exchanger network synthesis and detailed heat exchanger design, Trans I Chem E. 69A.pp.445-457.
[8] R. Smith. (2005). Chemical Process Design and Integration. West Sussex: John Wiley & sons Ltd.
[9] G. Boyle, G. (2004). Renewable Energy Power for Sustainable Future. Oxford University Press.
[10] http://www.sedo.energy.wa.gov.au. Accessed on May 12, 2008.
[11] http://www.energy.ca.gov/distgen/economics/capital.html. . Accessed
on March 11, 2008.
[12] http://www.suna.org.ir. Accessed on May 12, 2008.