The
Economic
Research
and Social
Institute
IRISH INPUT-OUTPUT STRUCTURES, 1976
E. W. HENRY
THE ECONOMIC AND SOCIAL RESEARCH INSTITUTE COUNCIL 1979-198o
*T. K. WHITAKER, M.SC. (ECON.), D.ECON.SC., LL.D., President of the Institute. *J. F. MEENAN, M.A., B.L., Chairman of the Council.
R. D. C..BLACK, PH.D., Professor, Department of Economics, The Queen’s University, Belfast. F. B. CHUBB, M.A., D.PHIL., Professor, Department of Political Science, Trinity College,
Dub6n.
SEAN CROMIEN, B.A., Second Secretary, Department of Finance. G. DEAN, M.D., F.R.C.P., Director, Medico Social Research Board.
N. J. GIBSON, B.SC. (ECON.), PH.D., Professor, Department of Economics, The New
University of Ulster, Coleraine.
PATRICK A. HALL., B.E., M.S., DIP.STAT., Director of Research, Institute of Public
Administration.
*W. A. HONOHAN, M.A., F.I.A.
THE MOST REV. JAMES KAVANAGH, M.A., S.T.L., Bishop of Zerta.
*KIERAN A. KENNEDY, M.ECON.SC., B.PHIL., PH.D., Director of the Institute. IVOR KENNY, M.A., Director General, Irish Management Institute.
MICHAELJ. KILLEEN, B.A. (MOD.), B.COMM.,D.P.A., Managing Director, Industrial
Development Authority.
T. P. LINEHAN, B.E., B.SC., Director, Central Statistics Office.
*P. LYNCH, M.A., M.R.I.A., Professor of Political Economy, University College, Dublin. CHARLES McCARTHY, B.L., Chairman, Human Sciences Committee.
*EUGENE McCARTHY, M.SC. (ECON.) D.ECON.SC., Director, Federated Union of
Employers.
JOHN J. McKAY, B.SC., B.COMM., M.ECON.SC., D.P.A., Acting C.E.O. City of Dublin
Vocational Education Committee.
*C. H. MURRAY, LL.D., Governor, Central Bank. J.. C. NAGLE., M.COMM.
D. NEVIN, Assistant General Secretary, Irish Congress of!Trade Unions. THE MOST REV. J. NEWMAN, M.A., D.PH., Bishop of Limerick. TADHG 0 CEARBHAILL, Secretary, Department of Labour.
REV. E. F. O’DOHERTY, M.A., B.D., Ph.D., Professor, Department of Logic and Psychology,
University College, Dublin.
D. P. O’MAHONY, M.A., PH.D., B.L., Professor, Department of Economics, University
College, Cork.
LABHRAS 0 NUALLAIN, D.ECON.SC., Professor of Economics, University College,
Galway.
~W. J. L. RYAN, M.A., PH.D., Professor of Political Economy, Trinity College, Dublin. REV. L. RYAN, M.A., D.D., L.PH., Professor, St. Patrick’s College, Maynooth. T. WALSH, M.AGR.SC., PH.D., D.SC., MRIA, Director AnCOT.
~REV. C. K. WARD, B.A., S.T.L., PH.D., Professor, Department of Social Science, University
College, Dublin.
*NOEL’WHELAN, B.COMM., M.ECON.SC., PH.D., Secretary, Department of Economic
Planning and Development.
IRISH INPUT-OUTPUT STRUCTURES, 1976
Copies of this paper may be obtained from The Economic and Social Research Institute (Limited Company No. x8269). Registered Office."4 Burlington Road,
Dublin 4.
Price £4.50
IRISH INPUT-OUTPUT STRUCTURES, i976
E. W. HENRY
© THE ECONOMIC AND SOCIAL RESEARCH INSTITUTE DUBLIN, x98o
Acknowledgements
Although fully responsible for the content of the paper, the author wishes to thank R. O’Connor and R. N. Vaughan who acted as Institute readers and made valuable comments and suggestions on the draft report. He acknowledges helpful suggestions from R. C. Geary on the capital stock estimates and from K. A. Kennedy on the general content of the paper. Eric Embleton of the Central Statistics Office supplied an estimate of the 1976 value of farm machinery and buildings and his colleague Joe Madden provided unpublished national accounts’ detail. The Industrial Development Authority created the stimulus for the paper, which is development of a background input-output study the author made for the IDA during 1978.
The author sincerely thanks the referee, for diligently pointing out everything that was unsatisfactory and for urging him to consider marginal analysis. The considerably expanded Appendix 1 now contains a detailed account of how the 1976 transactions were compiled. The marginal analysis of Part 5, with explanatory Appendix 3, are also the author’s response to the referee’s demand for development of an appropriate marginal model.
CONTENTS
Page
_ Part 5
Acknowledgements
General Summary 9
Part 1 Purposeand Scope; the Input-Output Model Explained 13
Part ~ 1976 Transactions and Direct Input Coefficients 18
Part 3 Total 1976 Inputs per Unit Final Demand. ~o
Part 4 Primary Input Components of 1976 Final demand, with
Allocations of Labour and Capital ~3
A Tentative Marginal Analysis of Economic Growth between 1968 and 1976 at 1976 Prices by means ofa 17-Sector
Transactions Table ~ 6
Part 6 Input-OutputAnalysis of Economic Policy Issues 33
References 49
Appendix z Compilations of the 19-Sector Input-Output Transaction Table shown as Table 1, and Allocation of Employment
among Sectors 51
References giving Background to Appendix 1 64
Appendix 2 Sources of the Capital Stock Estimates shown inTable 1 64
Appendix 3 Preparation of an I-O Transactions Table showing the Change between Irish 1968 and 1976 Economic Structures, at 1976 Prices
Table
1
9
lO
11
12
LIST OF TABLES
Irish Input-Output Transactions for 1976. All Imports Shown in One Row
Direct Input Coefficients for Irish a 976 Transactions
(I-A) Inverse for Irish x976 Transactions; Primary Inputs Associated with Final Unit Demands of Table 1
Primary Input Components of Final Demand, for Irish 1976 Transactions
Percentage Distribution of PrimaryInput Components of x 976 Irish Final Demands
Irish a 7-Sector Marginal Transactions, 1968-x976, at 1976 Prices
(I-A) Inverse of Irish x 968 - 1976 Marginal Transactions, with Primary Inputs, Employment, Capital Stock, per Unit Final Demand
Primary Input Components of final demand, Irish x 968-1976 Marginal Transactions, at 1976 prices
Comparison of Irish 1976 Average Primary Input Percentage Shares of Final Demand with Those of Marginal Final Demand
x968-1976, at 1976 Prices
Estimated Economic Outcome in x976 of £1m of Exports of Food and of Metal via x976Unmodified Structures, at 1976Prices
Estimated Economic Outcome in 1981 of £1 m of Exports of Eood and of Metal at x976 Prices, via Modified 1976 I-O Structures (average only)
Estimated Economic Outcome in 1976 of Elm Spent on Construction and on Services at 1976 Prices
Page
41
4~
43
44
44
45
46
47
48
36
37
APPENDIX TABLES
Table
Ae. 1 Projection of Capital Stock of Irish Manufacturing to 1976 65
A~.~ Projection of Capital Stock of Four Irish non-manufacturing
Sectors to 1976 66
A~.3 UK/Ireland 1976 Ratios for Gross Output per Man-Year and
Capital Stock per Man-Year 67
A3.1 Irish 1968 17-Sector Transactions Matching those of 1976 75
A3.~ Inflators for the 1968 Irish.Primary Inputs 76
A3.3 Irish 1968 17-Sector Primary Inputs and Total Outputs repriced at 1976 prices, with Employment and Capital Stock
at 1976 Intensities 77
A3.4 Irish 1968 17-Sector Transactions at 1976 Prices; with Wages, Profits, Employment, Capital Stock, all in average 1976
General Summary
J
I
NPUT-OUTPUT techniques, as used in economic science, have various uses, including the comparison of the national economic product of one industry, or service, with that of another. An input-output model breaks down economic activity by type or sector (such as food manufacturing), and shows how each sector buys goods and services from other sectors and sells its outputs to them. Parts of the cost of production for each sector are the purchase of labour, the rent of capital, the purchase of imports, the taxes to government and thedepreciation of capital stock.
Five main aspects of the present report follow below, under their respective headings.
(x) Update of Irish Input-Output Published Tables and Analyses to 1976
Tile Central Statistics Office has published detailed input-output (I-O) r, esults for 1964 and 1969. This writer has published less detailed related studies for 1968 and 1974. The present report describes a 19-sector 1976 model, derived from Table 1.
The combined "direct and indirect" economic results associated with so-called "final demands" are a major result of an input-output model of" the type considered in this report. A final demand here means, for example, a demand for exports of the output of the food sector, or capital formation consisting of output of the construction sector. The direct and indirect economic results associated with 1976 final demands are shown in Table 3.
Table 3 tells us that £1 m. of 1976 food exports is associated (directly and indirectly) with £~59 thousand of imports, £e 7 e thousand of wages and salaries, £466 thousand of gross profits. The direct effects alone are shown in Table ~, where we find that £1 million of food exports is directly associated with £86 thousand of imports, £111 thousand of wages and salaries, £51 thousand of gross profits (i.e., profits plus depreciation). The fuller information conveyed by the "direct and indirect" result is apparent.
10 THE ECONOMIC AND SOCIAL RESEARCH INSTITUTE
wages plus profits, whereas the construction capital formation is associated with £687 thousand of wages and profits..The food sector also shows smaller imports associated with it, this is again better. By "better" we mean connected with larger national income or smaller cost of imports.
(~) Employrment and Gross Capital Stock Related to Economic Activity
As an extra dimension to the I-O reports and models referred to above previously published by CSO and the writer, the present 1976 model has introduced employment and gross capital stock into the system. The "emploYment" row of Table i shows how the total 1976 employment of 1 o3b thousand man--years is (tistributed to 16 sectors. The "gross capital stock" row
of Table i shows the distribution, of some £11 ooo m. of capital stock, the estimated gross amount in the Irish sectors valued at 1976 prices. This~’’gross’’
stock is the estimated new equivalent amount in the system, beJore being
depreciated, i.e., the replacement cost new at 1976 prices.
We can look at the "direct and indirect" employment (and capital stock) results in Table 3 in exactly the same way as already done for the imports etc. But aggregate results, given in Table4, are of additional interest. Table 4 tells us that, of the total employment of 1 o35 thousand man-years for 1976, 411 thousand relate to personal consumption, 318 thousand to exports, 195 thousand to net government current expenditure and i o5 thousand to gross fixed capital formation. These are all "direct affd indirect" results.
Table 4 shows that the "direct and indirect" result for one finai demand does not overlap or duplicate that of another final demand. The entries in each row add up to the correct Table I row totals. This non-duplication property also ho!ds for the more detailed "direct and indirect" coefficients of Table
3-The capital stock row of Table 4 shows that, directly and indirectly, total 1976 personal consumption was associated with £4.6 billion of the equivalent new gross capital stock, exports were -related to £3.4 billion, net government current expenditure £~.~ billion and gross fixed capital formation £o.8 billion (a thousand million being a billion).
(3) What Economic Growth Between i968 and 1976 Means in i976 Units
IRISH INPUT--OUTPUT STRUCTURES, 1976 11
wages, profits, all have been put into the marginal model at 1976 intensities or proportions, within each sector. This marginal model gives comparison with tile "average" model of 1976 based on Table 1.
Perhaps the most interesting results of the marginal model appear in Table 8; let us consider employment. The growth of output during 1969-1976 has
~37 ooo standardised man-years associated with it, at average 1976 sectoral productivity levels, Of the total ~37 ooo man-years,exports are accredited
lO4 ooo, net government current expenditure 75 ooo, capital formation e6 ooo and personal consumpt.ion 33 ooo.
The meaning of these standardised employment figures needs careful interpretation. Of the total lO35 ooo man-years of employm~ent during 1976 shown in Table 1, some ~ 37 ooo can be allocated to the growth of the economy during 1969-1976. By implication 1968 output could have been produced by 798 ooo man-years (the 1976 total lO35 ooo less ~37 ooo) at 1976 levels of productivity. But 1968 output had in fact lO63 ooo man-years of employment associated with it, at 1968 productivity levels. The need to distinguish carefully between "standardised man-years" as used by the present I-O model and "numbers at work" as published in a time series of official statistics, will be apparent. Some comments on the necessary distinction between these two employment measures appear in Part 5 of the paper.*
The marginal coefficients of Table 7 can be used like those of Table 3; not all of them, unfortunately, are equally trustworthy, as will appear below in Part 5 of this general summary.
(4) How to use the Tabular Results
The marginal sectors considered most reliable, being based on the largest values in Table 6, are the following: (1) food, (9) other manufactures, (1o) agriculture, (13) construction, (16) trade and services, (17) artificial sectors.
As an illustration of how the marginal figures can be used, let us compare results of£ 1 m. worth of food exports with £ 1,m. worth of other manufactures. From Table 7 "direct and indirect" coefficients we find the following set of comparisons, in £ thousand per £1m. final demand:
Food Other manu-Jactures
Imports e3~ ~56
Wages ~ 51 3 ~ 1
Profits 375 31 o
Employment (man-years) 17 ~ lO
Capital stock 1 634 ~ o84
12 ¯ THE ECONOM~[C AND SOCIAL RESEARCH INSTITUTE
This is-a good example of less than complete scoring of one sector over another: In terms of lower imports and capital stock required, the foodexport is slightly better. In terms of employment the food export is far better, having 17 ~ man-years (of which lO4 are in agriculture) compared with lO ~ in the other manufactures export. Much of the "profits" entry under food is farmers’ income, so let us compare wages plus profits; food 6~6, other manufactures 631. The wages plus profits per man-year is£3 64o for food and £6 186 for other manufactures.
Thus other manufactures yield higher wages plus profits per man-year, and per £1 m. of exports. One may conclude that the choice of one sector (of the two being compared) as the better depends on which aspect or economic result one considers important. Admittedly, the food sector wins on three scores out of four.
(5) Data Limitations, and Reservations about Results
The 1976 average results given in Tables 1 to 5 are essentially derived from 1969 and 1973 sector costings, inflated to 1976 price-levels. A 1976 Census of Industrial Production was not available, to give exact and detailed output products and input costs: This is the greatest singleflaw of the 1976 results. The marginal table is inaccurate to the extent that the 1976 Table 1 is inaccurate and
Part x
Purpose and Scope; the Input-Output Model Explained
A
N input-output (I-O) study of the Irish economy for the year 1976 is the latest in the series of published results which covered 1964, 1968, 1969 and 1974 (CSO, 197o, 1978, Henry, 197~a, and 1977). Some explanation of the purpose and scope of the following essay is required. Readers should note that only a minimum of explanatory text is given with the tables; it is assumed either that readers already have some familiarity with I-O analysis or that novices might seek basic elucidation in O’Connor and Henry (1975) or elsewhere. There is also a summary description of the I-O system of analysis given below under the heading "the I-O model explained".Purpose
Tile general purpose of providing further usable I-O analysis of the Irish economy can be set down under five heads:
(i) to update 1964 and 1968, 3s-sector results with less emphasis on energy-producing and converting sectors.that applied to the 1974 study (Henry,
1977);
(ii) to add an employment dimension to the earlier published analyses, which mostly dealt with values only, except for the full-employment experiments relating to 1975;
(iii) to use recent capital stock information, including UK industrial data, to estimate the capital per manzyear for 1976, for individual sectors and for final demand aggregates;
(iv) to perform a marginal I-O analysis of Irish economic growth from 1968
to 1976.
(v) To illustrate how these or similar results can aid economic policy analysis.
Scope
This report gives: (a) a brief description of a 19-sector 19 7 6 transactions table at producer prices; (b) the Leontief inverse of that table with primary input amounts-associated with unit final demand; (c) primary input components of
14 THE ECONOMIC AND SOCIAL RESEARCH INSTITUTE
final demand; (d) comparison of average and marginal coefficients; (e) examples of application to policy analysis. Both employment and capital stock are treated by the x976 analysis as further primary inputs, and their absorption by 1976 final demands is an aspect of the Irish economy not analysed by previous studies of I-O transactions and models.
The Keynesian-type multiplier analysis first developed by Copeland and Henry (1975) for 1968 and updated to a974 (Henry 1977) for a model of 19 sectors is not performed by the present study. It has been decided that in view of
1974 multipliers of this kind being available, a more interesting set of results would be furnished by employment and capital "partial" multipliers corresponding to the direct plus indirect amounts of the usual primary inputs per unit final demand. Some background to the employment and capital estimates is given in two appendices to the main text.
The ’Inptit-Output Model Explained
Input-Output techniques, as used in economic science, have various uses including the calculation of multipliers, to be described below. An input-output model breaks down economic activity by type or sector, (such as food manufacturing), and shows how each sector buys goods and services from other sectors and sells its outputs to them. Parts of the cost of production for each sector are the purchase of labour, the rent of capital, the purchase of imports, the taxes to government and the depreciation of c~pital stock, The national economy is made up of a large number of different, but interdependent, activities and can only be adequately described by a model which incorporates the National Accounts’ variables at a disaggregated level. Such a disaggregated description of the economy is provided by the input-output (I-O) system, which shows-the flows of goods and service in money units for a given time period between the major sectors of the economy. The latter sectors, which can vary in number depending on the level of aggregation, constitute groupings of similar economic activities. In this paper we shall be referring to the Irish~I-O model for 1976 which contains a total of~4 sectors, of which the first 19 refer to groupings of similar industries or services and the remaining five are the sectors of final demand, namely, personal consumption, net government current expenditure, increases in stocks, fixed capital formation and exports.
We now consider how this accounting or distributive model of the system operates. The complicated interacting system of buying and selling goods and services within and between sectors ultimately provides goods and services for households, government, capital investment and exports, as the final outcome.
These final uses (or final demands) in pounds sterling (£) are treated by our model as directly and indirectly accounting for all economic activity. A
IRISH INPUT--OUTPUT STRUCTURES, 1976 15
food manufactures) has, associated with it, calculated amounts of the outputs of industries and services, payments to labour and capital, tax revenues to government, demand for imports. The ratio of any of these associated amounts to the specified final demand is a multiplier. Thus a single demand has various multipliers, such as the wages and salaries generated by £a of exports of food manufacturers, the cost of agricultural livestock required by £ 1 of such exports, and so on. How the model estimates the calculated amounts associated with detailed final demand will now be considered.
The input-output system breaks the economy up into sectors and shows the transactions betweeri the contributions of each sector for a year. It can be thought of as a system of disaggregated National Accounts. In general, if" an
economy contains n producing sectors, then for any sector i its gross output (xi) will be made up of: (a) i~ntermediate product, which is used for further production in the economy; and (b) final product (Yi) which goes to final
demand. Typically I-O transactions are expressed in money units. If xij
represents the sales of sector i to sector j, then row i in a 3-sector transactions table
with three producing sectors can be described by the equation:
(xij + xi~, + xi3) + Yi = xi ( 1.1 )
which means that intermediate product + final product = gross output of sector i. There are three of these rows so we have the following transaction flows:
21 + X22 + X2~I + Y2 = X2 !
31 + X32 + XS3/
Row sums of Vector Vector
inter-industry of of
transactions final sector
matrix demands outputs
(1.2)
It can easily be seen that, while x/j represents the sales of output by i to j, it also represents the purchases of output from i by j. Thus column j of the transactions matrix represents the inputs to sectorj. The total inputs to a sector are the sum of the intermediate inputs xij (i = I to n) and primary inputs, i.e., the payments to labour, capital and imports. The total inputs to any sector i equal its gross output xi.
In I-O, each unit of sectoral output (xi) is assumed to be produced from a fixed (average) pattern of inputs. The value of output is distributed over inputs so that it equals the sum of the values of inputs. Technical coefficients for any
16 THE ECONOMIC AND SOCIAL RESEARCH INSTITUTE
columnj b~, the¯ total input xj.’. The matrix of technical coefficients or matrix A with the typical element aij is as follows:
¯
/all a,2 aisN~ /xli/x, ..~,,/x2 xl~/x3~
We can thus rewrite, the transactions flows as follows:
(a
all ~l’ alS~ ~xi)a21 a22 a23 ~ x2 $1 as2 as3/
In matrix notauon:
Ax +y=x
Therefore
y = x--Ax = Ix--Ax
= (I-- A)x
Thus
x=(I--A)-’y
The matrix (I -- A)-~, called the (I-A) inverse matrix or
X2
(a.4)
(1.5)
(1.6)
(1.7)
matrix of interdependence coefficients, relates gross output to final demand for each sector. Since final demand is assumed exogenous and output is endogenous in I-O, the equation (1.7) is a reduced-form equation.
Let a typical element in the (I-A)-t be b0"; then in the 3 x 3 framework we have:
(Xll /bll bl2 blSy ~i) /bllyl -I- bl2"y2 + blsy3 N~,X2 =~21 b22 b2q 72 m?21Yl + bray,+ b,,y,) g, k@31 b3~ bss/ ~k~Slyl + bs2 Y2 + !3sY31 (1.8)
This system says that one unit of final demand for the output ofsectorj requires
b Ij units of output from sector 1, by units output from sector ~, etc. The output required by one unit of final demand is referred to as the "direct plus indirect output associated with unit final demand". But each unit of output of any
sector i relates to a given amount zi of primary inputs. Thus one Unit of final
demand for the output of sectorj directly and indirectly relates to (b~ zl + by z2 + baiza) units of primary inputs (i.e.,columnj of the (I-A)-1 premultiplied by the row of technical coefficients for primary inputs). Primary inputs are the factors
IRISH INPUT--OUTPUT STRUCTURES, 1976 17 Since I-O tables are usually based on gross profits and valued at market prices, value added includes depreciation and net indirect taxes as well as factor incomes. It is, therefore, evident that by using the (I-A)-1 matrix of interdependence and the technical coefficients zi, we can derive direct plus indirect amounts of primary inputs associated with a £ unit of final demaild for the output of each sector, that is the sectoral multipliers for primary inputs, defined in a way suitable to our model.
We can treat imports as if they were a true primary input cost. It is important to note that sectoral multipliers, which relate changes in exogenous expen-diture to the consequent changes in wages, profits, etc., can be derived only from an I-O model which has all imports removed from the inter-industry transactions and treated as primary inputs. The inclusion of some imports in the trallsactions matrix would lead to an overestimate of the sectoral multipliers, since some of the direct and indirect output effects thus obtained would be due to the import transactions, which produce no reactions from
domestic sectors.
Part
I976 Transactions and Direct Input Coefficients
Irish z976 Transactions (Table ~ )
T
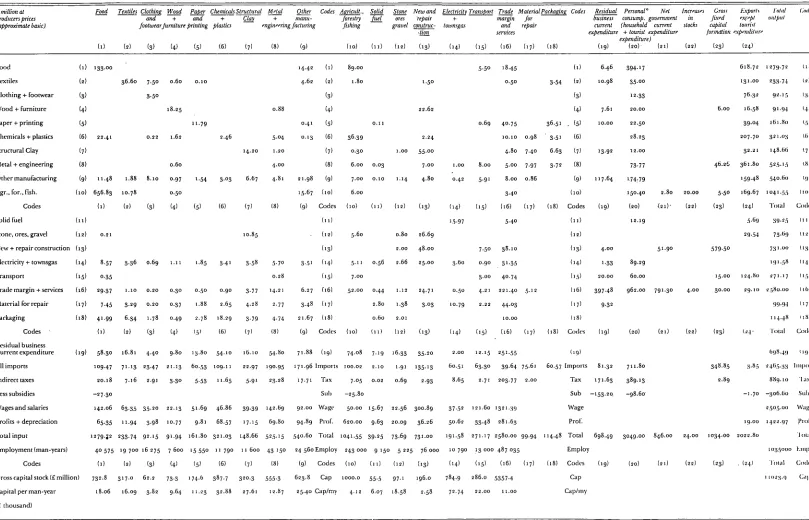
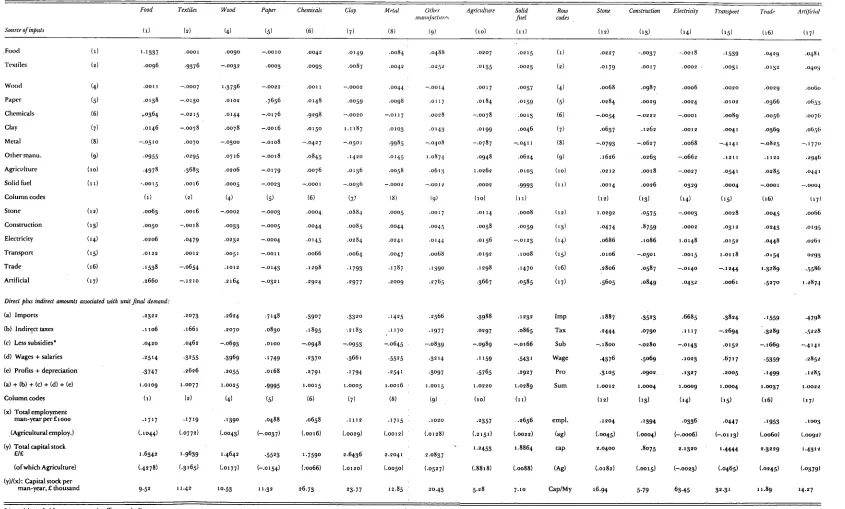
HE 19-sector 1976 transactions are shown in Table 1, (p. 41) with direct input coefficients appearing as Table ~. Table x corresponds to the 1964 and 1968 33-sector transactions (Henry, 197~b) compressed into 19 sectors. Table 1 has all detail of government current purchases included in column (16), trade margin and services. Appendix 1 gives the background to Table 1. In this table there are 19 inter-industry sectors, of which nine are sub-divisions ot manufacturing, in accordance with IDA interests. Sectors (17) to (19) are artificial. All imports are shown as a single row. There are four further primary inputs rows and rows for employment and ca_pital stock. Readers might note that all 1 o35 ooo man-years are allocated to sectors (1) to (16); the artificial sectors (17) to (19) not having any direct employment. All current purchases occasioned by government net current expenditure are detailed in column (16), in so far as the available data permit; and.the 64 ooo man-years of" public administration and defence are included among the 487 ooo man-years allocated to column (16).The final demand columns, numbered (~o) to (~4) are relatively aggregate. The column (~o) array of personal expenditure includes tourist expenditure, valued at £137 m., and denoted "expenditure by non-residents" in the National Accounts. Net government current expenditure, value £846 m. shows one aggregate Single purchase of’£791 m. from "trade margin and services"; this purchase includes all expenses of government services generally, including health and educatio, n.
Column (~), increases in stocks, has only two entries, of’which the £~o m. is the value of increases in livestock on farms. With better information, this column would have more entries. Gross fixed capital formation, column (~3), mostly c.omprises two large entries: £58o m. of construction and £349 m. ot imported capital goods. Column (~4) shows exports of goods and services, and includes as "profits" £19 m. of net factor income from abroad.
Capital stock, divided by man-years, gives the capital per man-year ratios forming the last row of Table 1. At £73 ooo per man-year, electricity far exceeds all others. Relatively high values, in the range £~5 ooo -- £33 ooo per
IRISH INPUT--OUTPUT STRUCTURES, 1976 19 year, appear for (9) other manufhcturing (including drink, oil retinery etc.), (7) structural clay and cement, (6) chemicals and plastics. The figure o1£11 ooo per man-year, for (16) trade margin and services, was chosen by considering United Kingdom levels for these services; this is explained in Appendix 2.
Direct Input Coefficients (Table 2)
Tile direct input coefficients fbr 1976 appearing in Table ~ (p, 42) are derived from Table 1 by dividing entries in each column by the total input value o[ the column for columns (1) to (19). Total input has the same value as gross output. Subject to rounding errors, the figures in each column of Table ~ above the total input row add to unity. These direct input coefficients give the costs per £1 of output; for example, £1 worth ot’output of the 1976 Food industry requires
£o.5133 worth of Irish agricultural produce.
The employment and capital stock direct coefficients are analogous to those of" direct input costs. Four labour-intensive sectors are: (3) clothing; (16) trade margin and services; (lO) agriculture; (I 1) solid fhel (including tarmers’ peat); these sectors have o.t8 to o.23 man-years per £1 ooo output. The three most capital-intensive sectors are electricity 4.1 ; structural clay 2.~ ; trade margin and services 2.1; the capital coefficients being capital stock in £ per £ o[" output o[
Part 3
Total I9 76 Inputs per Unit Final Demand
T
HE (I-A) inverse for Table 1 appears in Table 3 with direct and indirect primary input and employment and capital stock associated with final demand.Sector Outputs
Rows (1) to (19) of each column of Table 3 indicate how much sector output is associated with £x of final demand for the outputof the sector whose name heads the column. For example, column (1), food, has 1.1781 in row (1) and
o.6o98 in row (lO); these numbers mean that £1 of final demand for manufactured food in 1976 is associated, on average, with £1.1781 worth of manufactured food altogether, and £o.6o98 worth of produce from agriculture etc., altogether (i.e., directly and indirectly). This example illustrates how Table
3 can be used as a ready reckoner with one or more values of final demand.
Imports
The import coefficients shown as row (a) of Table 3 havd the same meaning as those of the sector outputs. For example, £1 worth of final demand for food manufactures is associated with £o.u594 worth of imports. The four most import-intensive sectors in £ import per £ final demand are (17) materials for repair at o.8u57, (18) packaging at o.7358, (5) paper and printing at o.464u and
(6) chemicals and plastics at o.4497. The least import-intensive, having only 0.0971 £ import per £ final demand is (16) trade margin and services.
Wages and Salaries
IRISH INPUT--OUTPUT STRUCTURES, 1976 21
Gross Profits
The gross profits (i.e., profits plus depreciation) coefficients appear as row (e) of Table 3. The two largest are 0.673~ for (lO) agriculture and 0.4661 for (1) food, the latter being largely due to the indirect effect of the agricultural input to food manufacturing. The apparently large profit in agriculture is due to the fact that most farmers are self-employed, with income therefore classified as profit rather than wagesand salaries, for inclusion in the National Accounts.
Employment
Tile employment rows of Table 3 are expressed in man-years per £ 1 ooo of final demand. The first row shows total employment and the following row, in parentheses, shows the sector (lO) (agriculture) content of the total employment.
According to the total employment row, the sector of the highest employment content is (lO) agriculture, having ~ 8 ~ man-years per £ m. of final demand. The four next highest are (11) solid fuel at ~71, (16) trade margin and services at ~36, (1) food at ~17 and (3) clothing and footwear at ~14. The four sectors of minimum employment content are (17) materials for repairs at 3~, (18) packaging at 37, (6) chemicals and plastics at 71 and (15) transport at 75. Many objections can be raised against including agricultural employment on tile same basis as employment in all other sectors. Many of the people classified as farmers are either men over 65 years of age or young, men drawing social assistance payments. The Table (3) employment row in parentheses shows how sector (lO) agricultural employment is distributed; the only two large entries are ~8~ (man-years per £ m. final demand) in sector (lO) itself and 14~ in (1) food. Excluding employment in agriculture, the three sectors of highest employment content (per £ m. of final demand) are (11) solid fuel at ~7o, (16) trade margin and services at ~33 and (3) clothing and footwear at ~ 11. Sector (16) is by far the most important of the latter three sectors.
Capital Stock
We will consider briefly the estimates of the gross capital stock associated with unit ~:o.al demand. It comes as no surprise that the capital coefficient for electricity, at £4.4o91 per £ 1 final demand for electricity, far exceeds that of any other sector. The two next highest coefficients are for (7) structural clay at
THE ECONOMIC AND SOCIAL RESEARCH INSTITUTE
Capital Stock per Man-year
This ratio is expressed in £ thousand per man-year and because it derives from direct and indirect amounts (associated with unit final demand) ot both capit~il stock and employment, it is a more adequate measure or parameter than the direct ratio shown in the last row of Table x.
Part 4
Primary Input Components ofi976 Final Demand, with Allocations oJ Labour and Capital
I
N the National Accounts, gross national product (GNP) expenditure in aggregate equals GNP by sector of origin. To both sides of this equation add imports. We now have, in input-output systems, that final demand in aggregate (household and government consumption, plus capital tormation, plus exports) necessarily equals GNP by sector of" origin, plus imports (the usual primary input rows, with imports).By means of the coefficients of Table 3, in conjunction with the final demand columns of Table 1, it is possible to carry this equality o1" final demand with primary input a stage further and to completely account for final demand in terms of primary inputs (including imports). This analysis is explained in O’Connor and Henry (1975), and in other textbooks. We now look at 1976 results derived from Table 1.
Primary Input Components of i976 Final Demand
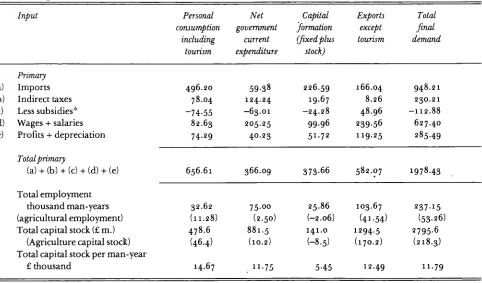
Table 4 shows the primary input and employment and capital content o| Total Final Demand, and of the five columns of final demand shown in Table 1. We can see that components (a) to (e) add to the correct total of’each column; this result should emerge naturally, subject to rounding errors, from correct computation of the (I-A) inverse and derived input coefficients of Table 3, and correct treatment of the calculation. We see that personal consumption has the biggest share of rows (a) to (d) and accounts for about 4o per cent of total employment and of total capital stock. The capital stock of agriculture is almost completely required by personal expenditure and export demand.
Personal Consumption Expenditure
We now consider briefly some features of the main components of" Table 4, starting with the first column, personal consumption expenditure, which includes £137 m. of expenditure by non-residents. Personal consumption provided during 1976 almost £94om. of payments of’wages and salaries, and almost £55o m. of profits and depreciation, directly and indirectly. It absorbed almost £1 15o m. of imports. It supported about 41o o0o man-years oi employment, of which 98 ooo were in agriculture etc. It related to about £4 6oom. of gross capital stock. The capital stock per man-year was £11 3oo, which is slightly above the national average value of £1o 65o, for total tlnal
THE ECONOMIC AND SOCIAL RESEARCH INSTITUTE
The pfframount importance of personal consumption, as a support and stimulus to economic activity in 1976, is clearly shown by Table 4.
Tourist Expenditure
Expenditure by non-residents, i.e., tourist expenditure, was estimated to be £ 137 m. in aggregate during 1976. The following ten components show tourist expenditure, as broken down by the writer to accord reasonably with personal expenditure, after omission of consumer durables etc. :~
(Figures in £ m.):
Food (x) ~3.8 Transport (15) 3.6
Textiles (~) ~. 1 Trade margin (16) 58.o
Paper (5) 1.4 Imports 1 o.9
Other manufacture (9) lO.6 Indirect taxes ~3.5
Agriculture (lO) 9..1 Less subsidies -6.o
It should be noted that these figures are rough estimates; more exact details are not available. Application of Table 3 coefficients, as appropriate, to the first seven components of tourist expenditure yielded estimates of ~ 4 ooo man-years of employment during 1976 and a fairly average capital intensity per man-year, about £1 x ooo.
Net Government Current Expenditure
We see from the second column of Table 4 that net government current expenditure provided 195 ooo man-years in 1976, that is 131 oo0 indirectly, in addition to the 64 ooo given directly by public administration and’defence. We also see that the capital intensity, at £11 3oo per man-year, is above the national average £ao 65o. We see too that this final demand provided directly and indirectly £543 m. of wages and salaries, ~ per cent of the total t~ 5oo m.
,Gross Fixed Capital Formation
Gross fixed capital formation during 1976 accounted for about £38o million of wages and salaries and almost 1 o5 thousand man-years of employment. The capital stock per man-year, at about £7 7oo, is below average. It therefore appears that gross fixed capital formation is, or can be, a good employment sdmulus at relatively cheap capital investment cost per job created or supported.
Exports, other than Tourist Expenditure
IRISH INPUT--OUTPUT STRUCTURES, 1976 25 are, for both wages etc., and gross profits, in that they accounted for well over £6oom. of both in 1976. Almost 3~o ooo man-years of employment were accounted for through these exports; this consists of 183 OOO man-years of non-agricultural employment and 135 00o man-years of agi-icuhural employment. The capital cost per job was about average, at £1o 6oo.
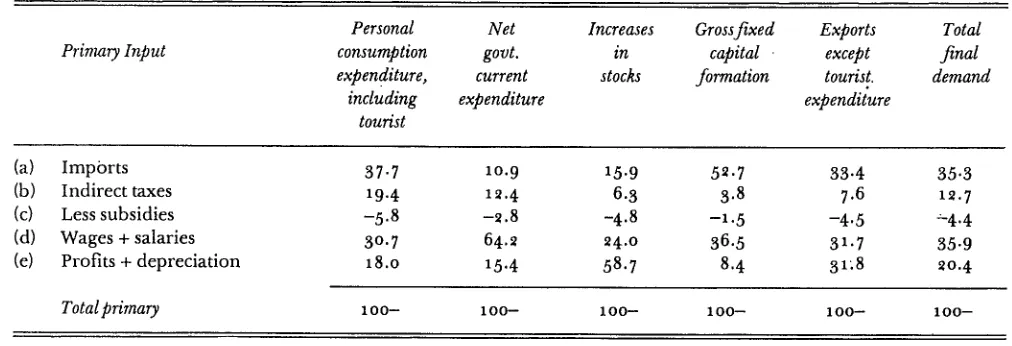
Percentage Distribution of i976 Primary Input Components
Rows (a) to (e) of Table 4 expressed as percentage of column totals are given in Table 5. The first impression given by Table 5 is that, along each row, wide variability occurs in the’ component of various final demands allocated to a given primary input such as imports. The imports take 35 per cent of total final demand; but they take 53 per cent of fixed capital formation, 38 per cent of personal consumption, 33 per cent of exports, and only 11 per cent of net government current expenditure.
Indirect taxes are about 13 per cent of total final demand; they form 19 per cent of personal consumption, 1 ~ per cent of government current expenditure and 8 per cent of exports.
Wages and salaries, at about the same share as imports, take 36 per cent of total final demand. They take 64 per cent of government current expenditure,
37 per cent of total gross fixed capital formation, 3~ per cent of exports and 31 per cent of personal consumption.
Profits and depreciation form ~o per cent of total final demand, 3~ per cent of exports, 18 per cent of household consumption, 15 per cent of government current expenditure and 8 per cent of gross fixed capital formation.
Part 5
A Tentative Marginal Analysis of Economic Growth between i968 and 1976 at 1976 Prices, by Means of a ~7-Sector Transactions Table
T
HIS part of the paper presents a tentative marginal analysis of Irish economic growth between 1968 and 1976, in the form of a table of I-O transactions at 1976 prices. Appendix 3 describes in detail how the marginal I-O transactions were obtained; essentially a x968 I-O table was re-priced at 1976 prices and subtracted from Table 1 above, to give the table of residuals (tile marginal table)which is Table 6. Tables 7, 8 and 9 pertorrn the usual (I-A) inverse analysis of Table 6, primary input shares of final demand and comparison with the 1976 average shares given as percentages in Table 5 above. Tile closest relevant work quoted as reference is that of Middelhoek ( 197 ~), Who used Netherlands I-O results to get marginal coefficients.Advantages of Having a Marginal Analysis
If information is sufficient to permit I-O modelling (or other econometric modelling) of economic growth over a period such as 1968-1976, such a model has more relevance to growth analysis than a model describing average structures and flows of goods and services during one particular year. If we assume unchanged marginal structures and I-O proportions, then the marginal model is the better one; indeed it can be argued that a model oi average annual proportions is not relevant for growth analysis.
Two particular objectives of Tables 6 to 9 are put forward:
(x) Comparison with 1976 parameters and results given in Tables 1, 3, 4 and
5.
IRISH INPUT--OUTPUT STRUCTURES, 1976 27 Table 1. The marginal table, theretore, is necessarily in 1976 units and will give results fully consistent with 1976 averages.
The Tentative Nature of the Irish Marginal Table
Marginal final demand analysis, using a 1968 standard inter-industry matrix, was background work to the Copeland and Henry paper (1975). The results were not published as they differed only slightly t)om average 1968 results. Over a four-year time-span and with relatively little inflation, the situation was a contrast to that of x968-1976.
A relevant study of marginal changes is that of St~iglin and Wessels (1973) who analysed the change in West German economic structures between 1954 and 1962, at 1963 prices. A note on their work appears in Appendix 3. Time series analysis of marginal inter-industry coefficients is another approach; a good paper on this is by Middelhoek (197~), who used Netherlands data tor the fifteen years 195o-1964 with regression analysis to estimate such coeflicients, nearest to those derived from Table 6.
The Irish data do not permit analyses of" the kind mentioned above, not being plentiful enough or precise enough, for reasdns given in Appendix 3. Yet the 1968 data and price inflators and the resulting marginal Table 6 are extra iMbrmation and therefbre at least give some comparisons with Table 1 data. The macro-results should be precise enough to bear comparison with 1976 corresponding results, e.g., the primary input contents of final demands. The finer detail is less reliable. This is mainly because the price inflators tor the rows are not sensitive enough to precisely cover small changes in structure. Let us regard Tables 6 to 9 as a first start at Irish marginal analysis.
The Marginal Transactions, Employment and Capital Stock
Table 6 shows marginal transactions for 17 sectors and 4 final dem.ands. There are 5 primary input rows and the employment and capital stock rows also. The three artificial sectors are combined into a single sector. All transactions are at 1976 prices. The employment and capital stock are at 1976 average intensities, in relation to GDP at factor cost. The latter is split between wages and profits, within each sector, in the 1976 ratio pertaining to Table 1.
The general picture shows a growth of£1 953 m. of final demand, at 1976 l)rices. After deduction of £935 m. of imports, the 8-year growth of GNP is £1 o18 m., about 33 per cent of the 1976 level.
The growth of output during 1969-1976 has 237 ooo standardised man-years associated with it, at average 1976 sectoral productivity levels. Of these
THE ECONOMIC AND SOCIAL RESEARCH INSTITUTE’
The meaning of these standardised employment fimares needs careful interpretation. Of the total xo35 ooo man-years of employment during 1976 shown in.Tablex, some ~ 37 ooo can be allocated to the growth of the economy
during x969-x976, at the level of detail shown in Table 6. By implication, 1968 output could have been produced by 798 ooo man-years (the x976 total
xo35 ooo less ~37 ooo), standardised at x976 levels of productivity. But 1968 output had in fact xo63 ooo actual man-years of employment associated with it, at 1968 productivity levels.
Three comments emerge from the above discussion;
(i) In analysing employment time series, it is useful to standardise the unit; the x976 man-years is the unit used consistently in the present paper:
(ii)The "number at work" or "number of jobs" as officially published each year for a period of years will generally differ from the the measures of employment obtained by the kind of I-O model being discussed; the official figures of employment are not usually
standardised in the way explained in Appendix 3.
(iii)Any positive I-O marginal output will have positive marginal employment associated with it, and vice versa; this arises from the linear nature of the present model and the standardised man-year of employment.
The capital stock total is £~ 795 m. there is little point in spelling out the row of figures.
In terms of 1976 levels of activity and man-years, therefore, the growth from 1968 is quite large. Its major features are available from Table 6.
Two Unsatisfactory Sectors
The clothing sector is one sector which is unsatisfactory. Column (3) inputs and entries show only some 7o man-years with a negative total input of-£ 13 m. Lack of precision of pricing combined with genuine small change in GDP (and
thus employment and capital) make the set of entries in this column and row unreliable. Row and column (3) have been omitted from the (I-A) inverse calculations, to be described below.
IRISH INPUT--OUTPUT STRUCTURES, 1976 ~9
The solid fuel sector has a special data problem, because it includes farmers’ peat, which has little information about input costs. Production of farmers’ peat has become intensely mechanised, between 1968 and 1976, making for further possible data problems. At less than 1 per cent of total employment, the
sector, although unsatisfactory, is of negligible overall significance.
Criteria for Satisfactory Sectors in Table 6
A few fairly obvious rules are suggested:
(i)Gross output big changes, say £5o m. or more, are likely to have more reliable (less tentative) input and output distributions.
(ii)The GDP (with derived employment and capital stock) should have the same sign as the gross output. There is something badly wrong with one or the other, if they differ in sign.
(iii)The entries in a column should generally have the same sign as total input, and GDP. This is more important for large entries than for small entries.
We see that in Table 6--sectors (3) and (11) have both violated rule (ii).
Conflict in Pricing and Between Gross and Net Outputs
To get a really sound equivMent of Table 6 and to discuss and research the modelling background would, in itself, make a large research project. Here in the present report is perhaps the best place to summarise two inherent difficulties underlying the re-pricing of a tablesuch as the 1968 Table A 3.1. These difficulties make for data problems with marginal tables such as Table 6.
(i) There are at least two ways of re-pricing the 1968 table. The first approach, used with A3.1 to give A3.4 is to specify the aggregate change in primary inputs An’ and use this to calculate Ap’ where
Ap’ = A n’ [I-A]"1 (5.1)
To the extent that some of the price inflators of primary inputs are inaccurate, giving faulty elements ofA n’, the re-priced sector output(s) will be inaccurate. The second approach to pricing is essentially the well-known Geary-Fabricant formula used for volume index work; this is the inverse of (5. I). One specifies sector price changes A p’ and calculates A n’
as
A n’ = Ap’ [I-A] (5.~)
3O THE ECONOMIC AND SOCIAL RESEARCH INSTITUTE
regards as a surplus, thus emerges as the re-priced profits row. But this does violence to the profits estimates obtained by applying a price inflator (specified) to the original profits row. In summary, we can see that good sector price control can mean bad GDP estimates, and vice versa.
(if)Total input (gross output) after re-pricing will not be in original proportion to net output, heremeaning GDP by sector of origin (salaries plus profits plus depreciation). No matter which way we re-price the system, this is true. Thus when we subtract re-priced x968 transactions from those of 1976, in extreme cases we get a positive gross output combined with a negative net output, or vice versa. This is unlikely to
happen if the margin is large. If one applies the a976 employment and capital intensities to the i968 re-priced GDP estimates (the most essential part of net output) such a 1968 production function is not suitable for
gross output per man-year volume comparisons between 1968 and 1976, nor between the latter and the marginal Table 6.
All that is intended in this section is to indicate briefly that quite complicalcd problems underlie any attempt to compile a marginal table such as Table 6.
The (I-A) Inverse and Derivatives
Sixteen of the 17 sectors of Table 6 have been used in the usual way to obtain an (I-A) inverse and primary input coefficients, as given in Table 7. The clothing sector was omitted and the revised solid |hel estimate was included. The direct plus indirect amounts of primary inputs arc available [or comparison with Table 31976 average results. The Table 7 primary input coefficients should add to unity, but because of the omission of clothing dw
Table 6 column sums are imperfect and thus small departures "from unity arc observed in Table 7 primary input aggregates. These primary input coefticients
are better for the more robust Table 6 sectors; that is sectors (1), (4) to (lo), (13) to (x 7), which is 12 of the 17 sectors of Table 6. The six largest Table 6 mal’gi~l,d changes relate to food(g418m.), other manu|a_cturing (£~x3m.), agricuhure
(£~54m.), construction (£~olm.), trade and services (£6o7m.), ar|ilicial (£444m.). We expect relatively reliable Table 7 coefficients tor these sectors.
T.here are. total employment coefficients, with agricultural employment shown separately. Likewise capital stock coeiticients are shown with agricultural capital stock stock separately. The capital stock per man-year derived from these capital and employment coefficients appears as the last row of Table 7. There is little point in commenting on the detailed figures, which
IRISH INPUT--OUTPUT STRUCTURES, 1976 31
Primary Input Components of Final Demands
Tile allocation of primary inputs among the marginal final demands is given in Table 8, which parallels the 1976 Table 4. Employment and capital stock allocations also appear in Table 8 ; from these the usual capital stock per man-year. ratios are derived.
Tile employment estimates are worth comment. Of" the ~37 ooo standardised:": man-years accounted for by 1968-76 growth, lO4 ooo are associated with export growth and 75 ooo with expansion of" government current expenditure. Growth of capital formation has ~6 ooo related to it. Personal consumption growth shows 33 ooo. The 53 ooo agricultural man-years shows 4~ ooo related to exports and 11 ooo to personal consumption.
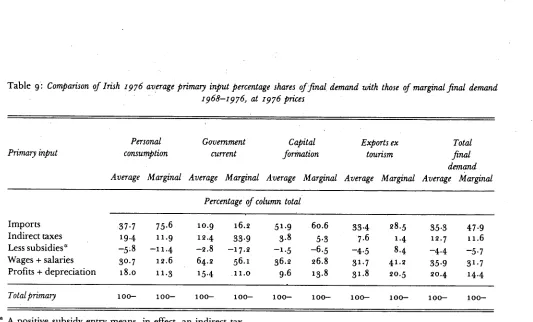
Primary Input Percentage Shares of Final Demand, Average and Marginal
A comparison of the 1976 average primary input shares of final demands with tile marginal 1968-1976 shares appears in Table 9, the last table of this part of tile report.
For total final demand, imports take 48 per cent of the margin, versus 35 per cent of 1976 average. The marginal shares for both wages and profits show compensating reductions, versus average shares.
Marginal capital formation shows 61 per cent imports and 27 per cent wages; the average 1976 shares are 52 per cent imports and 36 per cent wages.
Marginal exports have smaller import content than the average (29 per cent versus 33); they have larger wage content (41 per cent versus 3~) and smaller profits content (~1 per cent versus 3~).
Marginal government current expenditure has higher imports and indirect taxes and lower wages and profits.
Tile comparison of marginal and average personal consumption input shares reveals the largest changes observed. Marginal personal consumption has an input of 76 per cent imports, twice the 38 per cent import content o| 1976 average consumption. Marginal shows three input shares much smaller than those of average: wages 13 per cent versus 31 ; indirect taxes 1~ per cent versus 19; profits 11 per cent versus 18.
It therefore appears that in terms of minimum import content, and, therefore, maximum GNP content, the best growth was that of" government current expenditure (only 16 per cent imports) followed by exports (~9 per cent import content). Capital formation growth lags far behind as a GNP stimulus, with 61 per cent imports, while personal expenditure growth is even worse, having 76 per cent imports. Because of the limitations of data input, it is
THE ECONOMIC AND SOCIAL RESEARCH INSTITUTE
dangerous to be over-confident about the precision of the figures quoted. Perhaps the only real surprise is the extraordinary import content of marginal personal expenditure, at 76 per cent, versus 38 per cent average for 1976.
Part 6
Input-Output Analysis of Economic Policy Issues
T
HIS section illustrates the role of input-output analysis in providing various measures of the effects of" one economic choice or policy in comparison with another. The third part of the O’Connor and Henry textbook(1975) and the fourth section of the Copeland and Henry paper (1975) have several illustrations of policy analysis. But what |bllows not merely shows how
to use average or marginal data of’Tables 1 to 9 of’the present paper in a correct way; it also suggests how to improve their estimating power by allowing |or likely changes in coefficients over time, if’we want to apply them to events of the year 198o or 1985.
Likely Changes to x976-Type Economic Structures in Later Years
Since the marginal tables are at 1976 prices and factor intensities, we will refer to both 1976 annual and 1968-1976 marginal figures as a976-type. Even if we cannot put precise figures on the etti~cts of" changes to x 976-type structures [’or years later than 1976, we do well to be aware ot’ them, as qualifying any
estimates the x9-sector I-O model provides. As will be seen shortly, some ot these changes operate against others, which makes their net result less fbreseeable. One may, however, give an unmoditled 1976-type structure estimate and then add as many modified estimates as one wishes. The examples below will illustrate the procedure. The changes likely to a|t’ect 1976-type structures are of" fbur kinds: (i) employment intensity; (if) capital stock intensity; (iii) import intensity; (iv) energy intensity. We are always calculating at 1976 real prices, in what follows. Brief comment on these changes is desirable.
(i) Employment Intensity Decreasing
Murphy et. al. (1977) in their NESC report on alternative growth rates in Irish agriculture find an annual decrease of’ e. 1 per cent in agricuhural employment regardless of what happens. Much of the underlying cause of" this, as kindly pointed out to the writer by Professor R. O’Connor, is that I11e nominal employment in agriculture includes many rather young and rather old men and many partly-employed or unemployed men of normal working ages (eo-65 years). Therefore a continuing leakage out of agriculture is likely as job opportunities arise in other sectors. It is, there~bre, advisable to keep agricultural employment separable in any I-O results derived ti’om x976 Tables a to 9 and to scale down the agricultural employment by e. 1 per cent per
34 THE ECONOMIC AND SOCIAL RESEARCH INSTITUTE
year, for eachyear later than 1976. Thus we are reducing the employnlent intensity of agriculture p.er unit final demand at the rate o1"2.1 per cent per year.
Some other sectors may also have a decreasing employment intensity (with increasing capital intensity) as time goes on, as occurrred in Irish industry during 196o-68 (Henry 197 ~a). But if energy becomes increasingly scarce and dear, tile continuous substitution of capital equipment tbr labour nlay slow down or even go into reverse.
(ii)Gross Capital Stock per Man-Year Increasing
Increasing gross capital stock per man-year was evident in all 14 industrial sectors during 1953 to 1968 (Henry, 197~a). This trend has persisted up to
recently, if.one assumes thatincreasing industrial productivity (real value added per man-year) is the direct result of increasing industrial mechanisation (gross capital stock per man-year). We might, therefore, increase the 1976-level estimate of capital stock relating to a 198o economic issue, ifwe suppose the trend of increasing capital stock per man-year will continue into the future. The rate of increase will not be discussed at this point. But energy scarcity may slow down or rev.erse the process.
(iii) Import Intensity Increasing
By means of Table 9 data for 1976, and 1968 data from Appendix 1.~ oI the Henry (i97~b) paper on 1968 input-output structures, it appears that in 1976 tile import share of total final demand was 35.3 per cent, compared with ~9.9 per cent for 1968, at current prices. The apparent increase in import intensity,
about 0.7 per cent of total final demand per year, can be interpreted as either a volume increase, or a "real price" increase, or (most probable) a combination of both. Only a detailed volume-index import analysis would answer this question. We may; however, reasonably assume that this trend in increasing import intensity will persist. It can be explained by the severe increases ill energy prices (meaning that at 1976 real prices energy now costs more than in
1976) and their carry-over On to all other import prices. A further real increase in import prices could arise from the punt (Irish t3) losing value against sterling and ot!ler foreign currencies,Note that we are here considering average annual s tructures.
BUt if imports absorb a larger share of final demand, then of necessity the GNP components (indirect taxes, subsidies, wages, etc., profits, etc.) have a sm~aller share left to them. For a given final demand at 19"76 average prices (e.g., after, deflation.by the consumer price index based on unity tot 1976) if imports have a bigger share, GNP necessarily has a smaller share; than pertained in
.1976. Here again we are discussing the 1976 annual model.
IRISH INPUT--OUTPUT STRUCTURES, 1976 55
(iv) Energy Intensity Stable or Decreasing
For the medium-term future (up to 199o) it will probably be necessary to import up to 9o per cent of Ireland’s fuels and energy supply. The energy imports are included in the general import bill discussed under (iii) above, so that any increasing real cost of" energy will not appear separately ti~om the general cost of imports.
But for energy costs increasing in real terms, with perhaps genuine scarcity or limited amounts available, two likely events are the tbllowing:
(a) energy conservation will give a specified output for less energy input than in 1976;
(b) tile increase in intensity of capital and decrease in intensity of employment may slow down or cease, which would counteract the trends considered possible in (i) and (ii) above, namely less labour with more machinery to produce a.given output.
Thus it is possible that by 1985 or 199o some "freeze" of labour and capital intensity (per unit final demand) will have occurred, as a direct result ot the energy constraint. But so little can be clearly predicted about what will haploen
that it is not possible to make projections with any degree of certainty. Tile two examples which tbllow use "1976-type" input-output data, with further variafions which take some account of points (i) to (iv) above. The tirst example compares two export schedules; the second examines a governmental
choice between spending on capital construction or services. We consider both average and marginal evidence, in our illustrations.
Example 1 : Comparison of economic implications oJ £1 m. oJ exports o/Jood with those oJ
a like export of metal and engineering products
In order to compare the et’iects of tbod exports with those of metal and engineering we start with "direct plus indirect" coefficients, columns (1) and (8) of Tables 3 and 8. Table 1o gives the 1976-type unmoditled coefticients ior £1m. of final demand by way of exports. Implicit assumptions are that these exports can be sold at the stated prices and that all inputs are available at the assumed input costs and proportions. We consider average structures first, then marginal structures.
Comparison of Average Structures
36
Table 1 o:
" THE ECONOMIC AND SOCIAL RESEARCH INSTITUTE
Estimated economic outcome in 1976 of Eim. o[ exports oJJoo.d and oJ metal via x 976 unmodified stntctures, at 1976 prices
Average Marginal
Item (1) Food (8) Metal (1) Food (8) Metal
£m. £m. £m. £m,
(a) Imports 0.259 0.425 0.232 o.143
(b) Indirect Taxes 0.072 0.088 O.111 O.117
(c) Less subsidies -o.o69 -o.o28 .o42 -o.o65
(d) Wages etc. o.272 o.352 o.251 o.553
(e) Profits + deprec, o.466 o.163 o.375 o.254
[GNP = (b)+(c)÷(d)+(e)] [o.741] [o.575] [o.779] [o.859J
Capital Stock-required 1.799 1.45° 1.634 2.2 o4
man-years man-years man-years man-years
Total employment
(man-years) 216.7 11 o. 1 171.7 171.5
(Agriculture employment) (142.3) (0.7) (lO4.4) (1.2) (Non-agricultural
employment) (74.4) ( x o9.4) (67.3) (17o.3)
We not~i~ that food man-years include 142 man-years in agriculture, leaving 74 man-years of non-agricultural employment vex~sus lO9 man-years tot metal. Even if tile Agriculture nominal man-years are given a value 0.5 each, the tood sector still has a "conservative" total employment of" 145 man-years. The reason for conservative acceptance of agriculture man-years has been discussed earlier in this section but a realistic scaling-down ratio is not known.
Comparison of Marginal Structures
Tile metal export appears tO be the slightly better investment for the national economy since £1 m. worth is associat~ed with: £o.86 m. of GNP compared with £o.78" m. for food, (ii) about 17~ man-years of employment with negligible agricultural content compared with, the game including lO4 man-years of
agriculturalemployment, (iii) more expensive capital stock of £2.2o m. compared with £1.63 m. for food. The average capital stock per man-year tor metal is £x~85o compared with £952o for fbod, both these ratios approximating the average-structure figures quoted above.
It is interesting that the marginal model gives results which disagree with the clear-cut superiority of food emerging from the average-structure model. The marginal model gives some advantages to the metal export.
Modification of 1976 Type Results for the Average Structure
IRISH INPUT--OUTPUT STRUCTURES, 1976 37
Employment:
Capital stock:
Imports:
Energy:
reduce 1976 estimates by 11 per cent |or agriculture, by 5 per cent (1 per cent per year) tbr non-agriculture.
increase by ~5 per cent (i.e., linear 5 per cent per year), in accordance with 1968-197~ growth of capital per man-year suggested in the production thnction estimated by Henry
(197~a).
increase by 4 per cent per year, linear, twice the general rate observed fbr 1968-76 at current prices. This means a so per cent increase fi’om 1976 to 1981.
assume that there is no significant change ti’om 1976; thus the employment, capital stock and import moditications ¯ just stated above do not need amendment.
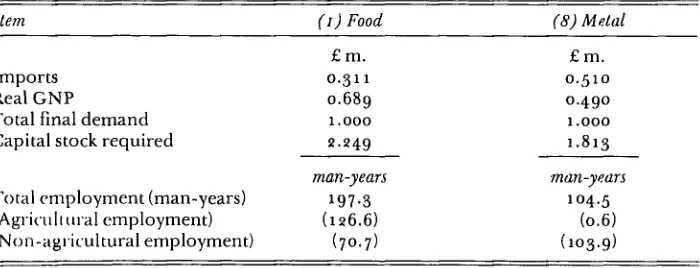
[image:38.487.53.403.280.414.2]The modified Table lO results are shown in Table 11 and the uncertain size ot die amendments should be noted.
Table 1 x : Estimated economic outcome in 198I of £Im. oJexports oJJood and oJ metal at J976 prices, via modified 1976 I-0 structures (average only)
Item (1) Food (8) Metal
£m. £m.
Imports 0.311 o. 51 o
Real GNP 0.689 o.49o
Total final demand 1.ooo a.ooo
Capital stock required ~.~49 1.813
man-years
Total employment (man-years) 197.3 (Agvicuh ural employment) (1~6.6) (Non-agricultural employment) (7o.7)
man-years
104.5 (0.6) (ao3.9)
The comparative position of food versus metal is unchanged by the differences between Table lo and Table 11. This suggests that large differences between sectors will persist for the kind of changes illustrated, so that choices can be made on unmodified 1976 results. Of course where Table 11 loses out is in its lack of precision for 1981 or some such post-1976 period, apart from any question of its validity as being average, rather than marginal.
Outside the scope of this paper, but well worth mention, is the t~tct that information on a new food industry or a new engineering industry can be used, to include an extra one or more rows and columns to Tables 1 or 6, (the latter being background) and perform analysis of the kind shown in Tables ~ to 4 and
38 THE ECONOMIC AND SOCIAL RESEARCH INSTITUTE
Example 2: The choice between public capital investment in construction and
expenditure on public services
We suppose that government wishes to make a comparfi.tive analysis ot the economic outcome of£1 m. invested in ( x3i new and repair construction versus £1 m. spent on (16) trade margin and services. Before performing the analysis it is well to realise that sectors (13) and (16) of Tables 1 or 6 (and derived results) are too aggregate to give satisfactory answers to the kind of problem being considered here. A much more detailed table would be needed, to provide a more refined analysis. Or Tables t or 6 could be used as background and fi’amework for separately detailed information, along the’lines explained in the last paragraph Of Example x.
I n view of the aggregate nature of the data for the problem being considered we will use 1976 unmodified estimates to illustrate the comparison. Example 1 has already illustrated the possible modifications fbr years |ollowing a976.
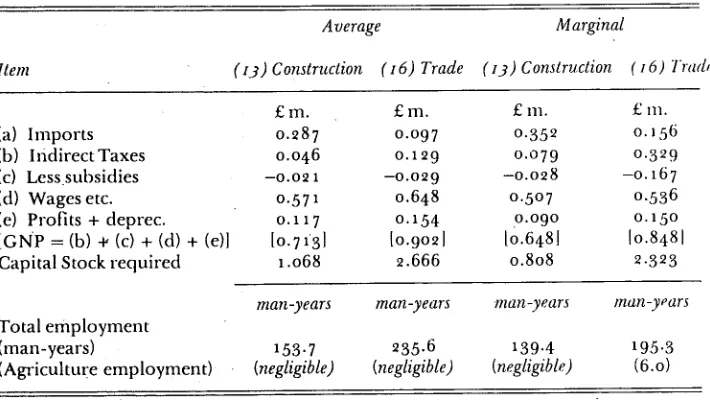
[image:39.485.82.437.393.595.2]Comparison of Average Structures
Table 1 ~ sets out the comparative analysis. The comparison is interesting, as it shows conflicting results as follow:
(i)For GNP and employmer~t, sector (a6), trade margin and services, is superior; since the agricultural employment content is negligible we do not have doubts about the employment estimates of the kind which arose in Example x.
Tab’le 12: Estimated economic outcome in 1976 of £im. spent on construction and services at
1976 prices
Item
Average Marginal
(13) Construction (I6) Trade (13) Construction (16) l’rade
£ m. £ m. £ m. £ m.
(a) hnports o.~87 0.097 o.352 o.156
(b) h:ldirectTaxes o.o46 o.129 o.o79 o.329
(c) Lesssubsidies -o.o~ 1 -o.o29 -o.o28 -o. 167
(d) Wages etc. o.571 o.648 o.5o7 o.536
(e) Profits + deprec. O.ll7 o.154 0.090 o.15o
[GNP = (b) ÷ (c) + (d) + (e)] [o.7131 1o.9o21 [o.648] 1o.8481
Capital Stock required 1.o68 2.666 o.8o8 2.323
man-years man-years man-years man-years
Total employment
(man-years) 153.7 235.6 139.4 195.3
IRISH INPUT--OUTPUT STRUCTURES, 1976 39
(ii)For capital stock per man-year, (13) construction is more efficient, having £6 950 man-year versus £11 3~o per man-year for trade.
(iii)For import content and balance of payments, trade is preterable, having lo per cent versus ~9 per cent for construction.
Comparison of Marginal Structures
Tile marginal comparison shows parallel conflicting results, as follows:
(i) For GNP and employment, trade is better than construction.
(ii) For capital stock per man-year, construction is more efticient, having
£5 79o per man-year compared with £11 89o tbr trade.
(iii)For import content and balance of payments, trad.e is preferable, having 16 per cent versus 35 per cent for construction.
In this example the marginal model gives the same kind of" evidence as the average model, namely, that for some economic aspects trade is the better and for other aspects construction is the better.
Social and Economic Problems not Measurable by the I-0 Models oJ this Report
Our analysis cannot go into the deeper question of" the human need for, or tile human utility of, the capital construction versus the service. It is obvious that both [lousing construction and, e.g., medical services are required. The result of £1 m. spent on housing construction, illustrated by the figures for
sector (13) in Table 1~, means that in addition to Table 1~ results we have a capital structure worth £1 m. and usable for ~5 or 5o years ahead. The result of £1 m. spent on medical services, illustrated by the figures for sector (16) in Table 1 ~, means that in addition to Table 1~ results we have members of the public in better health.
It is, however, possible to investigate further the economic costs and benefits surrounding each of two choices such as the columns of Table 1~; only a mention will be made here of some such further considerations. If" the choice is for housing, the loss of medical service, means (or may mean) unemployment benefits payable by government and various compensations due to illness. It tile choice is for medical services the loss of the extra housing may mean considerable human inconvenience, not measurable by our model, and perhaps relatively high rental payments ibr private accommodation.


![Crystal structure of poly[[di μ3 acetato tetraaquabis(μ2 cyclohexane 1,4 dicarboxylato)dilanthanum(III)] dihydrate]](data:image/gif;base64,R0lGODlhAQABAIAAAP///wAAACH5BAEAAAAALAAAAAABAAEAAAICRAEAOw==)