Atmos. Meas. Tech., 11, 65–80, 2018 https://doi.org/10.5194/amt-11-65-2018
© Author(s) 2018. This work is distributed under the Creative Commons Attribution 3.0 License.
Development, characterization and first deployment of an improved
online reactive oxygen species analyzer
Jun Zhou1, Emily A. Bruns1, Peter Zotter2, Giulia Stefenelli1, André S. H. Prévôt1, Urs Baltensperger1, Imad El-Haddad1, and Josef Dommen1
1Paul Scherrer Institute, Laboratory of Atmospheric Chemistry, 5232 Villigen PSI, Switzerland
2Lucerne University of Applied Sciences and Arts, School of Engineering and Architecture, CC Thermal
Energy Systems and Technology, Bioenergy Research, 6048 Horw, Switzerland Correspondence:Josef Dommen ([email protected])
Received: 22 May 2017 – Discussion started: 29 May 2017
Revised: 30 October 2017 – Accepted: 6 November 2017 – Published: 9 January 2018
Abstract. Inhalation of atmospheric particles is linked to human diseases. Reactive oxygen species (ROS) present in these atmospheric aerosols may play an important role. However, the ROS content in aerosols and their formation pathways are still largely unknown. Here, we have devel-oped an online and offline ROS analyzer using a 20,70 -dichlorofluorescin (DCFH) based assay. The ROS analyzer was calibrated with H2O2 and its sensitivity was
charac-terized using a suite of model organic compounds. The in-strument detection limit determined as 3 times the noise is 1.3 nmol L−1 for offline analysis and 2 nmol m−3 of sam-pled air when the instrument is operated online at a fluo-rescence response time of approximately 8 min, while the offline method detection limit is 18 nmol L−1. Potential in-terferences from gas-phase O3 and NO2 as well as matrix
effects of particulate SO24− and NO−3 were tested, but not observed. Fe3+ had no influence on the ROS signal, while soluble Fe2+ reduced it if present at high concentrations in the extracts. Both online and offline methods were applied to identify the ROS content of different aerosol types, i.e., ambient aerosols as well as fresh and aged aerosols from wood combustion emissions. The stability of the ROS was assessed by comparing the ROS concentration measured by the same instrumentation online in situ with offline measure-ments. We also analyzed the evolution of ROS in specific samples by conducting the analysis after storage times of up to 4 months. The ROS were observed to decay with in-creasing storage duration. From their decay behavior, ROS in secondary organic aerosol (SOA) can be separated into and long-lived fractions. The half-life of the
short-lived fraction was 1.7±0.4 h, while the half-life of the long-lived fraction could not be determined with our uncertainties. All these measurements showed consistently that on average 60±20 % of the ROS were very reactive and disappeared during the filter storage time. This demonstrates the impor-tance of a fast online measurement of ROS.
1 Introduction
Aerosol particles have negative effects on human health (Pope and Dockery, 2006), with an estimated 3 % of car-diopulmonary and 5 % of lung cancer deaths attributable to particulate matter (PM) globally (WHO, 2013). One of the important pathways leading to deleterious impacts on health is believed to be induced oxidative stress by the generation of reactive oxygen species (ROS), through the interaction of particulate matter with the human lung (Donaldson et al., 2002). Reactive oxygen species denote chemically reactive molecules containing oxygen (e.g., radicals, oxygen ions and peroxides including the OH radical, the O−2 radical, H2O2or
organic peroxides) (Fuller et al., 2014; Sagai et al., 1993). As one of the main free radical sources generated in our body by various endogenous systems, ROS can adversely al-ter lipids, proteins and DNA structures, potentially leading to aging and numerous human diseases (Devasagayam et al., 2004). ROS exist both in the gas phase and in PM. ROS are either produced inside the human body through generation by the inhaled PM (e.g., by transition metals) in vivo (endoge-nous ROS) or by transportation into the lungs on respirable
particles (exogenous ROS) (Zhao and Hopke, 2012). While gas-phase ROS are most likely removed in the upper mucus membranes through diffusion (Kao and Wang, 2002), ROS associated with fine particles can penetrate deeply into the lungs, causing oxidative stress and cell damage. Understand-ing the mechanisms by which ROS are formed, evolve and decay in the atmosphere is therefore of utmost importance for mitigating their influence on human health (Khurshid et al., 2014).
Currently, many acellular assays exist for the determi-nation of ROS quantities in particles, including dithiothre-itol (DTT) (Fang et al., 2015) and 20,70-dichlorofluorescin (DCFH) (Fuller et al., 2014; King and Weber, 2013; Wang et al., 2011). The DCFH assay is one of the most com-monly used assays today. Accurate ROS quantification re-mains challenging because some ROS are highly reactive and are likely at least partially degraded prior to measurement when using offline techniques, which typically have delays of hours, days or weeks. Therefore, online techniques (through direct sampling into the liquid phase and measurement within a few minutes) are necessary for reliable ROS quantification (Wragg et al., 2016).
In this work, we developed and characterized a highly sensitive ROS analyzer which can be used either online or offline. The removing efficiency of interfering oxidizing trace gases of O3 and NO2 was tested, and the matrix
ef-fects of particulate SO24−and NO−3 as well as transition met-als were assessed. Results from the application of this on-line and offon-line methodology to laboratory measurements of wood combustion emissions and ambient measurements at an urban site in Bern (Switzerland) are presented. To assess the stability of ROS, online in situ measurements were com-pared with offline measurements using the same instrumenta-tion, and the evolution of ROS on specific samples was eval-uated by conducting the analysis after storage times of up to 4 months. The results are put into perspective for future ROS measurement strategies.
2 Methods 2.1 ROS analyzer
In our experiments, ROS were measured using a DCFH as-say, which is commonly used for examining ROS generation at a cellular level but has also been used for determining the oxidation potential of PM as an acellular assay (Fuller et al., 2014; King and Weber, 2013; Perrone et al., 2016; Sauvain et al., 2013; Venkatachari et al., 2005, 2007). In this assay, the presence of oxidizing species is assessed from the rapid oxidation of DCFH to the fluorescent compound dichloroflu-orescein (DCF) in the presence of horseradish peroxidase (HRP). The chemical reaction mechanism is shown in Fig. S1 in the Supplement.
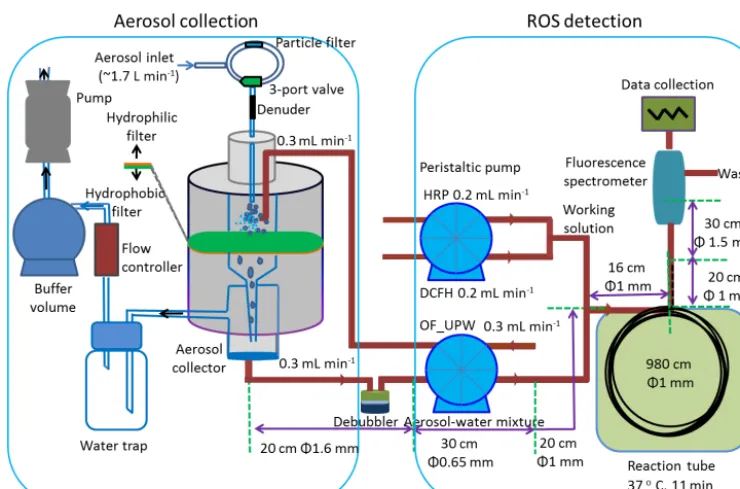
A schematic of the online aerosol ROS analyzer is shown in Fig. 1. The analyzer is composed of three components: the aerosol collector, the reaction chamber and the fluorescence analyzer. The same setup without the aerosol collector was used for offline analysis (Fig. S2).
2.1.1 Aerosol collection
Particles were collected at a flow rate of∼1.7 L min−1, us-ing an aerosol collector, of which the main part is the mist chamber (Takeuchi et al., 2005). Before the aerosol collec-tor, a honeycomb charcoal denuder of 10 cm length with 7 mm outer diameter (36 % open area; 450 µm channel width) was installed inside a stainless steel tube to remove O3,
NO2 and organic vapors. The denuder was regenerated for
at least 24 h at 250◦C under a stream of 99.999 % N2
be-fore each experiment. By using at least two denuders, we were able to switch between them and to perform the ex-periments continuously. The Plexiglas aerosol collector had an approximate volume of 13.5 cm3. It consisted of an air inlet, a nebulizing nozzle inlet port for pure water injec-tion, a mist chamber, a 2.5 cm diameter hydrophilic cellu-lose filter (Grade 497 circles, Schleicher & Schuell Rund-filter) supported by a 5.0 µm pore size hydrophobic mem-brane filter (Isopore memmem-brane filters, TMTP series, Merck Millipore) to prevent the loss of the sample solution, an out-let to the vacuum pump and an exit for the water extracts (Fig. 1). The collection efficiency for water-soluble parti-cles was determined by Takeuchi et al. (2005) to be 80 % for 100 nm particles and higher than 97.7 % for particles > 280 nm. Between the vacuum pump and the mist chamber, a flow controller protected by a water trap was installed. To stabilize the air sampling flow, an additional gas buffer vol-ume was introduced before the pump. The 1.7 L min−1 air stream was mixed with oxygen-free ultra-pure water (OF-UPW), which was continuously sprayed into the mist cham-ber with a flow rate of 0.3 mL min−1, where the aerosol par-ticles were incorporated into the water droplets. The liquid containing the water-soluble fraction of the aerosol was con-tinuously collected at the bottom of the aerosol collector at a flow rate of 0.3 mL min−1and then mixed with the work-ing solution (WS) at a flow rate of 0.4 mL min−1for analy-sis. This resulted in a total flow rate of 0.7 mL min−1. There-fore, the measurement of ROS is continuous, which provides real-time measurement of ROS. OF-UPW was prepared by bubbling 99.999 % N2 for ∼20 min through Milli-Q water
(18.2 Mcm at 25◦C, total organic carbon < 3 ppb) to
duce the dissolved oxygen. The use of oxygen-free water re-duced the instrument background by a factor of∼2 com-pared to normal ultra-pure water.
J. Zhou et al.: Development, characterization and first deployment 67
Figure 1.An overview of the online ROS analyzer. OF-UPW refers to oxygen-free ultra-pure water. The same setup without the aerosol collector was used for the offline analysis (shown in Fig. S2).
DCFH working solution, the signal, which is actually the background, increased with a rate of 0.9 % h−1. This means that there is a slow reaction with the dissolved oxygen con-suming the DCFH consequently shortening the lifespan of the HRP–DCFH solution. When the sample is extracted on-line with the HRP solution as in Fuller et al. (2014), the HRP needs to go through the aerosol collector, where contami-nants adsorbed on the hydrophilic and hydrophobic filters or the oxygen in the mist chamber might react with HRP and then oxidize DCFH as described by Berglund et al. (2002) and modified by Fuller et al. (2014). Therefore, we used only OF-UPW to extract the aerosol samples. The DCFH and HRP reagents were kept separate and were only mixed together right before the aerosol aqueous extract was added. 2.1.2 ROS detection
The aerosol aqueous extract collected from the aerosol col-lector was sampled by a peristaltic pump through a “TRACE TRAP bubble trap” debubbler (TRACE Analytics GmbH, Germany), which effectively removed gas bubbles in the sample liquid without introducing a large dead liquid volume and signal broadening. At the same time, the two reagent so-lutions DCFH and HRP were drawn by another peristaltic pump and mixed to form the WS. The aerosol aqueous ex-tract was then mixed with the WS and pumped through a re-action coil consisting of polyetheretherketone (PEEK) tubing (9.8 m length, 1.6 mm OD, 1.0 mm ID, Kinesis GmbH) in an air-ventilated temperature controlled housing held at 37◦C. The obtained solution was then analyzed using a
spectrofluo-rometer with excitation and emission wavelengths of 470 and 520 nm, respectively. All transparent parts of the system were wrapped with aluminum foil to avoid the photooxidation of the DCFH.
2.1.3 Offline analysis
The instrument was also used for offline analysis of filters (Fig. S2). In general, we extracted a filter punch of 14 mm∅ of the filter area in 10 mL of OF-UPW for 15 min at 30◦C. However, the filter area and/or the volume of the OF-UPW was sometimes adjusted to keep the extracted ROS con-centration in the measurement range of the instrument. The vial was then vortexed (Vortex Genie 2, Bender & Holbein AG, Switzerland) for 1 min to ensure homogeneity and fil-tered through a 0.45 µm nylon membrane syringe filter (In-fochroma, Switzerland). The extract was then injected into the ROS analyzer in the same way as the online method with a flow rate of 0.3 mL min−1and mixed with the working so-lution at a rate of 0.4 mL min−1for analysis. Thus, the mix-ture of the flows was the same for online and offline analysis. Often filters are extracted in an ultrasonic bath. However, recent studies suggest that sonication of pure water with dissolved air may create hydroxyl radicals due to the high temperature and pressure created by the collapse of bubbles formed by cavitation, which then form H2O2 or react with
sample species (Mark et al., 1998; Miljevic et al., 2014). This was also demonstrated by Fuller et al. (2014), who showed the formation of 0.08 nmol m−3 ROS by the sonication of pure water. These effects have also been confirmed in our
laboratory by analyzing filters collected at an urban site in Milan extracted with and without sonication (Perrone et al., 2016). Therefore, sonication was not used for filter extraction during offline measurements.
2.1.4 Working solution
The stability of the WS is an important factor. Since HRP can catalyze the reaction of DCFH with dissolved oxygen in the phosphate buffer (Berglund et al., 2002; Huang et al., 2016; Rota et al., 1999a, b), the phosphate buffer solution (PBS, 1 M, Sigma-Aldrich, USA) was degassed with 99.999 % N2
for∼20 min. Furthermore, the two reagents DCFH and HRP were prepared separately as follows:
For the DCFH reagent, 20,70-dichlorofluorescin diacetate (DCFH-DA) (0.61 mL, Sigma-Aldrich, USA) stock solution (0.001 M) was mixed with NaOH (10 mL, 0.001 M, Sigma-Aldrich, USA) for 30 min under dark conditions to initiate a deacetylation at room temperature. Then PBS (25 mL) was added to set the solution pH at 7.2 and neutralize any re-maining NaOH. This produces the fluorescent probe DCFH, referred to as WS-A hereafter.
For the HRP reagent, horseradish peroxidase (0.44 mg, HRP, type II, Sigma-Aldrich, USA) was dissolved in PBS (35.6 mL) to generate a stock solution of 2 units mL−1, which is referred to as WS-B afterwards.
WS-A and WS-B were then degassed for 20 min and only mixed together during the analysis at a 1:1 ratio. The final WS was 17.6 µM of DCFH and 1 unit mL−1 of HRP. This WS and the applied procedures provided the following ad-vantages compared to previous analyzers using the same as-say:
1. The pH of the WS was maintained constant at 7.2, which resulted in a stable background.
2. HRP and DCFH were prepared separately and mixed to-gether only right before the combination with the sam-ple solution. This reduced auto-oxidation and decreased the instrument background signal.
3. Both working solutions were stored at∼4◦C and could be used for up to 1 week, while a mixed DCFH–HRP is not stable for more than 1 day.
2.1.5 Calibration
The instrument was calibrated with known concentrations of H2O2solutions. Standards were prepared from a
concen-trated solution of hydrogen peroxide (H2O2, solution, 3 wt %
in water, Sigma-Aldrich). Calibration solutions of different concentrations were generated by diluting different amounts of a stock solution with OF-UPW. The blank values were ob-tained by measuring OF-UPW alone.
For the online operation mode, H2O2equivalent
particu-late ROS concentrationscwere determined as follows:
c nmol
m3
= I−b
a
Vi Qc
, (1)
whereI is the fluorescence signal (volt),bis the calibration intercept from the linear regression fit,a is the calibration slope from the linear regression fit (Volt nM−1),Viis the OF-UPW flow into the mist chamber (mL min−1), andQcis the
air flow through the aerosol collector (L min−1, at ambient temperature and pressure). For the offline operation mode, particulate ROS concentrations in air were determined as fol-lows:
c nmol
m3
= I−b
a
Vi Qc
Afilter Apunch
, (2)
whereViis the volume of OF-UPW for filter extraction (mL), Qcis the total air volume drawn through the filter (L, at
am-bient temperature and pressure) andApunchAfilter is the ratio of the area of the entire filter to the area of the filter punch.
The instrument background of the online operation mode was always higher than that of the offline operation mode, which may be due to the uptake of oxygen in the mist cham-ber in the online system.
2.2 Instrument maintenance and portability
The instrument can be easily disassembled and rebuilt to be used in both laboratory and field campaigns. The instru-ment is not yet fully automatized. The following manual op-erations are required: (1) calibration; (2) replacing the hy-drophilic and hydrophobic filters in the aerosol collector and the denuder every 2–3 days during ambient measurements – while in laboratory experiments, we exchanged the denuder for each laboratory experiment (∼5 h) to be on the safe side; (3) regularly switching the air inlet channel to the particle-free mode (ROS blank) and checking the air flow during the measurement (before the experiment, during the experiment and after the experiment) to insure that the air sample flow was constant at 1.7 L min−1; (4) cleaning of the ROS ana-lyzer with 1 M H2SO4 for∼12 h every 2 weeks to remove
contaminations in the system; (5) replacing all the tubes used in the system every 6 months.
2.3 Instrument testing
In order to assess the performance of the ROS analyzer sev-eral tests were performed, including the following:
1. The influence of the reaction time and the instru-ment detection limit, repeatability and reproducibility (Sect. 3.1.1 and 3.1.2).
J. Zhou et al.: Development, characterization and first deployment 69
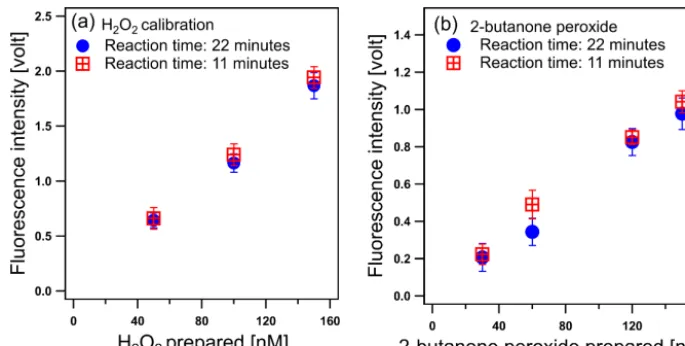
Figure 2. Fluorescence responses to(a)H2O2 and (b)2-butanone peroxide (2-hydroperoxy-2-(2-hydroperoxybutan-2-ylperoxy)butane)
under different reaction times. Error bars represent the propagation of the uncertainty
δ= q
δ21+δ22, withδ1representing the standard
deviation of the instrument background signal of that experiment day andδ2the standard deviation of the sample signal
.
3. Assessment of the interference from selected abundant gas-phase and PM constituents (Sect. 3.2 and 3.3) on the ROS signals.
4. Verification of the instrument performance using gen-uine aerosol samples. Measurement of the ROS con-tent in ambient aerosols was performed offline using filter samples collected in Milan (Italy), San Vittore (Switzerland) and Bern (Switzerland) and online us-ing the developed ROS analyzer in Bern (Switzerland) (Sect. 3.1.3, 3.4.1 and 3.4.2). These samples include to-tal suspended particulate matter (TSP), PM2.5and PM10
(particulate matter with a diameter smaller than 2.5 and 10 µm, respectively). Laboratory samples were also measured, including online and offline ROS measure-ments of fresh and aged aerosols from wood combustion emissions, by using two different aging tools, a poten-tial aerosol mass (PAM) chamber and a smog chamber (SC). Tests aimed at the verification of the instrument linearity, the assessment of matrix effects, the compar-ison of online and offline ROS measurements and the examination of the ROS degradation.
3 Results
3.1 Instrument performance
3.1.1 Reaction time and detection limit
The reaction time between the WS and the aerosol sam-ple is an important parameter. Here, reaction times of 11 and 22 min were investigated by using different reac-tion tube lengths in the reacreac-tion chamber and followed by
measurement of the fluorescence intensity resulting from the reaction of H2O2 (Fig. 2a) and
2-hydroperoxy-2-(2-hydroperoxybutan-2-ylperoxy)butane (Fig. 2b) with the WS. The 22 min reaction time resulted in a 35 % higher instru-mental background signal than the 11 min reaction time. However, the same incremental increase in fluorescence in-tensity was found for the sample solutions of both H2O2and
the organic peroxide at the two reaction times, resulting in the same detection sensitivity. Here the detection sensitiv-ity (V nM−1)is defined as the ratio between the change in the output signal (in volt) to the corresponding change in the peroxide concentration (in nM). This suggest that the fluo-rescence response is unaffected by the reaction time in the investigated range, even for compounds protected bytert -butyl groups. Therefore, a reaction of 11 min seems to be sufficient to reduce all peroxides that can react with DCFH and we consequently used this reaction time for the further experiments. The residence and response time of the sample in the instrument were measured to be approximately 19 and 8 min, respectively. The former was determined as the time from the injection of an H2O2solution to the time the
fluo-rescence signal started to increase, while the response time corresponds to the rise time of the fluorescence signal from 10 to 90 % of the full signal.
Under normal instrument operation conditions, an instru-ment limit of detection (LOD) of 2 nmol m−3of sampled
am-bient air was determined for the online methodology. This was obtained as 3 times the standard deviation when a parti-cle filter was placed in the sampling line upstream of the ana-lyzer (Long and Winefordner, 1983). For the offline method-ology, which is used for the instrument testing, it is important to define two different parameters: the instrument LOD and
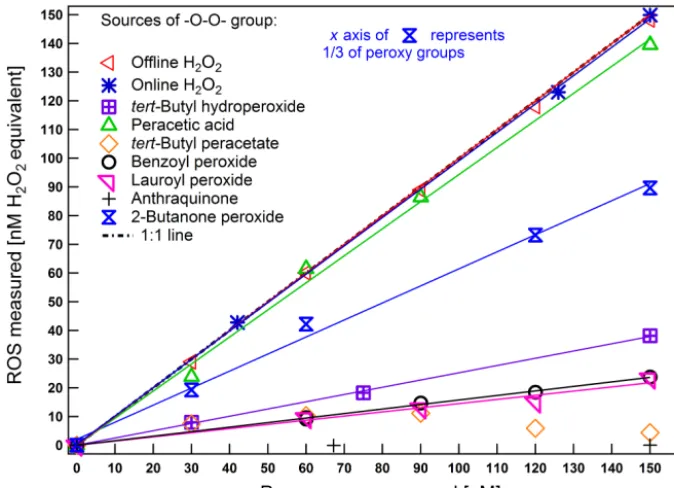
Figure 3.Calibration curves of H2O2and response of selected compounds (with the instrument used in the offline mode unless indicated
otherwise). Linear fits are shown for different peroxides and other compounds of interest in the concentration range of 0 to 150 nM. The correlation coefficientsR2were 0.99, except for lauroyl peroxide (R2=0.91).
the method LOD. The instrument LOD was 1.3 nmol L−1, determined as 3 times the standard deviation of the back-ground when OF-UPW was injected into the sampling line. The method LOD was determined based on the reproducibil-ity of the instrument background and the filter blanks. The reproducibility of the background was assessed by inject-ing different batches of OF-UPW several times. The value of 9 nmol L−1, equivalent to 3 times the standard deviation
of the resulting signals, was then used as a measure of this reproducibility and the offline method LOD. A similar LOD value was obtained as 3 times the standard deviation of the measurements of extracts of fractions of four different blank filters (2.2 cm2) and was equal to 13 nmol L−1 (for both quartz and Teflon filters). We note that the average signal of these blanks was 25 nmol L−1, which was subtracted from the signals measured when extracts of aerosol samples (with equivalent filter area) were injected.
3.1.2 Repeatability, reproducibility and response to selected model compounds
We assessed the instrument performance based on three re-peated calibrations with 0, 30, 50, 100 and 150 nM H2O2
(Fig. S3). The instrument accuracy in determining the ROS concentration was found to be 3 % (n=15), based on the standard deviation of the slope of the linear fit. The preci-sion (repeatability) of the preparation of the H2O2 solution
used for the calibration, estimated at different H2O2
concen-trations based on the fit prediction interval, was 25, 10 and
5 % at 30, 70 and 150 nM, respectively. Based on this, the uncertainty of H2O2at extremely low concentrations would
be 18 nM. This is larger than the method LOD determined above from the OF-UPW and blank filters. We consider the largest of these uncertainties (i.e., 18 nM) as our final method LOD.
The instrument reproducibility was assessed based on the variation in the instrument sensitivity (in V nM−1). In
prac-tice, we calculated the standard deviation of the response of 10 repeated measurements of known concentrations of H2O2
at different days using different WS. This reproducibility was found to be∼40 % (1σ), which is much higher than the in-strument precision, possibly due to the solution preparation and instrument operation conditions. Consequently, a cali-bration was always carried out at the beginning or at the end of each measurement series.
While the characterization tests discussed above were car-ried out using the offline mode, we obtained similar results when the instrument was used in the online mode. Figure 3 shows that a similar linear relationship was obtained between the instrument response and the H2O2concentration for the
online (blue stars) and offline (red triangles) modes, resulting in statistically similar sensitivities (t test, p value=0.93). This provides confidence in using the calibration and tests performed offline to predict online concentrations.
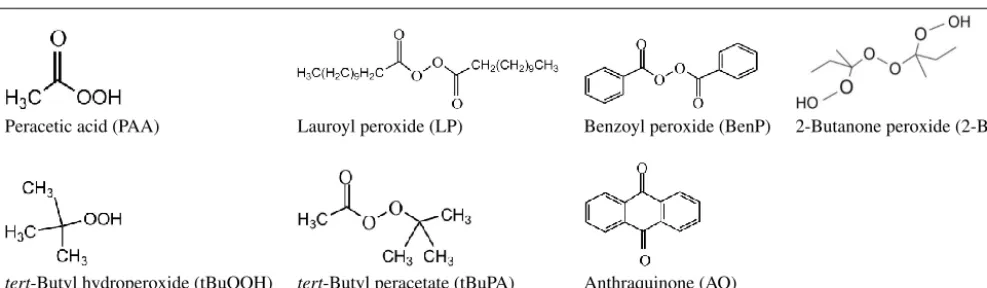
J. Zhou et al.: Development, characterization and first deployment 71 Table 1.Model organic peroxides used in this study.
28
Table 1. Model organic peroxides used in this study.
peracetic acid (PAA) lauroyl peroxide (LP) benzoyl peroxide (BenP) 2-butanone peroxide
(2-BP)
tert-butyl hydroperoxide
(tBuOOH)
tert-butyl peracetate (tBuPA) anthraquinone (AQ)
5
10
28 Table 1. Model organic peroxides used in this study.
peracetic acid (PAA) lauroyl peroxide (LP) benzoyl peroxide (BenP) 2-butanone peroxide
(2-BP)
tert-butyl hydroperoxide
(tBuOOH)
tert-butyl peracetate (tBuPA) anthraquinone (AQ)
5
10
28 Table 1. Model organic peroxides used in this study.
peracetic acid (PAA) lauroyl peroxide (LP) benzoyl peroxide (BenP) 2-butanone peroxide
(2-BP)
tert-butyl hydroperoxide
(tBuOOH)
tert-butyl peracetate (tBuPA) anthraquinone (AQ)
5
10
28
Table 1. Model organic peroxides used in this study.
peracetic acid (PAA) lauroyl peroxide (LP) benzoyl peroxide (BenP) 2-butanone peroxide
(2-BP)
tert-butyl hydroperoxide
(tBuOOH)
tert-butyl peracetate (tBuPA) anthraquinone (AQ)
5
10
Peracetic acid (PAA) Lauroyl peroxide (LP) Benzoyl peroxide (BenP) 2-Butanone peroxide (2-BP)
28
Table 1. Model organic peroxides used in this study.
peracetic acid (PAA) lauroyl peroxide (LP) benzoyl peroxide (BenP) 2-butanone peroxide
(2-BP)
tert-butyl hydroperoxide
(tBuOOH)
tert-butyl peracetate (tBuPA) anthraquinone (AQ)
5
10
28
Table 1. Model organic peroxides used in this study.
peracetic acid (PAA) lauroyl peroxide (LP) benzoyl peroxide (BenP) 2-butanone peroxide
(2-BP)
tert-butyl hydroperoxide
(tBuOOH)
tert-butyl peracetate (tBuPA) anthraquinone (AQ)
5
10
28
Table 1.
Model organic peroxides used in this study.
peracetic acid (PAA)
lauroyl peroxide (LP)
benzoyl peroxide (BenP)
2-butanone peroxide
(2-BP)
tert-butyl hydroperoxide
(tBuOOH)
tert-butyl peracetate (tBuPA)
anthraquinone (AQ)
5
10
tert-Butyl hydroperoxide (tBuOOH) tert-Butyl peracetate (tBuPA) Anthraquinone (AQ)
acid,≤6 % H2O2, Sigma-Aldrich),tert-butyl hydroperoxide
(tBuOOH; Luperox® TBH70X, 70 wt. % in water, Sigma-Aldrich), benzoyl peroxide (BenP; Luperox® A75, 75 %, remainder water, Sigma-Aldrich), lauroyl peroxide (LP; Luperox® LP, 97 %, Sigma-Aldrich), tert-butyl peracetate (tBuPA; Luperox® 7M50, 50 wt. % in aliphatic hydrocar-bons, Aldrich), anthraquinone (AQ; 97 %, Sigma-Aldrich) and 2-butanone peroxide (2-BP; Luperox® DHD-9, 32 wt. %, Sigma-Aldrich). Table 1 provides an overview of the chemical structures of these compounds. The water-soluble peroxides, i.e., PAA, tBuOOH and tBuPA, were dis-solved in OF-UPW. The water insoluble compounds, i.e., BenP, LP and AQ, were dissolved in ethyl acetate (99.8 %, Sigma-Aldrich) and then diluted (by a factor of ∼10 000) using OF-UPW.
Response curves of the selected compounds with an ex-pected capability to act as reactive oxygen species com-pared to H2O2 are shown in Fig. 3. PAA showed a
lin-ear fluorescence intensity response similar to H2O2
(rela-tive sensitivity s=93 %). In contrast, AQ and organic per-oxides like tBuPA barely reacted. Low responses were ob-served for tBuOOH (s=25 %), BenP (s=16 %) and LP (s=15 %), as well as for 2-BP, which includes three O-O-function groups (s=21 %). The hydroperoxide groups in tBuPA, tBuOOH, BenP, LP and 2-BP are heavily protected by tert-butyl, phenyl and alkyl groups, which likely sup-presses the reaction with DCFH. Less protected peroxides might be more reactive but such compounds are also less sta-ble and therefore not usually commercially availasta-ble. This in-dicates that, using a DCFH assay, the signal intensity of per-oxides varies significantly depending on the peroxide molec-ular structure and that sterically hindered peroxides may con-tribute much less to the DCFH signal. Thus, we regard the ROS signal measured by the DCFH assay as a lower limit for the effective ROS content. Additionally, components known to induce redox cycling (e.g., metal ions and anthraquinone) do not seem to react with DCFH. Thus, we conclude that DCFH measures the capability of particle-borne compounds
to act as reactive oxygen species rather than the potential of species to mediate ROS formation.
3.1.3 Instrument performance in ambient and smog chamber measurements
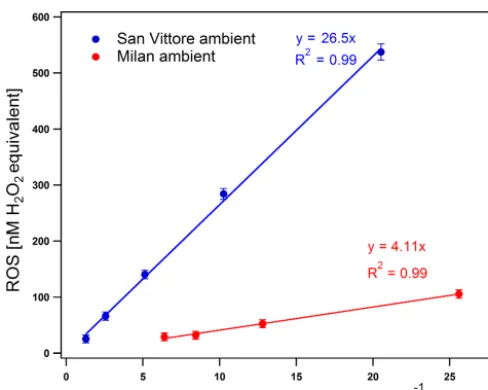
In order to evaluate the performance of the ROS analyzer in the field, two sets of experiments were conducted. In the first set, the instrument was operated in the offline mode using filter samples collected at two different sites: (a) a site influenced by traffic emissions in Milan (northern Italy), where quartz filters were sampled during October 2013 (Per-rone et al., 2016); and (b) a rural site in San Vittore (south-ern Switzerland in an Alpine valley) influenced by biomass burning, where samples were collected during January 2013 (Daellenbach et al., 2017; Zotter et al., 2014). More details on the analysis of the samples can be found in the cited references. The samples from both sites were stored in the freezer at−20◦C for 2 years before ROS analysis. A filter punch was dissolved in water and several sample solutions were prepared by consecutive dilutions. Figure 4 shows a lin-ear relationship of the fluorescence response with decreas-ing particle mass concentration (based on the mass on the filter punch and assuming 100 % water solubility) for both samples, where equivalent H2O2concentrations span a wide
range, which confirms the instrument linearity. The differ-ent slopes between these two data sets might be due to the different emission sources (traffic in Milan and wood com-bustion in San Vittore) at these two locations (see Perrone et al., 2016; Zotter et al., 2014).
The second set of experiments was performed at the PSI smog chamber. Beechwood logs were combusted in a resi-dential wood burner (Avant, 2009, Attika), following the pro-cedure described in Bruns et al. (2016, 2017). The resulting emissions were sampled from the chimney through a heated line (473 K), diluted by a factor of∼8–10 using an ejector diluter (473 K; DI-1000, Dekati Ltd.), and injected into the smog chamber. Emissions were only sampled during the sta-ble flaming phase for 11–21 min and the total dilution
Figure 4.ROS content vs. dissolved particle mass concentration. Blue symbols represent PM10 samples from San Vittore in winter
(Switzerland), and red symbols represent TSP samples from Milan in autumn (Italy). The error bars represent the instrument precision (see Sect. 3.1.2).
tors ranged from∼100 to 200. Experiments were conducted at −10 or 15◦C and at a relative humidity of ∼50 %. Af-ter the characAf-terization of the primary emissions,d9-butanol (D9, 98 %, Cambridge Isotope Laboratories) was injected into the chamber to determine the OH exposure from its de-cay (Barmet et al., 2012). A continuous injection of nitrous acid (2.3–2.6 L min−1) was used to create OH by photolysis. The chamber was then irradiated with UV light (40 lights, 90–100 W, Cleo Performance, Philips) for 4.5–6 h (Platt et al., 2013). Real-time characterization of the aerosols from the smog chamber was carried out throughout the experiment with the online ROS analyzer and a high-resolution time-of-flight aerosol mass spectrometer (HR-ToF-AMS, Aerodyne Research Inc.).
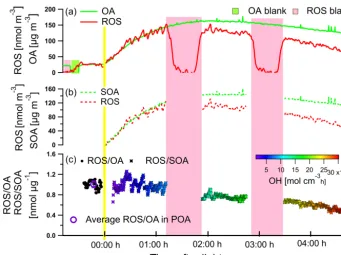
The evolution of ROS measured by the online method is shown in Fig. 5 for one exemplary smog chamber aging ex-periment. Injection of the wood combustion emissions led to a primary organic aerosol (POA) concentration of 25 µg m−3 and 26 nmol m−3 of particulate ROS in the smog chamber. After the lights were switched on (referred to as “lights on”), secondary organic aerosol (SOA) was produced and total or-ganic aerosol (OA) measured by AMS reached a maximum concentration 1 h later but then decreased because of higher wall loss than the SOA production rate. The ROS concen-tration increased concurrently with the increasing OA, in-dicating the formation of ROS by photochemical reactions induced by OH radicals, but then decreased faster than OA. When we sampled through a particle filter inserted upstream of the ROS online analyzer (pink areas), the ROS signal went to almost zero, which was considered as a measurement base-line during aging (Fig. 5a).
To investigate the influence of aging on ROS formation, SOA and secondary ROS (ROS formed during aging) were calculated by subtracting POA and primary ROS from the total OA and total ROS measured during lights on (Fig. 5b), respectively. Here the POA and primary ROS calculation was based on the assumption that they were not further oxidized after lights on and the wall loss rate was the same as for the inert tracer black carbon (BC). The content of ROS in SOA (represented by ROS/SOA) was in the range of 0.4– 1.26 nmol µg−1 within the oxidant OH exposure range of 0–30×106 molec m−3h. Initially, aging resulted in a high ROS content in SOA, which then decreased strongly with in-creasing OH exposure (Fig. 5c). This decrease could be due to further oxidation or decay of particulate ROS, indicating that first-generation products from the volatile organic com-pounds (VOCs) oxidation might play a more important role in ROS formation than later-generation molecules.
3.2 Gas-phase interference test
We tested the potential interference of trace gases and aerosol components on the DCFH signal. In principle, at the applied sample flow rate, 99 % of the trace gases should get removed by the denuder. Specifically, we assessed the removal effi-ciency of the denuder with respect to the most abundant oxi-dizing trace gases O3and NO2. After exposing the denuder to
464 ppb ozone for∼5 h, no increase in the background signal was observed (Table 2). An amount of 500 ppb NO2showed
no increase in the background signal even without the de-nuder. The results in Table 2 indicate that a newly regener-ated denuder completely removes O3, making the denuder
suitable for both smog chamber (usually∼5 h aging per ex-periment) and ambient measurements (1 day replacement in-terval). Based on these results we assume that gaseous H2O2
is also completely removed. Further, we regularly checked the ROS blank by measuring particle-free air by switching a three-port valve and sampling through a particle filter (dis-posable filter units, Balston, UK) installed in another line. 3.3 Particle-phase matrix effects
3.3.1 Particulate SO24−and NO−3
Previous measurements of filters from Milan showed a clear correlation of ROS with the particulate SO24−and NO−3 con-centration (Perrone et al., 2016). During the investigated pe-riod, the average SO24− and NO−3 concentrations in Milan were 4 and∼5–10 µg m−3, respectively. Here, we
investi-gate whether SO24−and NO−3 exhibit a response in the DCFH assay. Therefore, we tested the fluorescence response to ∼1.38 µM SO24−and∼20 µM NO−3 solutions prepared from (NH4)2SO4and NH4NO3, respectively. Such concentrations
concentra-J. Zhou et al.: Development, characterization and first deployment 73
Figure 5.Evolution of the concentrations of OA mass and ROS during an online wood combustion smog chamber aging experiment.(a)Total OA and ROS,(b)SOA and ROS,(c)ROS content in the OA (before lights on) and ROS content in the SOA (after lights on) as a function of the OH dose.
Table 2.Effects of the potential interferences in the gas and aerosol phase on the DCFH signal.
Species tested Concentration applied Measured concentration (H2O2eq.)
without without with without with
denuder denuder denuder denuder denuder
Gas phase O3 464 ppb 464 ppb∗ 150 nM 0 nM
NO2 500 ppb – 0 nM –
Particle SO24− 23.5 µg m−3 – −4.8 nM –
phase NO−3 228 µg m−3 – −3.5 nM –
SO24−+H2O2 23.5 µg m−3+115 nM – 105 nM –
NO−3+H2O2 228 µg m−3+115 nM – 110 nM –
SO24−+2-BP 23.5 µg m−3+272.5 nM – 272.5 nM –
∗Denuder was exposed for∼5 h.
tions than observed in Milan (Perrone et al., 2016). These measurements are then compared to cross-sensitivity tests of ∼1.38 µM SO24−and∼20 µM NO−3 with 115 nM H2O2and
272.5 nM 2-BP (Table 2).
Results show that the signals generated by injecting (NH4)2SO4 and NH4NO3 were on average lower than the
instrument background by −4.8 and −3.5 nM (H2O2eq.),
respectively. According to the reproducibility of the in-strument background discussed in Sect. 3.1.1, these differ-ences are not statistically significant. For the cross-sensitivity test, the fluorescence response of the SO24−–H2O2mixture
(23.5 µg m−3 SO24−+115 nM H2O2) and the NO−3–H2O2
mixture (228 µg m−3NO−3+115 nM H2O2)corresponded on
average to 105 and 110 nM H2O2 equivalent, respectively.
These deviations from the value measured for H2O2 alone
(115 nM) are not statistically different from zero (z score test, p value ∼0.7 for SO24− and NO−3), within our mea-surement precision (Sect. 3.1.2). The SO24−–2-BP mixture (23.5 µg m−3SO24−+272.5 nM 2-BP) also showed a similar result. We conclude from these tests that particulate SO24− and NO−3, the most abundant single particulate components, neither show any ROS signals nor influence the H2O2and
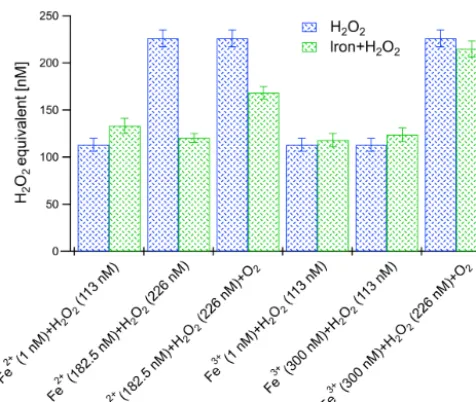
Figure 6. The relative fluorescence intensity during Fe2+ and Fe3+cross-sensitivity tests with H2O2. The blue bars represent the
premixed H2O2 concentrations, and the green bars represent the
[iron+H2O2] mixture concentrations. The error bars were
calcu-lated based on the instrument precision (see Sect. 3.1.2).
BP measurements and that the observed relationship between the secondary species and the ROS signals in ambient air is rather a correlation and not based on causation.
3.3.2 Transition metals
Transition metals may induce a response through redox cy-cling. Iron is one of the most abundant transition metals in the aerosol (Valko et al., 2005; Dall’Osto et al., 2016). However, potential iron-catalyzed ROS formation in an oxygen-rich environment has not yet been examined using a DCFH assay. In order to investigate the effect of metals on the ROS signal we conducted two experiments: (1) the analysis of the H2O2
reaction with DCFH in the presence of FeCl2 (anhydrous,
99.998 %, Sigma-Aldrich, USA) and FeCl3 (FeCl3·6H2O,
Sigma-Aldrich, USA) and (2) the analysis of the H2O2
sig-nal in the presence of ambient aerosols extracted from filter samples.
In the first set of experiments (shown in Fig. 6) the sig-nal of H2O2 measured alone was compared with that of a
mixed FeCl2–H2O2solution. At a concentration of 1 nM
sol-uble Fe2+in water, no influence on the ROS signal was ob-served within a standard deviation. The same procedure was then applied to H2O2(226 nM) combined with significantly
higher Fe2+ concentrations (182.5 nM). The fluorescence signals of the Fe2+–H2O2mixture, both with and without the
presence of dissolved O2, were significantly lower than the
signal when measuring H2O2alone. This might be due to the
consumption of a substantial amount of H2O2by Fe2+, for
the production of HO (Fe2++H2O2→Fe3++OH−+HO),
which will further react with H2O2 and result in the
fur-ther reduction of the H2O2 concentration (HO+H2O2→
H2O+HO2;HO2+H2O2→O2+H2O+HO) (Kolthoff and
Medalia, 1949). This indicates that concentrations of solu-ble Fe2+≤1 nM, which were obtained at ambient concen-trations of ≤10 ng m−3 soluble Fe2+ in the online instru-ment, will not influence the ROS measurement. However, in cases of high ambient soluble Fe2+ concentrations the ROS signal might be reduced, whereby this also depends on the H2O2 equivalent concentration. Measured ambient iron
concentrations were found to be in the range of tens to sev-eral thousands of ng m−3(Perrone et al., 2016; Oakes et al., 2012; Visser et al., 2015). Oakes et al. (2012) reported that water-soluble Fe(II) constitutes between 2.5 and 32 % of to-tal iron, resulting in a water-soluble Fe(II) concentration up to 30 ng m−3, which would be equivalent to∼2 nM in our online instrument. According to our first pair of experiments in Fig. 6 (1 nM Fe2+mixed with 113 nM H
2O2solution) this
would not suppress the ROS signal. Meanwhile, the H2O2–
Fe3+mixture signal was observed to be almost the same as the H2O2signal alone with and without the presence of O2,
which is in agreement with the findings of LeBel et al. (1992) and Keenan et al. (2009). These findings were further eval-uated below by examining the influence of genuine atmo-spheric particulate metals on the H2O2signal.
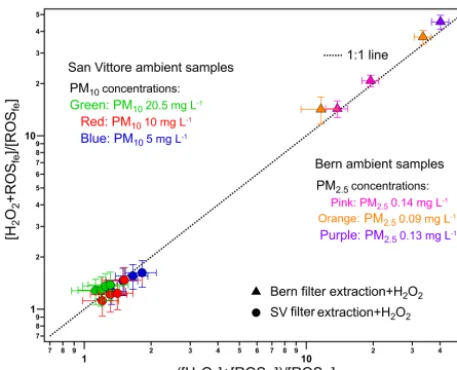
We then investigated whether the complex matrix of am-bient particles, which also include different forms of iron together with other metals, has an influence on ROS mea-surements. For this second set of experiments, ambient filter samples from a rural site in San Vittore (Switzerland) col-lected in January 2013 and an urban site located in Bern (Switzerland) collected in November 2014 were extracted and cross tested with H2O2. In San Vittore, three
concen-trations of PM10from one filter punch were prepared, while
in Bern three concentrations of PM2.5 from three different
filters were prepared. Figure 7 compares the fluorescence re-sponse of the filter-extract–H2O2 mixture with the sum of
the separately measured signals of the filter extract and of the H2O2. To account for the large differences in PM
con-centrations the signals were normalized to the signal of the filter extract. Results from both San Vittore and Bern lie on the 1:1 line within our errors. This indicates that at con-centrations relevant for the ambient atmosphere the complex matrix of ambient particles has no influence on ROS signals.
3.4 Assessment of ROS stability
J. Zhou et al.: Development, characterization and first deployment 75
Figure 7.Comparison of the filter extract (fe)–H2O2mixture with
the sum of the separately measured filter extract and H2O2
re-sponse, both normalized to the filter extract signal. [H2O2+ROSfe]
represents the fluorescence response of the filter-extract–H2O2 mix-ture; [H2O2] and [ROSfe] represent the fluorescence response of
H2O2 and the filter extracts alone. The symbols represent
ent locations of the samples collected. The colors represent differ-ent PM concdiffer-entrations based on the mass on the filter punch and assuming 100 % water solubility. H2O2concentrations mixed
to-gether with each PM concentration ranged from 56.5 to 113 nM and from 40 to 100 nM in Bern and San Vittore, respectively, which are also indicated indirectly on thexandyaxes. Error bars represent the propagated uncertainty from the measurements of [H2O2+ROSfe], [ROSfe] and [H2O2].
The smog chamber experiments and the online perfor-mance were described in Sect. 3.1.3. In addition to the online measurements, the particles from the chamber were collected on quartz filters (47 mm, Pall Corporation) at a flow rate of 26 L min−1for 30–32 min behind a charcoal denuder to re-move organic vapors. Primary particles were collected after injection of the emissions into the smog chamber and before the lights were turned on. Aged particles were collected af-ter around 1 and 4 h of aging. The filaf-ters were immediately stored at 253 K and analyzed∼2 years after the smog cham-ber experiments.
Ambient measurements were performed at an urban site located at the Institute of Anatomy of the University of Bern. A stainless steel cyclone (URG-2000-30ET, URG Corpora-tion) was operated at a constant flow rate of∼100 L min−1
to select particulate matter with an aerodynamic diameter < 2.5 µm. After size selection, particles were enriched using a versatile aerosol concentration enrichment system (VACES) (Kim, et al., 2001) and dried by passing through a diffusion dryer. Organic vapors were removed from the airstream using a charcoal denuder. The physicochemical properties of the aerosols were characterized using the online ROS analyzer, a scanning mobility particle sizer (SMPS, custom built) and
a quadrupole aerosol chemical speciation monitor (ACSM, Aerodyne Research Inc.) for the measurement of the non-refractory aerosol composition. Particle-bound ROS were al-ways measured downstream of the VACES due to the low ambient aerosol concentration while the other instruments measured ambient air most of the time. For offline quantifica-tion of particle-bound ROS, particles were periodically col-lected either up- or downstream of the VACES on Teflon fil-ters (47 mm Fluoropore membrane, 3.0 µm pore size, Merck Millipore, Molsheim, France) for at least 2 h. Prior to de-position on the filter, the sample flow was passed through a charcoal denuder removing oxidizing and organic gases. Sampling time was 3 h and filters were immediately stored at −20◦C. Filter punches were then extracted as described in Sect. 2.1.3 and analyzed for the ROS content∼1 year after sampling.
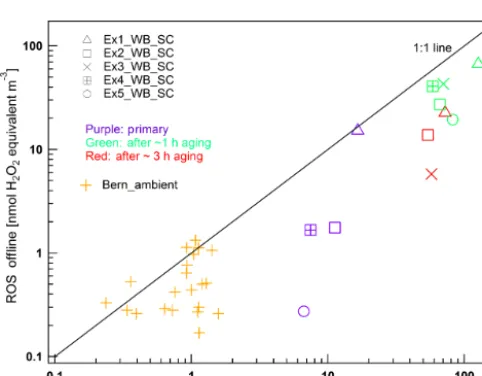
The ROS concentrations measured by the online and offline method from the wood combustion experiments and ambient air in Bern are compared in Fig. 8. We did not ob-serve a systematic difference between ROS concentrations on filters taken before and after the VACES compared with the online measurements. The ROS concentrations measured offline are on average 31 % lower than the online data in the Bern ambient measurements and on average 67 and 61 % lower than the online data for primary and secondary wood combustion samples, respectively. For the ambient measure-ments in Bern, a small number of measuremeasure-ments show agree-ment between the two methods indicating no ROS decay. A more detailed analysis is given in the following section to further explain the discrepancies of offline and online mea-surements.
3.4.2 ROS degradation
As ROS decay with time, we investigated the evolution of the particle-bound ROS over time by measuring ROS from filter samples taken during additional biomass combustion labora-tory experiments. The temperature of the filter samples was maintained at−20◦C, except during transport which lasted ∼3 h where the samples were packed at 0◦C using ice packs. As this might have an additional effect on the results, ROS lifetimes determined at−20◦C should be considered as the lowest estimates.
A pellet boiler was operated under two different condi-tions: high excess of combustion air (λ++)and lack of com-bustion air (λ−)(see Table 3). The emissions from the pellet boiler were sampled from the chimney through a heated line (473 K) and diluted by a factor of∼100–150 using two ejec-tor diluters in series (VKL10, Palas GmbH). The emissions were then aged in a PAM chamber to simulate photochem-ical aging of the emissions and assess the potential of sec-ondary organic aerosol (SOA) formation. The design and the use of the PAM chamber is described by Kang et al. (2007) and Bruns et al. (2015). Gas-phase O2and CO (using a
para-magnetic oxygen analyzer for O2 and a non-dispersive
Table 3.Short-lived and long-lived ROS fractions and parameters from the different experiments (Exndenotes the number of the experiment)
Filter Ex1 Ex2 Ex3 Ex4 Ex5 Ex6
λ1 1.31 (λ−) 3.25 (λ++) 3.33 (λ++) 3.18 (λ++) 3.16 (λ++) 3.36 (λ++)
MCE6 0.99 0.98 0.97 0.98 0.98 0.96
T (chamber,◦C) 37.9 37.9 37.9 39.8 39.8 39.8
RH (chamber, %) 18.6 24 24.5 20.9 20.9 20.9
OA2(µg m−3) 43.0 39.1 29.0 4.5 9.9 16.5
CH44,5(ppmv, norm) 0.017 0.16 0.16 0.027 0.087 0.13
CO4,5(ppmv, norm) 2.2 11.0 11.5 4.5 6.3 8.6
CO32,4,5(ppmv, norm) 375.5 391.5 381.1 210.8 212.13 203.0
NMVOCs4,5,7(ppm, norm) 0.04 0.74 0.78 0.13 0.45 0.6
Long-lived fraction (A2) 29.3±2.5 % 58.4±10.6 % 59.3±12.6 % 24.5±3.7 % 100±17.6 % 90.8±13.6 %
1Air fuel equivalence ratio (λ).λ=O
2,amb[%]/ (O2,amb[%]−O2,exh[%]), where O2,amband O2,exhare the oxygen contents in ambient air (O2,amb=21 %) and the one measured in the flue gas, respectively.2OA=primary OA+secondary OA.3Background corrected values.4All the concentrations of gas- and particle-phase compounds are after the PAM.5Norm indicates that concentrations are reported at 0◦C and 1013 mbar and normalized to a reference O2content of 13 %, xnorm=[speciesx]×λactual/λreference.6MCE=[CO2]/([CO2]+[CO]) (Ward and Radke, 1993).7Non-methane VOCs (NMVOCs)=VOC-CH4.
Figure 8. Comparison of online and offline measured ROS con-centrations in the city of Bern in winter and during wood combus-tion smog chamber experiments (Exn_WB_SC), including primary aerosol samples (purple) and secondary aerosol samples after aging for∼1 (green) and∼4 h (red). A deviation from the 1:1 line indi-cates a discrepancy between the online and offline method. Filters from the wood combustion experiments were analyzed 2 years after sampling, and those from ambient measurements were measured 1 year later.
frared, NDIR, analyzer for CO; Ultramat 23, Siemens), CO2
(NDIR analyzer, model LI-820, LI-COR®), as well as total volatile organic compounds, and CH4 (using a flame
ion-ization detector with a non-methane cutter; model 109A, J.U.M Engineering) were monitored in the hot, undiluted flue gas. In addition, non-methane volatile organic compounds (NMVOCs) as well as the OA, nitrate, ammonium and sulfate were measured after dilution using a proton transfer reaction mass spectrometer (PTR-MS, Ionicon) and a HR-ToF-AMS.
Aerosol filter samples were taken for∼30 min on Teflon fil-ters (47 mm Fluoropore membrane, 3.0 µm pore size, Merck Millipore) after the PAM chamber for ROS offline analy-ses. The filters were stored in the freezer from hours up to 4 months before the measurements of the ROS activity using the offline ROS setup (see Sect. 2.1.3).
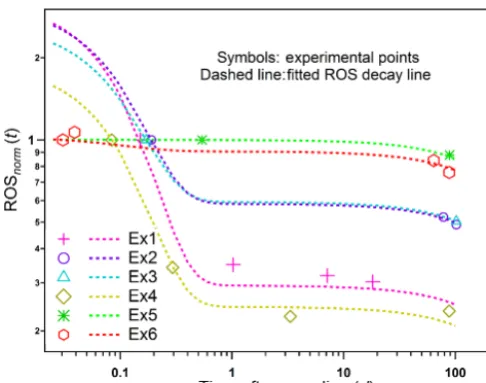
The measured ROS concentrations in SOA from the differ-ent wood combustion experimdiffer-ents exhibit a clear decrease with increasing filter storage duration (Fig. 9). In addition, this decay seems to follow a double exponential function. This indicates the presence of a short-lived fractionA1with
a decay constantπ1 =ln(2)/ T1and a long-lived fractionA2
with a decay constantπ2=ln(2)/ T2, where Ti represents the half-life. A biexponential decay function was applied to fit the experimental values, whereby the two decay constants are considered to be the same for all experiments:
ROSnorm(t )=A1·EXP(−π1·(t−t1))
+A2·EXP(−π2·(t−t1)) . (3)
HereA2,i=1-A1,i, 0≤A1,i,A2,i≤1, whereirefers to an experiment number; t is the time after sampling; andt1 is
the time when the first offline measurement was performed. ROSnorm(t )is the ROS measured at timetnormalized to the
ROS measured at timet1. The model parameters and their
respective uncertainties are shown in Table 3. Measured and modeled values are compared in Fig. 9.
The results show that the two ROS fractions have highly different reactivity. The final modeling yields
π1=9.68±2.56 and π2=0.0016±0.0019. The second
fraction (long lived) appears to be not reactive within our uncertainties and experimental timescales, as the associated reaction rate,π2, is not statistically different from 0. The
first fraction (short lived) is highly reactive, with a half-lifeT1≈1.7±0.4 h; similar reaction timescales and extents
J. Zhou et al.: Development, characterization and first deployment 77
Figure 9.Measured and modeled ROS decays in SOA from wood combustion emissions with increasing sample storage duration for six experiments (Exn). The symbols and dashed lines represent measured and modeled values, respectively. ROSnorm(t )is the ROS
measured at timetnormalized to the ROS measured when the first offline measurement was performed at timet1. More information
about the experiments can be found in Table 3. The very good agree-ment between measured and modeled ROS can be seen in Fig. S4.
al., 2016). The uncertainty analysis suggests that we are ca-pable of determining the reaction rate of reactive ROS, but not that of the long-lived ROS. The fraction of the long-lived ROS (A2,i) could be determined with acceptable errors of 20 %. The main aim of the model is to show that the fraction of unstable ROS may vary significantly between experiments but could be as high as 75 %, which highlights the need for an online ROS measurement technique. This variability in the contribution of the unstable ROS fraction could be related to the burning conditions in this study (shown in Fig. S5).
The model considers ROS to be composed of two compo-nents with different decay rates. However, we do expect that the OA contains the spectrum of ROS with a wide range of reactivities. The model is thus a simplification of the ROS in the aerosol. Another simplification is that the decay rates of these two ROS components are considered to be the same between experiments. This may explain the reasons behind the high uncertainties in determining the rates, but does not have a significant effect on the determination of the contri-butions of the two fractions,A1,i andA2,i. We also note that the decay rates and the ROS fractions determined from our results are specific for biomass burning SOA and cannot be extrapolated to other systems.
To understand the variability in the contributions of the long-lived and unstable ROS fractions of different experi-ments, the long-lived fraction of ROS was compared with various wood combustion parameters. No correlation was found with λ, CO, CO2 and NMVOCs (defined in Table 3)
nor with specific gas-phase families, e.g., polycyclic aro-matic hydrocarbons, furans, oxygenated aroaro-matics, and N-containing or O-N-containing compounds. However, as shown in Fig. S5 the fraction of long-lived ROS seems to be neg-atively correlated with the modified combustion efficiency (MCE) and the total OA mass present in the chamber (with Ex4 as an exception). These results might indicate that the composition of ROS formed from photo-oxidation of wood combustion emissions depends on the combustion condi-tions. As semivolatile organic compounds have a higher chance to condense to the particle phase with increasing OA concentration, the anticorrelation of the long-lived fraction of ROS with OA concentration suggests that the more oxi-dized and low-volatility ROS tend to have longer lifetimes than the less oxidized and higher-volatility ROS. However, this would be in contradiction to Krapf et al. (2016), who concluded the highly oxygenated compounds to be unstable. The results presented here are preliminary and need to be further evaluated by more experiments.
Estimations of ROS lifetimes were done previously. ROS measured in oxidized oleic acid particles were separated into short- and long-lived species with a half-life of a few minutes and hours to days, respectively (Fuller et al., 2014). Chen et al. (2011) determined a ROS half-life of 6.5 h in oxidized organic aerosols. Krapf et al. (2016) showed that more than 60 % of peroxides contained in SOA fromα-pinene ozonol-ysis decayed with a short half-life of 45 min.
To compare the ROS online measurement with immediate offline measurements, 2,6-dimethoxyphenol was used as a precursor and aged in the PAM chamber. SOA was then sam-pled on a Teflon filter (47 mm Fluoropore membrane, 3.0 µm pore size, Merck Millipore) at a flow rate of 1.7 L min−1for
∼1 h after passing through a similar charcoal denuder as ap-plied for the online measurements. The filter was then mea-sured directly after sampling. Results showed that the offline measurement was 40 % lower than the online measurement, indicating that already without significant sample storage du-ration the short-lived ROS fraction was lost in the offline methodology. This is in agreement with Fuller et al. (2014) and Krapf et al. (2016), who showed that a larger fraction of ROS in fresh SOA decays within tens of minutes.
As a summary of the ROS decay behavior in aerosols from Bern ambient and wood combustion experiments, a normal-ized frequency distribution of the ROS decay percentage of different sources is plotted in Fig. S6. The decay percentage of ROS was calculated as follows:
ROSdecay percentage= ROS
online−ROSoffline
ROSonline
×100 %. (4) The normalized frequency of a specified ROS decay percent-age was then calculated as the ratio of the number of experi-ments yielding a certain decay percentage normalized to the number of total experiments. From Fig. S6 we conclude that the most frequently occurring ROS decay percentages were 40–80 % in wood combustion experiments, whereby aging
in the smog chamber and PAM chamber yielded similar re-sults. Similarly, around 60 % of ROS decayed in the majority of all the 27 ambient samples collected in Bern. Overall, the offline method underestimates the ROS content due to the degradation of short-lived ROS prior to filter analysis. The comparison of online and offline ROS measurements from ambient and wood combustion smog chamber experiments indicates that on average 60±20 % of ROS decayed during filter storage and handling, highlighting the importance of online measurements.
4 Conclusions
In this study, a modified online and offline ROS analyzer was presented and characterized. The major improvements compared to previous studies (Fuller et al., 2014; Huang et al., 2016; Wang et al., 2011; King et al., 2013) to op-timize the analysis were as follows: (1) degassing of the water and PBS to prepare the working solutions; (2) sep-aration of DCFH and peroxidase working solutions, which were then mixed just before reaction with the sample solu-tion; and (3) no ultrasonic filter extraction for offline anal-ysis. All these efforts resulted in an instrument LOD of 2 nmol m−3 and 1.3 nmol L−1for online and offline analy-sis, respectively. The method LOD of the offline analysis was 18 nmol L−1based on the variability of the filter blanks and preparation of the solutions, respectively. The online in-strument accuracy in determining the ROS concentration was found to be 3 %, and the instrument precision (repeatability) was 25, 10 and 5 % at 30, 70 and 150 nM, respectively. The reproducibility of the instrument sensitivity was∼40 % due to solution preparation and instrument operation; thus, a cal-ibration is needed for each experiment and new batch of WS. As shown with model organic compounds only peracetic acid was quantitatively measured, while large organic per-oxides or those with bulky functional groups (i.e.,tert-butyl and phenyl) strongly reduced the fluorescence response of the DCFH assay. Potential interferences from gas-phase O3
and NO2 were not observed and matrix effects of
particu-late SO24−and NO−3 were not statistically significant. While Fe3+ does not show a detectable interference, high soluble Fe2+concentrations present in ambient aerosol could reduce the ROS signal.
Both online and offline measurements with the analyzer were performed in field and laboratory experiments. ROS concentrations from offline field measurements showed a lin-ear relationship with increasing ambient particle concentra-tions. Smog chamber aging experiments of wood combus-tion emissions revealed a high initial ROS content in SOA, which then strongly decreased with OH exposure. Generally, ROS decayed with increasing filter storage duration. Due to the degradation of the highly reactive ROS fraction, the of-fline method generally underestimates the ROS concentra-tion on average by 60±20 %. From the decay behavior, ROS
in SOA can be separated into two categories: a short-lived or highly reactive fraction with a half-life of∼1.7 h and long-lived or less reactive species. Consequently, to obtain a better estimate of the real ROS concentration in the ambient air or in simulation chamber experiments, a fast online method as presented in this study is advantageous.
Data availability. Data related to this article are available online at https://zenodo.org/record/1118968#WjkuTk2WxmM.
The Supplement related to this article is available online at https://doi.org/10.5194/amt-11-65-2018-supplement.
Competing interests. The authors declare that they have no conflict of interest.
Acknowledgements. This study was financially supported by the Swiss National Science Foundation (NRP 70 “Energy Turnaround”) and the China Scholarship Council (CSC) under grant agreement no. 201007040040. The research leading to these results also received funding from the European Community’s Seventh Framework Programme (FP7/2007–2013) under grant agreement no. 290605 (PSI-FELLOW) and from the Compe-tence Center Environment and Sustainability (CCES; project OPTIWARES). The authors thank Maria Grazia Perrone and Manuel Krapf for providing the ambient filters, Mao Xiao for the helpful discussions, and René Richter and Günther Wehrle for their competent technical advice, as well as Samuel Brown, Ilaria Gavarini, Laure-Estelle Cassagnes and Deepika Bhattu for their support in the lab.
Edited by: Francis Pope
Reviewed by: two anonymous referees
References
Berglund, G. I., Carlsson, G. H., Smith, A. T., Szoke, H., Henriksen, A., and Hajdu, J.: The catalytic pathway of horseradish peroxi-dase at high resolution, Nature, 417, 463–468, 2002.
Bruns, E. A., El Haddad, I., Keller, A., Klein, F., Kumar, N. K., Pieber, S. M., Corbin, J. C., Slowik, J. G., Brune, W. H., Bal-tensperger, U., and Prévôt, A. S. H.: Inter-comparison of lab-oratory smog chamber and flow reactor systems on organic aerosol yield and composition, Atmos. Meas. Tech., 8, 2315– 2332, https://doi.org/10.5194/amt-8-2315-2015, 2015.
J. Zhou et al.: Development, characterization and first deployment 79 Bruns, E. A., Slowik, J. G., El Haddad, I., Kilic, D., Klein, F.,
Dommen, J., Temime-Roussel, B., Marchand, N., Baltensperger, U., and Prévôt, A. S. H.: Characterization of gas-phase organics using proton transfer reaction time-of-flight mass spectrometry: fresh and aged residential wood combustion emissions, Atmos. Chem. Phys., 17, 705–720, https://doi.org/10.5194/acp-17-705-2017, 2017.
Chen, X., Hopke, P. K., and Carter, W. P. L.: Secondary organic aerosol from ozonolysis of biogenic volatile organic compounds: Chamber studies of particle and reactive oxygen species forma-tion, Environ. Sci. Technol., 45, 276–282, 2011.
Daellenbach, K. R., Stefenelli, G., Bozzetti, C., Vlachou, A., Fermo, P., Gonzalez, R., Piazzalunga, A., Colombi, C., Canonaco, F., Hueglin, C., Kasper-Giebl, A., Jaffrezo, J.-L., Bianchi, F., Slowik, J. G., Baltensperger, U., El-Haddad, I., and Prévôt, A. S. H.: Long-term chemical analysis and organic aerosol source apportionment at nine sites in central Europe: source identification and uncertainty assessment, Atmos. Chem. Phys., 17, 13265–13282, https://doi.org/10.5194/acp-17-13265-2017, 2017.
Dall’Osto, M., Beddows, D. C. S., Harrison, R. M., and Onat, B.: Fine iron aerosols are internally mixed with nitrate in the urban European atmosphere, Environ. Sci. Technol. 50, 4212–4220, 2016.
Deneke, S. M., Baxter, D. F., Phelps, D. T., and Fanburg, B. L.: Increase in endothelial cell glutathione and precursor amino acid uptake by diethyl maleate and hyperoxia, Am. J. Physiol., 257, https://doi.org/10.1152/ajplung.1989.257.4.L265, 1989. Devasagayam, T. P., Tilak, J. C., Boloor, K. K., Sane, K. S.,
Ghaskadbi, S. S., and Lele, R. D.: Free radicals and antioxidants in human health: current status and future prospects, J. Assoc. Physician. I., 52, 794–804, 2004.
Donaldson, K., Brown, D., Clouter, A., Duffin, R., MacNee, W., Renwick, L., Tran, L., and Stone, V.: The pulmonary toxicology of ultrafine particles, J. Aerosol Med., 15, 213–220, 2002. Fang, T., Verma, V., Guo, H., King, L. E., Edgerton, E. S., and
Weber, R. J.: A semi-automated system for quantifying the ox-idative potential of ambient particles in aqueous extracts us-ing the dithiothreitol (DTT) assay: results from the Southeast-ern Center for Air Pollution and Epidemiology (SCAPE), At-mos. Meas. Tech., 8, 471–482, https://doi.org/10.5194/amt-8-471-2015, 2015.
Fuller, S. J., Wragg, F. P. H., Nutter, J., and Kalberer, M.: Compar-ison of on-line and off-line methods to quantify reactive oxygen species (ROS) in atmospheric aerosols, Atmos. Environ., 92, 97– 103, 2014.
Huang, W., Zhang, Y., Zhang, Y., Fang, D., and Schauer, J. J.: Op-timization of the measurement of particle-bound reactive oxy-gen species with 20,70-dichlorofluorescin (DCFH), Water Air Soil Pollut., 227, 2016.
Ingham, D. B.: Diffusion of aerosols from a stream flowing through a cylindrical tube, J. Aerosol Sci., 6, 125–132, 1975.
Kang, E., Root, M. J., Toohey, D. W., and Brune, W. H.: Introduc-ing the concept of Potential Aerosol Mass (PAM), Atmos. Chem. Phys., 7, 5727–5744, https://doi.org/10.5194/acp-7-5727-2007, 2007.
Kao, M. C. and Wang, C. S.: Reactive oxygen species in intense smoke, Aerosol Air Qual. Res., 2, 61–69, 2002.
Keenan, C. R., Goth-Goldstein, R., Lucas, D., and Sedlak, D. L.: Oxidative stress induced by zero-valent iron nanoparticles and Fe(II) in human bronchial epithelial cells, Environ. Sci. Technol., 43, 4555–4560, 2009.
Khurshid, S. S., Siegel, J. A., and Kinney, K. A.: Techni-cal Note: Particulate reactive oxygen species concentrations and their association with environmental conditions in an ur-ban, subtropical climate, Atmos. Chem. Phys., 14, 6777–6784, https://doi.org/10.5194/acp-14-6777-2014, 2014.
Kim, S., Jaques, P. A., Chang, M., Froines, J. R., and Sioutas, C.: Versatile aerosol concentration enrichment system (VACES) for simultaneous in vivo and in vitro evaluation of toxic effects of ultrafine, fine and coarse ambient particles Part I: Development and laboratory characterization, J. Aerosol Sci., 32, 1281–1297, 2001.
King, L. E. and Weber, R. J.: Development and testing of an online method to measure ambient fine particu-late reactive oxygen species (ROS) based on the 20,70 -dichlorofluorescin (DCFH) assay, Atmos. Meas. Tech., 6, 1647– 1658, https://doi.org/10.5194/amt-6-1647-2013, 2013.
Kolthoff, I. M. and Medalia, A. I.: The reaction between ferrous iron and peroxides. I. reaction with hydrogen peroxide in the absence of oxygen, J. Am. Chem. Soc., 71, 3777–3783, 1949.
Krapf, M., Haddad, I. E., Bruns, E. A., Molteni, U., Daellenbach, K. R., Prévôt, A. S. H., Baltensperger, U., and Dommen, J.: Labile peroxides in secondary organic aerosol, Chem, 1, 603–616, 2016. LeBel, C. P., Ischiropoulos, H., and Bondy, S. C.: Evaluation of the probe 20,70-dichlorofluorescin as an indicator of reactive oxygen species formation and oxidative stress, Chem. Res. Toxicol., 5, 227–231, 1992.
Long, G. L. and Winefordner, J. D.: Limit of detection a closer look at the IUPAC definition, Anal. Chem., 55, 712A–724A, 1983. Mark, G., Tauber, A., Laupert, R., Schuchmann, H.-P., Schulz,
D., Mues, A., and von Sonntag, C.: OH-radical formation by ultrasound in aqueous solution – Part II: Terephthalate and Fricke dosimetry and the influence of various conditions on the sonolytic yield, Ultrason. Sonochem., 5, 41–52, 1998.
Miljevic, B., Hedayat, F., Stevanovic, S., Fairfull-Smith, K. E., Bot-tle, S. E., and Ristovski, Z. D.: To sonicate or not to sonicate PM filters: Reactive oxygen species generation upon ultrasonic irradiation, Aerosol Sci. Technol., 48, 1276–1284, 2014. Oakes, M., Weber, R. J., Lai, B., Russell, A., and Ingall, E. D.:
Characterization of iron speciation in urban and rural single par-ticles using XANES spectroscopy and micro X-ray fluorescence measurements: investigating the relationship between speciation and fractional iron solubility, Atmos. Chem. Phys., 12, 745–756, https://doi.org/10.5194/acp-12-745-2012, 2012.
Perrone, M. G., Zhou, J., Malandrino, M., Sangiorgi, G., Rizzi, C., Ferrero, L., Dommen, J., and Bolzacchini, E.: PM chemical com-position and oxidative potential of the soluble fraction of parti-cles at two sites in the urban area of Milan, Northern Italy, At-mos. Environ., 128, 104–113, 2016.
Pope, C. A. and Dockery, D. W.: Health effects of fine particulate air pollution: lines that connect, J. Air Waste Manage.Assoc., 56, 709–742, 2006.
Rota, C., Chignell, C. F., and Mason, R. P.: Evidence for free radical formation during the oxidation of 20-70-dichlorofluorescin to the fluorescent dye 20-70-dichlorofluorescein by horseradish
dase:: Possible implications for oxidative stress measurements, Free Radical Biol. Med., 27, 873–881, 1999a.
Rota, C., Fann, Y. C., and Mason, R. P.: Phenoxyl free radical formation during the oxidation of the fluorescent dye 20,70 -dichlorofluorescein by horseradish peroxidase: possible conse-quences for oxidative stress measurements, J. Biol. Chem., 274, 28161–28168, 1999b.
Sagai, M., Saito, H., Ichinose, T., Kodama, M., and Mori, Y.: Bio-logical effects of diesel exhaust particles – I. In vitro production of superoxide and in vivo toxicity in mouse, Free Radical Biol. Med., 14, 37–47, 1993.
Sauvain, J.-J., Rossi, M. J., and Riediker, M.: Comparison of three acellular tests for assessing the oxidation potential of nanomate-rials, Aerosol Sci. Technol., 47, 218–227, 2013.
Takeuchi, M., Ullah, S. M. R., Dasgupta, P. K., Collins, D. R., and Williams, A.: Continuous collection of soluble atmospheric par-ticles with a wetted hydrophilic Filter, Anal. Chem., 77, 8031– 8040, 2005.
Valko, M., Morris, H., and Cronin, M. T. D.: Metals, Toxicity and oxidative stress, Curr. Med. Chem., 12, 1161–1208, 2005. Venkatachari, P., Hopke, P. K., Brune, W. H., Ren, X., Lesher, R.,
Mao, J., and Mitchell, M.: Characterization of wintertime re-active oxygen species concentrations in Flushing, New York, Aerosol Sci. Technol., 41, 97–111, 2007.
Venkatachari, P., Hopke, P. K., Grover, B. D., and Eatough, D. J.: Measurement of particle-bound Reactive oxygen species in Ru-bidoux aerosols, J. Atmos. Chem., 50, 49–58, 2005.
Visser, S., Slowik, J. G., Furger, M., Zotter, P., Bukowiecki, N., Canonaco, F., Flechsig, U., Appel, K., Green, D. C., Tremper, A. H., Young, D. E., Williams, P. I., Allan, J. D., Coe, H., Williams, L. R., Mohr, C., Xu, L., Ng, N. L., Nemitz, E., Barlow, J. F., Halios, C. H., Fleming, Z. L., Baltensperger, U., and Prévôt, A. S. H.: Advanced source apportionment of size-resolved trace el-ements at multiple sites in London during winter, Atmos. Chem. Phys., 15, 11291–11309, https://doi.org/10.5194/acp-15-11291-2015, 2015.
Wang, Y., Hopke, P. K., Sun, L., Chalupa, D. C., and Utell, M. J.,: Laboratory and field testing of an automated atmospheric particle-bound reactive oxygen species sampling-analysis sys-tem, J. Toxicol., 2011, 419–476, 2011.
Ward, D. E. and Radke, L. F.: Emission measurements from vege-tation fires: A comparative evalution of methods and results, in: Fire in the Environment: The Ecological, Atmospheric and Cli-matic Importance of Vegetation Fires, edited by: Crutzen, P. J. and Goldammer, J. G., John Wiley, Chichester UK, 1993. WHO: Health Effects of Particulate Matter, Word Health
Organiza-tion, Geneva, 2013.
Wragg, F. P. H., Fuller, S. J., Freshwater, R., Green, D. C., Kelly, F. J., and Kalberer, M.: An automated online instrument to quan-tify aerosol-bound reactive oxygen species (ROS) for ambient measurement and health-relevant aerosol studies, Atmos. Meas. Tech., 9, 4891–4900, https://doi.org/10.5194/amt-9-4891-2016, 2016.
Zhao, J. and Hopke, P. K.: Concentration of reactive oxygen species (ROS) in mainstream and sidestream cigarette smoke, Aerosol Sci. Technol., 46, 191–197, 2012.
Zhao, J. and Riediker, M.: Detecting the oxidative reactivity of nanoparticles: a new protocol for reducing artifacts, J. Nanopart. Res., 16, 2493, https://doi.org/10.1007/s11051-014-2493-0, 2014.