https://doi.org/10.5194/amt-12-6125-2019 © Author(s) 2019. This work is distributed under the Creative Commons Attribution 4.0 License.
Retrieval of atmospheric CH
4
vertical information from
ground-based FTS near-infrared spectra
Minqiang Zhou1, Bavo Langerock1, Mahesh Kumar Sha1, Nicolas Kumps1, Christian Hermans1, Christof Petri2, Thorsten Warneke2, Huilin Chen3, Jean-Marc Metzger4, Rigel Kivi5, Pauli Heikkinen5, Michel Ramonet6, and Martine De Mazière1
1Royal Belgian Institute for Space Aeronomy (BIRA-IASB), Brussels, Belgium 2Institute of Environmental Physics, University of Bremen, Bremen, Germany
3Centre for Isotope Research (CIO), Energy and Sustainability Research Institute Groningen (ESRIG), University of Groningen, Groningen, the Netherlands
4UMS 3365 – OSU Réunion, Université de La Réunion, Saint-Denis, Réunion, France 5Finnish Meteorological Institute, Space and Earth Observation Centre, Sodankylä, Finland
6Laboratoire des Sciences du Climat et de l’Environnement (LSCE/IPSL), UMR CEA-CNRS-UVSQ, Gif-sur-Yvette, France Correspondence:Minqiang Zhou ([email protected])
Received: 11 March 2019 – Discussion started: 23 April 2019
Revised: 13 September 2019 – Accepted: 28 October 2019 – Published: 25 November 2019
Abstract. The Total Carbon Column Observing Network (TCCON) column-averaged dry air mole fraction of CH4 (XCH4) measurements have been widely used to validate satellite observations and to estimate model simulations. The GGG2014 code is the standard TCCON retrieval software used in performing a profile scaling retrieval. In order to ob-tain several vertical pieces of information in addition to the total column, in this study, the SFIT4 retrieval code is ap-plied to retrieve the CH4mole fraction vertical profile from the Fourier transform spectrometer (FTS) spectrum at six sites (Ny-Ålesund, Sodankylä, Bialystok, Bremen, Orléans and St Denis) during the time period of 2016–2017. The retrieval strategy of the CH4profile retrieval from ground-based FTS near-infrared (NIR) spectra using the SFIT4 code (SFIT4NIR) is investigated. The degree of freedom for sig-nal (DOFS) of the SFIT4NIR retrieval is about 2.4, with two distinct pieces of information in the troposphere and in the stratosphere. The averaging kernel and error budget of the SFIT4NIR retrieval are presented. The data accuracy and precision of the SFIT4NIR retrievals, including the to-tal column and two partial columns (in the troposphere and stratosphere), are estimated by TCCON standard retrievals, ground-based in situ measurements, Atmospheric Chemistry Experiment – Fourier Transform Spectrometer (ACE-FTS) satellite observations, TCCON proxy data and AirCore and
aircraft measurements. By comparison against TCCON stan-dard retrievals, it is found that the retrieval uncertainty of SFIT4NIRXCH4 is similar to that of TCCON standard re-trievals with systematic uncertainty within 0.35 % and ran-dom uncertainty of about 0.5 %. The tropospheric and strato-sphericXCH4from SFIT4NIR retrievals are assessed by com-parison with AirCore and aircraft measurements, and there is a 1.0±0.3 % overestimation in the SFIT4NIR tropospheric XCH4 and a 4.0±2.0 % underestimation in the SFIT4NIR stratosphericXCH4, which are within the systematic uncer-tainties of SFIT4NIR-retrieved partial columns in the tropo-sphere and stratotropo-sphere respectively.
1 Introduction
bias is not taken into account. It is assumed that the remain-ing systematic uncertainty of the TCCONXCH4 products is within 0.2 %. The random uncertainty of theXCH4 retrieval is about 0.5 % (Wunch et al., 2015). TCCON XCH4 obser-vations have relatively larger footprints compared to surface in situ measurements, and thus could provide flux informa-tion on a regional scale (Wunch et al., 2016). TCCONXCH4 measurements are widely used to validate the satellite obser-vations, e.g. the Scanning Imaging Absorption Spectrome-ter for Atmospheric Chartography (SCIAMACHY) and the Thermal And Near-infrared Sensor for carbon Observation Fourier-Transform Spectrometer (TANSO-FTS; Houweling et al., 2014; Dils et al., 2014; Zhou et al., 2016). In addition, the TCCONXCH4 observations are also used to evaluate at-mosphere chemistry transport model simulations (Saito et al., 2012; Fraser et al., 2013; Agusti-Panareda et al., 2017).
The concentration of atmospheric CH4 remained almost constant from about 1995 to 2006. However, after 2007, the CH4concentration started to increase with an annual growth rate about 0.7 ppb yr−1(Rigby et al., 2008). The CH4in the atmosphere is released from gas and oil, coal, landfills, ru-minant animals, rice agriculture, biomass burning, wetlands and lakes. The CH4 in the troposphere is removed mainly by oxidation with hydroxyl radicals (OH), partly by absorp-tion in the soil and party by reacting with chlorine radicals in the marine boundary layer. The CH4in the stratosphere is removed by oxidation with OH, chlorine atoms and excited oxygen atoms (IPCC, 2013). The mole fraction of CH4 de-creases rapidly with altitude above the tropopause due to a higher photolysis rate in the stratosphere (Ehhalt and Heidt, 1973). The separation of the tropospheric and stratospheric CH4 partial columns helps us to better understand the at-mospheric CH4variability and to comprehensively evaluate model simulations (Ostler et al., 2016; Saad et al., 2016; Wang et al., 2017). The seasonal variation of CH4in the tro-posphere is dominated by its source and sink as well as the horizontal transport, while the seasonal variation of CH4in the stratosphere is strongly affected by the Brewer–Dobson circulation, vertical transport, intertropical convergence zone movement and stratospheric chemical reactions. A proxy method to derive the tropospheric and stratospheric XCH4
cessities of integrated Global Observations (RINGO) project. The full-physics SFIT4 retrieval code is based on the opti-mal estimation method (Rodgers, 2000), which is an updated version of SFIT2 (Pougatchev et al., 1995) and commonly used in the Network for the Detection of Atmospheric Com-position Change – the Infrared Working Group (NDACC-IRWG; De Mazière et al., 2018). The TCCON sites and the SFIT4NIR retrieval strategy are introduced in the next sec-tion. The objective behind this study is to retrieve vertical information of CH4from TCCON spectra. In Sect. 3 the dif-ference inXCH4 retrieved using the SFIT4NIR to theXCH4 retrieved from the standard TCCON retrievals is investigated. The tropospheric and the stratospheric XCH4 retrieved us-ing the SFIT4NIR retrievals are compared with other avail-able data sets, such as ground-based in situ measurements, Atmospheric Chemistry Experiment – Fourier Transform Spectrometer (ACE-FTS) satellite observations and TCCON proxy data. Furthermore, the comparison results from the SFIT4NIR retrievals relative to the AirCore and aircraft pro-files are also discussed in this section. Finally, conclusions are drawn in Sect. 4.
2 Data and method
2.1 TCCON sites
Table 1.The coordinates and the altitudes (m a.s.l.) of the TCCON FTS sites used in this study.
Site Latitude Longitude Altitude (m a.s.l.) Reference
Ny-Ålesund 78.9◦N 11.9◦E 20 Notholt et al. (2017)
Sodankylä 67.4◦N 26.6◦E 188 Kivi et al. (2014)
Bialystok 53.2◦N 23.0◦E 180 Deutscher et al. (2014)
Bremen 53.1◦N 8.8◦E 30 Notholt et al. (2014)
Orléans 48.0◦N 2.1◦E 130 Warneke et al. (2014)
St Denis (Reunion Island) 21.0◦S 55.4◦E 87 De Mazière et al. (2014)
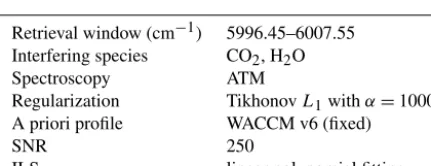
Table 2.Lists of the most important parameters in the SFIT4NIR retrieval strategy.
Retrieval window (cm−1) 5996.45–6007.55 Interfering species CO2, H2O
Spectroscopy ATM
Regularization TikhonovL1withα=1000 A priori profile WACCM v6 (fixed)
SNR 250
ILS linear polynomial fitting
2.2 SFIT4NIR retrieval strategy
The SFIT4NIR retrieval strategy is investigated based on the TCCON spectra at St Denis (a humid site) using the SFIT4_v9.4.4 retrieval code. After that, the optimized re-trieval strategy is applied for other sites. The key param-eters used in the SFIT4NIR retrieval are listed in Table 2. The atmospheric line list (ATM) used in the GGG2014 code (Toon, 2014) has also been used in the forward model of the SFIT4NIR. Linear polynomial fitting is applied to a time-domain ideal instrument line shape (ILS) and the parameters are retrieved simultaneously. The a priori ILS is set as the ideal ILS. Since the Bruker 125HR spectrometers exhibit ex-cellent ILS stability, the retrieved ILS are very constant and the retrieved maximal variations for modulation efficiency (ME) amplitude are within 2 % at these six sites. A detailed description of the retrieval settings, the averaging kernel and the retrieval uncertainty are presented in Sect. 2.2.1–2.2.5.
2.2.1 Retrieval window
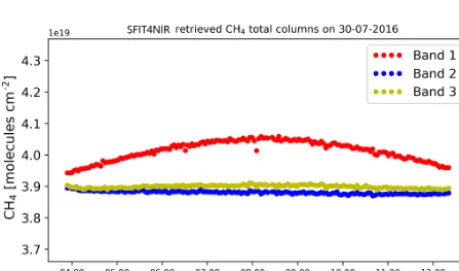
Three windows listed in Table 3 are used to retrieve CH4total column values using the GGG2014 code. All these retrieval windows were tested with SFIT4NIR retrieval. The typical transmittance and residual for the three windows are shown in Fig. 1. The root mean square (RMS) of the residual in Band 1 is largest due to a bad fitting of several strong H2O absorption lines. The RMS of the residual in Band 2 is the lowest and is slightly better than that in Band 3. As an exam-ple, the retrieved CH4total columns using these three bands on 30 July 2016 are shown in Fig. 2. A clearly artificial sym-metric variation for Band 1 is seen, which is probably due
Table 3.The retrieval windows used in the GGG2014 code.
Window (cm−1) Width (cm−1) Interfering spices
Band 1 5781.0–5897.0 116.0 CO2, H2O, N2O Band 2 5996.45–6007.55 11.1 CO2, H2O Band 3 6007.0–6145.0 138.0 CO2, H2O
to a bad fitting of the spectra. The results from Band 2 and 3 are similar. The difference between the retrieved CH4total columns from Band 2 and 3 are within 0.3±0.1 %. As Band 2 has the best fitting, it is selected as the retrieval window for our SFIT4NIR retrieval.
2.2.2 A priori profile
According to the optimal estimation method (OEM; Rodgers, 2000), an a priori profile is used to initialize the iteration during a retrieval process. In this study, SFIT4NIR uses the mean of the monthly profiles between 1980 and 2020 from the Whole Atmosphere Community Climate Model (WACCM) version 6 as the a priori profiles for CH4and CO2, while an H2O a priori profile is derived from the 6-hourly NCEP reanalysis data because of its high variability in the atmosphere.
2.2.3 Regularization
The retrieved CH4profile can be written as
xr,CH4=xa,CH4+A(xt,CH4−xa,CH4)+ε, (1)
A=(KTS−ε1K+Sa−1)−1KTS−ε1K, (2) wherexa,CH4,xt,CH4 andxr,CH4 are the a priori, true and re-trieved CH4mole fraction profiles respectively.Ais the aver-aging kernel, representing the sensitivity of the retrieved CH4 profile to the true atmosphere status. The trace ofAis the de-gree of freedom for signal (DOFS), indicating the number of individual vertical information derived from the retrieval.K
Figure 1.The transmittances of the species and solar lines in three bands from a typical spectrum at St Denis, together with the residual (observation–fitting). The transmittance of each component is shifted by 0.02 to better identify different species and the solar lines (sol).
Figure 2.The SFIT4-retrieved CH4total columns using the three bands listed in Table 1 on 30 July 2016 (184 spectra).
retrieved CH4profile is mainly from the a priori information or from the measurement information. It is assumed thatSε is a diagonal matrix, where the diagonal elements are the in-verse square of the SNR. The SNR of spectra is set to 250 at all the TCCON sites.S−a1is created using the TikhonovL1 method (Tikhonov, 1963):
S−a1=αLT1TL1∈R(n,n), (3)
whereL1=
−1 1 0 . . . 0 0
0 −1 1 . . . 0 0
..
. ... ... . .. ... ...
0 0 0 . . . −1 1
,
T=diag(1h2), where1his the thickness of each layer, and regularization strengthαis the key parameter to determine the correlation strength among layers.
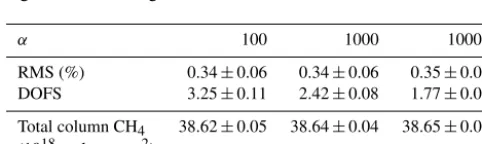
The optimizedαvalue is chosen by extracting maximum possible information from the measurement while eliminat-ing the artificial oscillation for the retrieved CH4 profiles. Severalαvalues are tested using the spectra on 30 July 2016, and the RMS, DOFS and retrieved CH4 total columns are listed in Table 4, along with the retrieved CH4vertical pro-files in Fig. 3. The retrieved CH4profile shows a strong os-cillation in the troposphere forα=100. The vertical profiles are similar forα=1000 andα=10 000, but they allow us to get a smaller RMS withα=1000. In summary, a regular-ization strength (α) of 1000 with the DOFS of about 2.4 is selected as the best choice for the SFIT4NIR retrieval.
2.2.4 Averaging kernel
Figure 3.The SFIT4NIR a priori and the retrieved CH4vertical profiles(a), together with the ratios of the retrieved profiles to the a priori profile(b), with different regularization strengthαvalues.
Table 4.The mean and standard deviation of RMS, DOFS and re-trieved CH4total columns from SFIT4NIR retrievals using different regularization strengthαvalues.
α 100 1000 10000
RMS (%) 0.34±0.06 0.34±0.06 0.35±0.06 DOFS 3.25±0.11 2.42±0.08 1.77±0.04
Total column CH4 38.62±0.05 38.64±0.04 38.65±0.04 (1018molec. cm−2)
(about 40 km). The AVK shows that the SFIT4NIR-retrieved profile contains independent information in the troposphere and in the stratosphere (DOFS close to 1.0 for these two lay-ers). In addition, the column-averaging kernels (right panel in Fig. 4) indicate that the retrieved CH4total column has a good sensitivity in the whole atmosphere, with a value close to 1.0 at all altitudes. The column-averaging kernels slightly vary with the SZAs, which is more constant than the AVK variability for the SZAs of the standard TCCON products (see Fig. 4 in Wunch et al., 2011).
2.2.5 Error budget
According to the OEM (Rodgers, 2000), the measurement uncertainty of the SFIT4NIR retrieval (ε in Eq. 1) is esti-mated from three components: the smoothing error covari-ance matrix (Ss), the forward model parameter error covari-ance matrix (Sf) and the measurement error covariance ma-trix (Sm).
Ss=(A−I)Se(A−I)T, (4)
Sf=GyKbSbKTbGTy, (5)
Sm=GySεGTy, (6)
Figure 4. (a)A typical CH4averaging kernel matrix of the SFIT4NIR retrieval with the SZA of 63◦at St Denis, in units of the mole fraction profile with respect to the a priori.(b)CH4column-averaging kernels (in unit of 1; applying for the partial column profile) with different solar zenith angles.
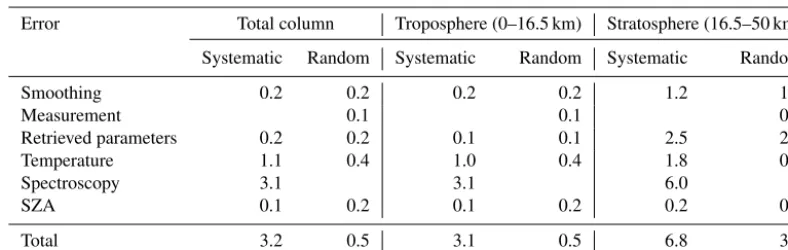
important parameters contributing to the forward model. Ac-cording to the HITRAN2012 (Rothman et al., 2013), the un-certainty of CH4absorption in the selected retrieval window is about 2 %–5 %. Therefore, the systematic uncertainty of the spectroscopy is set to 3 %, and the random uncertainty of the spectroscopic data is assumed to be negligible. The systematic and random uncertainties are set to 1 % for the temperature. The systematic uncertainty is set to 0.1 % and the random uncertainty is set to 0.5 % for the SZA.Sεis as-sumed to be diagonal where the diagonal elements are the in-verse square of the SNR. The propagated uncertainties of the total column and the partial columns (troposphere and strato-sphere) are listed in Table 5. The mean tropopause height above St Denis is about 16.5 km. The systematic and random uncertainties of the SFIT4NIR-retrieved CH4 total column are 3.2 % and 0.5 % respectively. The dominating component of the systematic uncertainty comes from the spectroscopy. The uncertainties of the partial column in the troposphere are closer to those of the total column, while the uncertainties of the partial column in the stratosphere are relatively large.
3 Results and discussion
The retrieval strategy listed in Table 2 is applied for all six sites. In this section, the data quality of the SFIT4NIR retrievals is evaluated with TCCON standard retrievals, ground-based in situ measurements, ACE-FTS satellite re-mote sensing observations, TCCON proxy XCH4 data and AirCore measurements.
3.1 TCCON standard retrievals
According to Sect. 2.2.5, the random uncertainty of the SFIT4NIR total column is about 0.5 %, which is close to that
of TCCON retrieval (Wunch et al., 2015). The systematic un-certainty of the SFIT4NIR total column is about 3.2 %, where a large contribution is from the spectroscopy. To better under-stand the systematic uncertainty of the SFIT4NIR-retrieved total column, the SFIT4NIRXCH4 at six sites in 2016–2017 is calculated and compared with TCCON standard products. The systematic uncertainty of the TCCONXCH4 products is within 0.2 %.
GGG2014 uses the ratio between CH4 and O2 total columns to calculate theXCH4 (Yang et al., 2002), as the at-mospheric O2mole fraction is relatively stable with the mole fraction of 0.2095:
XCH4=0.2095 TCCH4/TCO2. (7) TheXCH4from the SFIT4NIR retrieval is calculated as
XCH4= TCCH4
TCdryair
= TCCH4
Ps/(gmdryair)−TCH2O(mH2O/m dry air)
, (8)
where TCdryair and TCH2O are total columns of dry air and H2O; Ps is the surface pressure; g is the total column-averaged gravitational acceleration; mH2O and m
Table 5.The systematic and random uncertainties for the SFIT4NIR-retrieved CH4total column, partial columns in the troposphere (0– 16.5 km) and in the stratosphere (16.5–50 km). The uncertainties are shown in percentages (%). The empty field shows where the uncertainty is negligible, with a value of less than 0.1 %.
Error Total column Troposphere (0–16.5 km) Stratosphere (16.5–50 km)
Systematic Random Systematic Random Systematic Random
Smoothing 0.2 0.2 0.2 0.2 1.2 1.6
Measurement 0.1 0.1 0.9
Retrieved parameters 0.2 0.2 0.1 0.1 2.5 2.5
Temperature 1.1 0.4 1.0 0.4 1.8 0.5
Spectroscopy 3.1 3.1 6.0
SZA 0.1 0.2 0.1 0.2 0.2 0.9
Total 3.2 0.5 3.1 0.5 6.8 3.3
individually for each SFIT4NIR retrieval using the tempera-ture and pressure profiles from the NCEP 6-hourly reanalysis data. The tropopause height varies from site to site according to its latitude. The tropopause height is about 8–11 km at Ny-Ålesund and Sodankylä, 10–12 km at Bialystok, Bremen and Orléans and 16–17 km at St Denis.
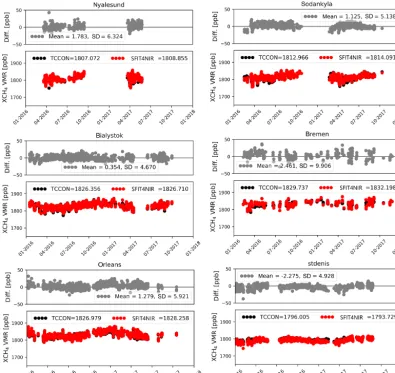
Figure 5 shows the time series of the hourly means of XCH4 from SFIT4NIR and TCCON retrievals and their dif-ferences for measurements performed in 2016–2017. The mean and standard deviation of theXCH4difference between SFIT4NIR and TCCON (SFIT4NIR–TCCON) at the six sites are in the range between −2.3 ppb (−0.14 %) and 2.5 ppb (0.15 %) and between 4.7 ppb (0.3 %) and 9.9 ppb (0.5 %). The standard deviations of the differences at all sites are within 0.5 %, which is consistent with the combined ran-dom uncertainties from SFIT4NIR and TCCON retrievals. The systematic bias between the SFIT4NIR- and TCCON-retrievedXCH4 is much lower than 3.2 %, indicating that the systematic uncertainty of the SFIT4NIR total column from the spectroscopy (see Table 3) is overestimated. Since the systematic uncertainty of the TCCONXCH4retrieval is better than 0.2 %, it is inferred that the systematic uncertainty of the SFIT4NIRXCH4 retrieval is within 0.35 %. Figure 6 shows the scatter plots of theXCH4 retrievals from SFIT4NIR and TCCON at the six sites. The linear regression line (dashed red line) is very close to the one-to-one lines for all panels. The correlation coefficient is in the range between 0.76 and 0.94. No obvious seasonal variation is seen from Figs. 5 and 6.
3.2 In situ measurements
This section presents the comparison results between the ground-based in situ measurements at the individual sites and the tropospheric XCH4 retrieved using SFIT4NIR. Ground-based in situ measurements are more sensitive to the local sources and sinks as compared to the FTS measurements. The Traînou tower at the Orléans site takes in situ ments at four heights (180, 100, 50 and 5 m). The
measure-ments at 180 m are used here as they are less affected by the boundary layer (Schmidt et al., 2014). In situ measurements for the St Denis site are taken from the measurements taken at Maïdo (2155 m) located at about 20 km away from St De-nis (Zhou et al., 2018). The in situ measurements at Maïdo are less affected by the surface, and CH4is well-mixed in the lower atmosphere with a lifetime of 8–10 years (Kirschke et al., 2013). Both ground-based in situ instruments at Or-léans and Maïdo are calibrated frequently at the Laboratoire des Sciences du Climat et de l’Environnement (LSCE). The in situ measurements from other sites are not used in order to reduce the influence from the boundary layer.
Figure 5.The time series of hourly means ofXCH4from the SFIT4NIR and the TCCON retrievals at six TCCON sites during 2016–2017,
together with their differences. For each site, the lower panel shows the time series of SFIT4NIR and TCCON measurements, and the upper panel shows the absolute difference between them (SFIT4NIR–TCCON; in ppb units). The values in the legend of the lower panel are the means of the TCCON and SFIT4NIR retrievals.
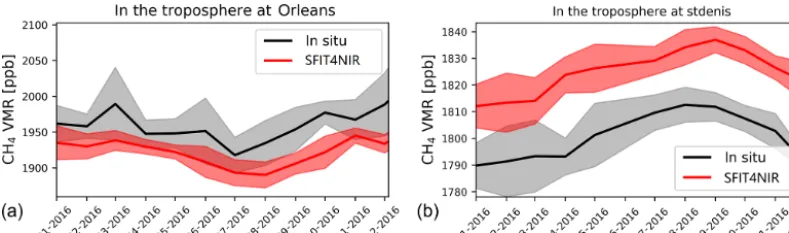
XCH4 is systematically larger than the CH4 mole faction at the surface.
The phases and amplitudes of the seasonal cycles from the SFIT4NIR troposphericXCH4 and the ground-based in situ CH4measurements are found to be in good agreement. CH4 mole fraction is high in December–March and low in July– September at Orléans (located in the Northern Hemisphere), and high in July–September and low in December–March at St Denis (located in the Southern Hemisphere). The CH4 sea-sonal variations in the troposphere are driven by the OH vari-ation, which is the major sink of CH4in the atmosphere.
3.3 ACE-FTS satellite observations
The comparison results between the SFIT4NIR stratospheric XCH4 and the ACE-FTS satellite observations are discussed in this section. The vertical range from the tropopause height
Figure 6.The scatter plots between SFIT4NIR and TCCONXCH4
hourly retrievals at the six TCCON sites. The dots are coloured with the measurement months. In each panel, the black line is the one-to-one line and the dashed red line is the linear fitting. N is the measurement number andRis the correlation coefficient.
35–40 km and a slight reduction at 23 km (Waymark et al., 2014).
Figure 8 shows the SFIT4NIR and ACE-FTS co-located daily means of the stratospheric XCH4 at Bialystok, Or-léans and St Denis. The ACE-FTS measurements are selected within±3×30◦(latitude by longitude) around each FTS site.
Limited co-locations are found for Ny-Ålesund, Sodankylä and Bremen sites and so the results are not shown here. Fig-ure 8 shows that the seasonal cycles (both phase and ampli-tude) of the stratospheric XCH4 from SFIT4NIR and ACE-FTS are similar. The stratosphericXCH4shows a minimum in February–April and a maximum in August–October for the Bialystok and Orléans sites located in the Northern Hemi-sphere, whereas the stratosphericXCH4 shows a minimum in August–October and a maximum in February–April for the St Denis site, located in the Southern Hemisphere. The mean and the standard deviation of the differences in stratospheric XCH4 between the SFIT4NIR and ACE-FTS measurements at these three sites are in the range between −0.27 % and 2.06 % and between 1.92 % and 3.21 %, respectively, which are within their uncertainties.
3.4 TCCON proxy data
In this section, the tropospheric and stratosphericXCH4from SFIT4NIR retrievals are compared with the results derived from the N2O and HF proxy methods at the six TCCON sites. We refer to Wang et al. (2014) and Saad et al. (2014) for the details of computing the tropospheric and stratosphericXCH4 by the proxy retrieval method using N2O and HF. Figure 9 shows the time series of the tropospheric and stratospheric XCH4from the TCCON proxy N2O and HF method. First, the tropospheric and stratosphericXCH4 from the N2O and HF proxy methods are close to each other. However, a slight sea-sonal and site-dependent bias is observed. For example, the difference in the troposphericXCH4 between the N2O proxy method and HF proxy method is larger in summer than that in winter at Ny-Ålesund. The troposphericXCH4from the N2O and HF proxy methods are very close to each other for St De-nis, while for the other five sites, the troposphericXCH4from the N2O method is larger by about 15–20 ppb than the HF method. The bias in the troposphericXCH4 between the N2O and HF methods is in a good agreement with Fig. 7 in Wang et al. (2014). As the TCCON N2O retrievals are corrected to the WMO scale (Wunch et al., 2015), while HF retrievals have not been validated, the systematic bias is probably due to the uncertainty of theXHFproduct. Second, at St Denis (a moist site), the TCCON HF retrievals are strongly affected by H2O so that the TCCON proxy method tropospheric and the stratosphericXCH4 data using HF have many outliers.
cal-from St Denis.
Figure 8. (a, c, e)The time series of the daily mean of the co-located SFIT4NIR and ACE-FTS stratosphericXCH4daily mean measurements,
culated from the temperature and the altitude profiles (Wang et al., 2017).
3.5 AirCore measurements at Sodankylä
The AirCore is an atmospheric sampling system which uses a long tube to sample the air from the surrounding atmosphere and to preserve profiles of the trace gases of interest from the surface (few hundred metres) to the middle stratosphere (about 30 km; Karion et al., 2010). Regular AirCore mea-surements of CH4have been carried out at Sodankylä since September 2013. During 2016–2017, we selected seven Air-Core profiles which are within 1 h of SFIT4NIR measure-ments.
As an example, the AirCore CH4 profile on 5 Septem-ber 2017, together with the co-located (within±1 h) a priori and retrieved SFIT4NIR profiles are shown in the left panel of Fig. 10. AirCore and FTS data cannot be compared di-rectly, because the AirCore profile has a high vertical resolu-tion but it covers only a part of the total column that is ob-served by the FTS. The AirCore measurement for this launch covers the vertical range from about 0.6 to 26 km, and needs to be extended for comparison with the FTS data. For the ex-trapolation, a scaled SFIT4NIR a priori profile is applied to extend the AirCore CH4profile above 26 km, and the local surface CH4mole fraction observations (Kilkki et al., 2015) are applied to extend the AirCore CH4profile below 0.6 km. In order to take the vertical sensitivity of the FTS retrieval into account (Rodgers, 2003), the “extended” AirCore pro-file is then smoothed with the co-located SFIT4NIR retrieval xaircore,s=xa+A(xinsitu−xa), (9) where xinstu is the “extended” AirCore profile, xa is the a priori profile of the SFIT4NIR retrieval and xaircore,s is the smoothed AirCore profile. The mean and the stan-dard deviation of the relative differences between the co-located SFIT4NIR retrievals and the smoothed AirCore pro-file ((SFIT4NIR–AirCore)/AirCore×100 %) are shown in the right panel of Fig. 10. The bias is about +1.5 % in the lower and the middle troposphere, between +1 and −4 % in the upper troposphere and lower stratosphere region, and about−2.5 % in the middle and upper stratosphere.
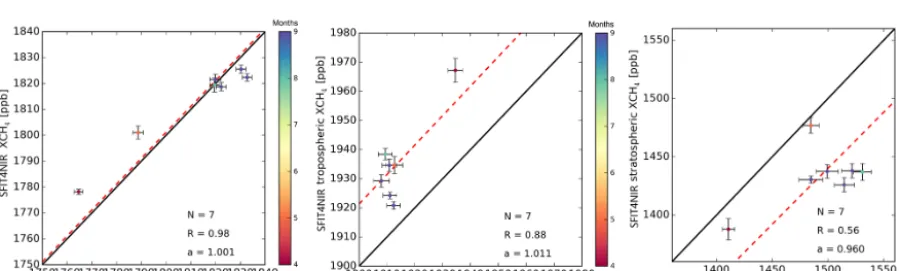
Figure 11 shows the scatter plots of XCH4 between the co-located SFIT4NIR retrievals and the AirCore measure-ments for the whole atmosphere, and for the tropospheric and stratospheric components. The error bars are the random un-certainties of the SFIT4NIR retrievals and the AirCore mea-surements. It is assumed that the random uncertainty of the AirCore profile is about 0.1 % between the surface and its maximum measurement altitude (∼30 km), and it is about 2 % above the maximum measurement altitude. The slope of the regression line (a=1.001) in the whole atmosphere in-dicates that there is almost no systematic difference between the SFIT4NIR and the AirCore XCH4, which is consistent with the result in the comparison between SFIT4NIR and
TCCONXCH4measurements (Figs. 5 and 6). The SFIT4NIR troposphericXCH4 is about 1.1±0.4 % larger than the Air-Core measurements and the SFIT4NIR stratosphericXCH4 is about 4.0±2.0 % less than the AirCore measurements. These differences between the SFIT4NIR retrievals and Air-Core measurements are within the systematic uncertainties of the SFIT4NIR partial columns in the troposphere and strato-sphere, and it is inferred that the systematic uncertainty of the SFIT4NIR partial column mainly comes from the uncer-tainty of the spectroscopy (see Table 5).
3.6 Aircraft measurements during the IMECC campaign
The Infrastructure for Measurement of the European Carbon Cycle (IMECC) aircraft equipment passed over several Euro-pean TCCON sites in September and October 2009, includ-ing Orléans, Bremen and Bialystok. We refer to Geibel et al. (2012) for a detail description of the IMECC aircraft data. The aircraft equipment cover a vertical range from about 300 to 13 000 m, mainly in the troposphere. Therefore, in this sec-tion, we use the co-located aircraft measurements for com-parison with the SFIT4NIR troposphericXCH4. The location, date and time of the overflight, SZA and the profile code are listed in Table 1 in Geibel et al. (2012). There are four air-craft vertical profiles over Bialystok (OF1a, OF1b, BI-OF2a, BI-OF2b), four profiles over Orléans (OF1a, OR-OF1b, OR-OF2a, OR-OF2b) and two profiles over Bremen (BR-OF1a, BR-OF2a).
To compare the aircraft measurements with the SFIT4NIR, the aircraft profiles need to be extended for comparison with FTS retrievals. The extrapolation method is the same as de-scribed in Sect. 4.2 in Geibel et al. (2012). For the near-ground part, near-ground-based in situ data from the co-located tall-tower stations are used to extend the aircraft data to the ground at Orléans and Bialystok, and the values measured at the lowermost altitude by the aircraft are linearly extrap-olated to the surface at Bremen. For the upper part, the TC-CON (GGG2012) a priori profile multiplied by the retrieval scaling factor is used. The uncertainties of “extended” air-craft profiles have been shown in Table 2 in Geibel et al. (2012). After that, the “extended” aircraft profile is smoothed with FTS retrieval using Eq. (9), where thexinsituis the air-craft measurement. The SFIT4NIR retrievals within a time window of±1 h around the aircraft overflight are chosen. The standard deviation of the co-located SFIT4NIR retrievals is used as the random uncertainty of the FTS retrieval.
in-Figure 9.The time series of the tropospheric (left panels) and the stratospheric (right panels) co-locatedXCH4 hourly means from the
SFIT4NIR and the proxy method (both N2O and HF) at the six TCCON sites.
vestigation is required to see if the systematic bias can be observed at other sites.
4 Conclusions
The retrieval of CH4vertical information from TCCON FTS NIR spectra has been carried out at six sites during 2016–
Figure 10. (a)The CH4profile from the AirCore measurement (solid black line) on 5 September 2017, together with the SFIT4NIR a priori (dash-dotted orange line) and retrieved (solid orange line) profiles. The AirCore measurement is extrapolated with the surface in situ measurements (green star) and the scaled SFIT4NIR a priori profile (dotted green line). The grey line is the smoothed AirCore profile.(b)The mean (solid black line) and the stand deviation (shading) of the relative difference between the co-located SFIT4NIR-retrieved profiles and the smoothed AirCore measurements ((SFIT4NIR–AirCore)/AirCore×100 %).
Figure 11. The scatter plots ofXCH4 between the SFIT4NIR and the AirCore measurements for the whole atmosphere(a), and for the
tropospheric(b)and stratospheric(c)components. In each panel, the black line is the one-to-one line and the dashed red line is the regression line with the intercept to zero (y=a·x).Nis the co-located measurement number,Ris the correlation coefficient, andais the slope.
of the SFIT4NIR is about 2.4, with two distinct pieces of information in the troposphere and the stratosphere. The sys-tematic and random uncertainties of the SFIT4NIR-retrieved total column are about 3.2 % and 0.5 %.
The SFIT4NIR-retrieved CH4 total columns and partial columns (troposphere and stratosphere) have been evalu-ated based on the standard TCCON retrievals, ground-based in situ measurements, ACE-FTS satellite observations, TC-CON proxy XCH4 data and AirCore measurements at So-dankylä. It is found that the SFIT4NIR-retrievedXCH4 data are very close to the standard TCCON retrievals with the mean bias between−0.14 % and 0.15 % and the standard de-viation of bias between 0.3 % and 0.5 % at the six TCCON
Figure 12.The scatter plots ofXCH4 between the SFIT4NIR and
the IMECC aircraft measurements together with the AirCore mea-surements for the tropospheric components. The black line is the one-to-one line and the dashed red line is the regression line with the intercept to zero (y=a·x).N is the co-located measurement number,Ris the correlation coefficient andais the slope.
to understand the accuracy of the seasonal cycle from the SFIT4NIR troposphericXCH4when more aircraft or AirCore measurements become available. By comparison against Air-Core measurements at Sodankylä, it is found that there is almost no systematic bias between the SFIT4NIR and Air-Core XCH4 (in the whole atmosphere), which is consistent with the comparison between the SFIT4NIR and the TCCON standard retrievals. An underestimation of 4.0±2.0 % in the SFIT4NIR stratospheric XCH4 is seen by comparison with AirCore measurements, and an overestimation of 1.0±0.3 % in the SFIT4NIR tropospheric XCH4 is seen by comparing it with AirCore measurements and IMECC aircraft measure-ments. These biases are within the systematic uncertainties of SFIT4NIR-retrieved partial columns in the troposphere and stratosphere respectively.
Data availability. The TCCON data are publicly available through the TCCON wiki (https://tccondata.org/, last access: 12 Septem-ber 2019). The ACE-FTS data used in this study are available from https://ace.uwaterloo.ca/data.php (last access: 20 November 2019) (registration required). The SFIT4NIR retrievals, TCCON proxy data, ground-based in situ measurements and AirCore measure-ments are available by contacting the author.
Author contributions. MZ wrote the manuscript. MZ, BL and MDM investigated the SFIT4 retrieval strategy. MKS, CH, CP, TW, JMM, RK and PH provided and interpreted the TCCON data. NK and MR provided and analysed the in situ measurements. HC and RK provided the AirCore measurements. All authors read and com-mented the manuscript.
the TCCON network for making the data publicly available. The AirCore data from the Sodankylä site in 2017 is generated from the FRM4GHG project which received financial support from the European Space Agency under the grant agreement no. ESA-IPL-POE-LG-cl-LE-2015-1129.
Financial support. This research has been supported by the EU H2020 RINGO project (grant no. 730944).
Review statement. This paper was edited by Hartwig Harder and reviewed by two anonymous referees.
References
Agusti-Panareda, A., Diamantakis, M., Bayona, V., Klappenbach, F., and Butz, A.: Improving the inter-hemispheric gradient of to-tal column atmospheric CO2and CH4in simulations with the ECMWF semi-Lagrangian atmospheric global model, Geosci. Model Dev., 10, 1–18, https://doi.org/10.5194/gmd-10-1-2017, 2017.
Bernath, P. F., McElroy, C. T., Abrams, M. C., Boone, C. D., Butler, M., Camy-Peyret, C., Carleer, M., Clerbaux, C., Coheur, P. F., Colin, R., DeCola, P., DeMazière, M., Drummond, J. R., Du-four, D., Evans, W. F. J., Fast, H., Fussen, D., Gilbert, K., Jen-nings, D. E., Llewellyn, E. J., Lowe, R. P., Mahieu, E., Mc-Connell, J. C., McHugh, M., McLeod, S. D., Michaud, R., Mid-winter, C., Nassar, R., Nichitiu, F., Nowlan, C., Rinsland, C. P., Rochon, Y. J., Rowlands, N., Semeniuk, K., Simon, P., Skel-ton, R., Sloan, J. J., Soucy, M. A., Strong, K., Tremblay, P., Turnbull, D., Walker, K. A., Walkty, I., Wardle, D. A., Wehrle, V., Zander, R., and Zou, J.: Atmospheric chemistry experiment (ACE): Mission overview, Geophys. Res. Lett., 32, L15S01, https://doi.org/10.1029/2005GL022386, 2005.
Chem. Phys., 8, 2421–2435, https://doi.org/10.5194/acp-8-2421-2008, 2008.
De Mazière, M., Sha, M. K., Desmet, F., Hermans, C., Sco-las, F., Kumps, N., Metzger, J.-M., Duflot, V., and Cammas, J.-P.: TCCON data from Reunion Island (RE), Release GGG2014R0, TCCON data archive, hosted by CaltechDATA, https://doi.org/10.14291/tccon.ggg2014.reunion01.R0/1149288, 2014.
De Mazière, M., Thompson, A. M., Kurylo, M. J., Wild, J. D., Bernhard, G., Blumenstock, T., Braathen, G. O., Hannigan, J. W., Lambert, J.-C., Leblanc, T., McGee, T. J., Nedoluha, G., Petropavlovskikh, I., Seckmeyer, G., Simon, P. C., Stein-brecht, W., and Strahan, S. E.: The Network for the Detec-tion of Atmospheric ComposiDetec-tion Change (NDACC): history, status and perspectives, Atmos. Chem. Phys., 18, 4935–4964, https://doi.org/10.5194/acp-18-4935-2018, 2018.
Deutscher, N. M., Griffith, D. W. T., Bryant, G. W., Wennberg, P. O., Toon, G. C., Washenfelder, R. A., Keppel-Aleks, G., Wunch, D., Yavin, Y., Allen, N. T., Blavier, J.-F., Jiménez, R., Daube, B. C., Bright, A. V., Matross, D. M., Wofsy, S. C., and Park, S.: Total column CO2measurements at Darwin, Australia – site description and calibration against in situ aircraft profiles, At-mos. Meas. Tech., 3, 947–958, https://doi.org/10.5194/amt-3-947-2010, 2010.
Deutscher, N. M., Notholt, J., Messerschmidt, J., Weinzierl, C., Warneke, T., Petri, C., Grupe, P., and Katryn-ski, K.: TCCON data from Bialystok (PL), Release GGG2014R0, TCCON data archive, hosted by CaltechDATA, https://doi.org/10.14291/tccon.ggg2014.bialystok01.R0/1149277, 2014.
Dils, B., Buchwitz, M., Reuter, M., Schneising, O., Boesch, H., Parker, R., Guerlet, S., Aben, I., Blumenstock, T., Burrows, J. P., Butz, A., Deutscher, N. M., Frankenberg, C., Hase, F., Hasekamp, O. P., Heymann, J., De Mazière, M., Notholt, J., Suss-mann, R., Warneke, T., Griffith, D., Sherlock, V., and Wunch, D.: The Greenhouse Gas Climate Change Initiative (GHG-CCI): comparative validation of GHG-CCI SCIAMACHY/ENVISAT and TANSO-FTS/GOSAT CO2 and CH4 retrieval algorithm products with measurements from the TCCON, Atmos. Meas. Tech., 7, 1723–1744, https://doi.org/10.5194/amt-7-1723-2014, 2014.
Ehhalt, D. H. and Heidt, L. E.: Vertical profiles of CH4 in the troposphere and stratosphere, J. Geophys. Res., 78, 5265–5271, https://doi.org/10.1029/JC078i024p05265, 1973.
European Commission: Emission Database for Global Atmospheric Research (EDGAR), release EDGARv4.2 FT2010, Tech. rep., Joint Research Centre (JRC)/Netherlands Environmental Assess-ment Agency (PBL), available at: http://edgar.jrc.ec.europa.eu (last access: 12 April 2018), 2013.
Fraser, A., Palmer, P. I., Feng, L., Boesch, H., Cogan, A., Parker, R., Dlugokencky, E. J., Fraser, P. J., Krummel, P. B., Langen-felds, R. L., O’Doherty, S., Prinn, R. G., Steele, L. P., van der Schoot, M., and Weiss, R. F.: Estimating regional methane sur-face fluxes: the relative importance of sursur-face and GOSAT mole fraction measurements, Atmos. Chem. Phys., 13, 5697–5713, https://doi.org/10.5194/acp-13-5697-2013, 2013.
Geibel, M. C., Messerschmidt, J., Gerbig, C., Blumenstock, T., Chen, H., Hase, F., Kolle, O., Lavriˇc, J. V., Notholt, J., Palm, M., Rettinger, M., Schmidt, M., Sussmann, R., Warneke, T., and
Feist, D. G.: Calibration of column-averaged CH4 over Euro-pean TCCON FTS sites with airborne in-situ measurements, At-mos. Chem. Phys., 12, 8763–8775, https://doi.org/10.5194/acp-12-8763-2012, 2012.
Houweling, S., Krol, M., Bergamaschi, P., Frankenberg, C., Dlu-gokencky, E. J., Morino, I., Notholt, J., Sherlock, V., Wunch, D., Beck, V., Gerbig, C., Chen, H., Kort, E. A., Röck-mann, T., and Aben, I.: A multi-year methane inversion us-ing SCIAMACHY, accountus-ing for systematic errors usus-ing TC-CON measurements, Atmos. Chem. Phys., 14, 3991–4012, https://doi.org/10.5194/acp-14-3991-2014, 2014.
IPCC: Climate change 2013: The physical science basis. Contribu-tion of Working Group I to the Fifth Assessment Report of the Intergovernmental Panel on Climate Change, 2013.
Karion, A., Sweeney, C., Tans, P., and Newberger, T.: AirCore: An innovative atmospheric sampling system, J. Atmos. Ocean. Tech., 27, 1839–1853, https://doi.org/10.1175/2010JTECHA1448.1, 2010.
Keppel-Aleks, G., Toon, G. C., Wennberg, P. O., and Deutscher, N. M.: Reducing the impact of source brightness fluctuations on spectra obtained by Fourier-transform spectrometry., Appl. Opt., 46, 4774–4779, https://doi.org/10.1364/AO.46.004774, 2007. Kilkki, J., Aalto, T., Hatakka, J., Portin, H., and Laurila, T.:
Atmo-spheric CO2observations at Finnish urban and rural sites, Boreal Environ. Res., 20, 227–242, 2015.
Kirschke, S., Bousquet, P., Ciais, P., Saunois, M., Canadell, J. G., Dlugokencky, E. J., Bergamaschi, P., Bergmann, D., Blake, D. R., Bruhwiler, L., Cameron-Smith, P., Castaldi, S., Chevallier, F., Feng, L., Fraser, A., Heimann, M., Hodson, E. L., Houweling, S., Josse, B., Fraser, P. J., Krummel, P. B., Lamarque, J.-F., Lan-genfelds, R. L., Le Quéré, C., Naik, V., O’Doherty, S., Palmer, P. I., Pison, I., Plummer, D., Poulter, B., Prinn, R. G., Rigby, M., Ringeval, B., Santini, M., Schmidt, M., Shindell, D. T., Simp-son, I. J., Spahni, R., Steele, L. P., Strode, S. A., Sudo, K., Szopa, S., van der Werf, G. R., Voulgarakis, A., van Weele, M., Weiss, R. F., Williams, J. E., and Zeng, G.: Three decades of global methane sources and sinks, Nat. Geosci., 6, 813–823, https://doi.org/10.1038/ngeo1955, 2013.
Kivi, R., Heikkinen, P., and Kyrö, E.: TCCON
data from Sodankyla (FI), Release GGG2014R0,
TCCON data archive, hosted by CaltechDATA,
https://doi.org/10.14291/tccon.ggg2014.sodankyla01.R0/1149280, 2014.
Notholt, J., Petri, C., Warneke, T., Deutscher, N. M., Buschmann, M., Weinzierl, C., Macatangay, R., and Grupe, P.: TCCON data from Bremen (DE), Release GGG2014R0, TCCON data archive, hosted by CaltechDATA, https://doi.org/10.14291/tccon.ggg2014.bremen01.R0/1149275, 2014.
Notholt, J., Warneke, T., Petri, C., Deutscher, N. M., Weinzierl, C., Palm, M., and Buschmann, M.: TC-CON data from Ny Ålesund, Spitsbergen (NO), Release GGG2014.R0, TCCON data archive, hosted by CaltechDATA, https://doi.org/10.14291/tccon.ggg2014.nyalesund01.R0/1149278, 2017.
Physics, vol. 2, World Scientific Publishing Co. Pte. Ltd, Singa-pore, https://doi.org/10.1142/9789812813718, 2000.
Rodgers, C. D.: Intercomparison of remote sound-ing instruments, J. Geophys. Res., 108, 46–48, https://doi.org/10.1029/2002JD002299, 2003.
Rothman, L. S., Gordon, I. E., Babikov, Y., Barbe, A., Chris Benner, D., Bernath, P. F., Birk, M., Bizzocchi, L., Boudon, V., Brown, L. R., Campargue, A., Chance, K., Cohen, E. A., Coudert, L. H., Devi, V. M., Drouin, B. J., Fayt, A., Flaud, J. M., Gamache, R. R., Harrison, J. J., Hartmann, J. M., Hill, C., Hodges, J. T., Jacque-mart, D., Jolly, A., Lamouroux, J., Le Roy, R. J., Li, G., Long, D. A., Lyulin, O. M., Mackie, C. J., Massie, S. T., Mikhailenko, S., Müller, H. S. P., Naumenko, O. V., Nikitin, A. V., Orphal, J., Perevalov, V., Perrin, A., Polovtseva, E. R., Richard, C., Smith, M. A. H., Starikova, E., Sung, K., Tashkun, S., Tennyson, J., Toon, G. C., Tyuterev, V. G., and Wagner, G.: The HITRAN2012 molecular spectroscopic database, J. Quant. Spectrosc. Rad., 130, 4–50, https://doi.org/10.1016/j.jqsrt.2013.07.002, 2013. Saad, K. M., Wunch, D., Toon, G. C., Bernath, P., Boone, C.,
Con-nor, B., Deutscher, N. M., Griffith, D. W. T., Kivi, R., Notholt, J., Roehl, C., Schneider, M., Sherlock, V., and Wennberg, P. O.: Derivation of tropospheric methane from TCCON CH4and HF total column observations, Atmos. Meas. Tech., 7, 2907–2918, https://doi.org/10.5194/amt-7-2907-2014, 2014.
Saad, K. M., Wunch, D., Deutscher, N. M., Griffith, D. W. T., Hase, F., De Mazière, M., Notholt, J., Pollard, D. F., Roehl, C. M., Schneider, M., Sussmann, R., Warneke, T., and Wennberg, P. O.: Seasonal variability of stratospheric methane: implica-tions for constraining tropospheric methane budgets using total column observations, Atmos. Chem. Phys., 16, 14003–14024, https://doi.org/10.5194/acp-16-14003-2016, 2016.
Saito, R., Patra, P. K., Deutscher, N., Wunch, D., Ishijima, K., Sherlock, V., Blumenstock, T., Dohe, S., Griffith, D., Hase, F., Heikkinen, P., Kyrö, E., Macatangay, R., Mendonca, J., Messer-schmidt, J., Morino, I., Notholt, J., Rettinger, M., Strong, K., Sussmann, R., and Warneke, T.: Technical Note: Latitude-time variations of atmospheric column-average dry air mole fractions of CO2, CH4 and N2O, Atmos. Chem. Phys., 12, 7767–7777, https://doi.org/10.5194/acp-12-7767-2012, 2012.
Schmidt, M., Lopez, M., Yver Kwok, C., Messager, C., Ramonet, M., Wastine, B., Vuillemin, C., Truong, F., Gal, B., Parmen-tier, E., Cloué, O., and Ciais, P.: High-precision quasi-continuous atmospheric greenhouse gas measurements at Trainou tower
4
dimension reduction and MCMC, J. Geophys. Res.-Atmos., 121, 10312–10327, https://doi.org/10.1002/2015JD024657, 2016. Wang, Z., Deutscher, N. M., Warneke, T., Notholt, J., Dils, B.,
Grif-fith, D. W. T., Schmidt, M., Ramonet, M., and Gerbig, C.: Re-trieval of tropospheric column-averaged CH4mole fraction by solar absorption FTIR-spectrometry using N2O as a proxy, At-mos. Meas. Tech., 7, 3295–3305, https://doi.org/10.5194/amt-7-3295-2014, 2014.
Wang, Z., Warneke, T., Deutscher, N. M., Notholt, J., Karstens, U., Saunois, M., Schneider, M., Sussmann, R., Sembhi, H., Grif-fith, D. W. T., Pollard, D. F., Kivi, R., Petri, C., Velazco, V. A., Ramonet, M., and Chen, H.: Contributions of the tropo-sphere and stratotropo-sphere to CH4 model biases, Atmos. Chem. Phys., 17, 13283–13295, https://doi.org/10.5194/acp-17-13283-2017, 2017.
Warneke, T., Messerschmidt, J., Notholt, J., Weinzierl, C., Deutscher, N. M., Petri, C., Grupe, P., Vuillemin, C., Truong, F., Schmidt, M., Ramonet, M., and Par-mentier, E.: TCCON data from Orléans (FR), Release GGG2014R0, TCCON data archive, hosted by CaltechDATA, https://doi.org/10.14291/tccon.ggg2014.orleans01.R0/1149276, 2014.
Waymark, C., Waymark, C., Walker, K., Boone, C. D., and Bernath, P. F.: ACE-FTS version 3.0 data set: validation and data process-ing update, Ann. Geophys., 56, https://doi.org/10.4401/ag-6339, 2014.
Wunch, D., Toon, G. C., Blavier, J.-F. L., Washenfelder, R. A., Notholt, J., Connor, B. J., Griffith, D. W. T., Sherlock, V., and Wennberg, P. O.: The Total Carbon Column Observing Network, Philos. Trans. R. Soc. A Math. Phys. Eng. Sci., 369, 2087–2112, https://doi.org/10.1098/rsta.2010.0240, 2011.
Wunch, D., Toon, G. C., Sherlock, V., Deutscher, N. M., Liu, C., Feist, D. G., and Wennberg, P. O.: The Total Carbon Column Observing Network’s GGG2014 Data Version, p. 43, https://doi.org/10.14291/tccon.ggg2014.documentation.R0/1221662, 2015.
Yang, Z., Toon, G. C., Margolis, J. S., and Wennberg, P. O.: Atmospheric CO2 retrieved from ground-based near IR solar spectra, Geophys. Res. Lett., 29, 1–4, https://doi.org/10.1029/2001GL014537, 2002.
Zhou, M., Dils, B., Wang, P., Detmers, R., Yoshida, Y., O’Dell, C. W., Feist, D. G., Velazco, V. A., Schneider, M., and De Maz-ière, M.: Validation of TANSO-FTS/GOSAT XCO2and XCH4 glint mode retrievals using TCCON data from near-ocean sites, Atmos. Meas. Tech., 9, 1415–1430, https://doi.org/10.5194/amt-9-1415-2016, 2016.