Lipoprotein Cholesterol Among Children
WHAT’S KNOWN ON THIS SUBJECT: Children with high levels of LDL cholesterol are likely to have elevated levels in adulthood.
WHAT THIS STUDY ADDS: Despite the tracking of LDL cholesterol levels, children with very high levels (eg,ⱖ160 mg/dL) are likely to have lower levels at the next measurement. These decreases may be entirely attributable to regression to the mean.
abstract
OBJECTIVE:A 2008 report from the American Academy of Pediatrics recommended both population and individual approaches (including pharmacologic interventions) for adolescents who had low-density li-poprotein (LDL) cholesterol levels above various cutoff points (130, 160, and 190 mg/dL). However, the tracking and variability of these very high levels have not been investigated.
METHODS:A total of 6827 subjects underwent multiple LDL cholesterol determinations in childhood and adulthood in the Bogalusa Heart Study. The total number of determinations was 26 748, and the median interval between examinations was 3 years.
RESULTS:Correlations between initial and subsequent LDL cholesterol
levels ranged fromr⬃0.8 for measurements made within the same
year tor⬃0.5 for periods ofⱖ20 years. Most children who had very high LDL cholesterol levels, however, had substantially lower levels at the next examination. LDL cholesterol levels between 160 and 189 mg/dL (n⫽201) decreased, on average, by 21 mg/dL at the next exam-ination, whereas levels ofⱖ190 mg/dL (n⫽44) decreased by 34 mg/ dL. In contrast, the mean increase for LDL cholesterol levels of⬍70 mg/dL was 13 mg/dL. These changes were equal to those expected on the basis of regression to the mean.
CONCLUSIONS:There can be large changes in extreme levels of LDL cholesterol because of regression to the mean, and practitioners should be aware that very high levels may decrease substantially in the absence of any intervention.Pediatrics2010;126:266–273
AUTHORS:David S. Freedman, PhD,aY. Claire Wang, ScD,
MD,bWilliam H. Dietz, PhD, MD,aJi-Hua Xu, PhD,cSathanur
R. Srinivasan, PhD,cand Gerald S. Berenson, MDc
aDivision of Nutrition, Physical Activity, and Obesity, Centers for
Disease Control and Prevention, Atlanta, Georgia;bDepartment
of Health Policy and Management, Mailman School of Public Health, Columbia University, New York, New York; andcTulane
Center for Cardiovascular Health, School of Public Health and Tropical Medicine, Tulane University, New Orleans, Louisiana
KEY WORDS
low-density lipoprotein cholesterol, children, tracking, variability, regression to the mean
ABBREVIATION
LDL—low-density lipoprotein
The findings and conclusions in this report are those of the authors and do not necessarily represent the official position of the Centers for Disease Control and Prevention.
www.pediatrics.org/cgi/doi/10.1542/peds.2009-3454
doi:10.1542/peds.2009-3454
Accepted for publication Apr 23, 2010
Address correspondence to David S. Freedman, PhD, Centers for Disease Control and Prevention, Division of Nutrition, Physical Activity, and Obesity, K-26, 4770 Buford Highway, Atlanta, GA 30341-3724. E-mail: [email protected]
PEDIATRICS (ISSN Numbers: Print, 0031-4005; Online, 1098-4275).
Copyright © 2010 by the American Academy of Pediatrics
FINANCIAL DISCLOSURE:The authors have indicated they have no financial relationships relevant to this article to disclose.
The development of atherosclerosis begins in childhood1and is associated
with lipid and lipoprotein levels.2,3
Al-though adverse lipid levels among children predict subsequent levels in adolescence and adulthood,4–8a
sub-stantial proportion of children with initially high levels have lower levels on reexamination.7 This tendency, in
which subsequent measurements of extreme (high or low) biological levels are closer to the mean than was the initial determination, was recognized by Galton in the 1800s and has been termed “regression to the mean.”9
Because of the importance of low-density lipoprotein (LDL) cholesterol levels in early life, a 2008 report from the American Academy of Pediatrics10
identified several LDL cholesterol cut-off points for dietary and pharmaco-logic interventions for children and ad-olescents, with levels of ⬍110 mg/dL being considered acceptable. A popu-lation approach was recommended, and changes in diet and physical activ-ity were recommended for children and adolescents with LDL cholesterol levels of ⱖ130 mg/dL, a level that is between the 90th and 95th percentiles for adolescents.11 Pharmacologic
in-terventions were considered for 3 groups of adolescents (ⱖ10 years of age), that is, (1) those with LDL choles-terol levels ofⱖ190 mg/dL despite di-etary therapy, (2) those with LDL
cho-lesterol levels of ⱖ160 mg/dL and
other risk factors, and (3) those with LDL cholesterol levels ofⱖ130 mg/dL and diabetes mellitus.10It has been
es-timated that 200 000 adolescents in the United States might be eligible for pharmacologic treatment.11
Despite the tracking of elevated LDL cholesterol levels, the persistence of very high levels among children and
adolescents, such as those of ⱖ160
mg/dL orⱖ190 mg/dL, has not been
examined. Because LDL cholesterol lev-els show substantial biological
vari-ability,12–14 it is possible that, even
without any intervention, a large pro-portion of children and adolescents
with LDL cholesterol levels of ⬎160
mg/dL would have much lower levels at reexamination. The objective of the current study was to examine the persistence of very high levels of LDL cholesterol among children and adolescents.
METHODS
Study Population
Bogalusa is a biracial (one-third black) community in Louisiana. The objective of the Bogalusa Heart Study was to ex-amine the natural history of cardiovas-cular disease and risk factors among school-aged children,15and the first of
7 cross-sectional studies was
con-ducted in 1973–1974.16 On average,
each cross-sectional study examined ⬃3500 children 5 to 17 years of age; the final examination of school-aged children was performed in 1992–1994. Several substudies of selected groups of children were conducted between 1973 and 2002, and those LDL choles-terol determinations were included in the current analyses. For example, children who were 5, 8, 11, or 14 years of age at the 1973–1974 examination were reexamined in each of the subse-quent 3 years. Young adults (up to 44 years of age) were examined in various studies conducted in 1982–2002.17,18
The panel design and the participation of subjects in various examinations re-sulted in widely varying intervals be-tween consecutive LDL cholesterol de-terminations. We excluded 4190 of
⬃36 000 LDL cholesterol
determina-tions because the subject was not fast-ing, and we excluded another 71 deter-minations because of missing data. Because we were interested in exam-ining the stability of high LDL choles-terol levels, we further restricted the analyses to subjects who were exam-ined initially before 18 years of age and
who hadⱖ2 LDL cholesterol
determi-nations. These exclusions resulted in a sample of 6827 subjects, who were ex-amined an average of 5 times (range: 2–13 times). Of those subjects, 3410 were examined at least once in adult-hood (age ofⱖ18 years). The current analyses were based on 26 748 LDL cholesterol determinations.
Although previous analyses from the Bogalusa Heart Study examined the tracking of LDL cholesterol levels, those studies were based on LDL cho-lesterol levels for various subgroups that ranged in size from 273 to 1169 children.4,8,19 In contrast, the current
study uses all of the longitudinal data from the Bogalusa Heart Study.
Examinations and Laboratory Determinations
Height was measured to the nearest 0.1 cm and weight to the nearest 0.1 kg.20BMI was calculated as kilograms
per square meter, and BMI-for-age z
scores and percentiles were calcu-lated from the Centers for Disease Con-trol and Prevention growth charts.21,22
All chemical analyses were performed in the Bogalusa Heart Study Core Lab-oratory. Serum concentrations of total cholesterol and triglycerides were determined by using enzymatic proce-dures (Abbott VP [Abbott, North Chi-cago, IL]). After heparin-calcium pre-cipitation of LDL cholesterol and very
low-density lipoprotein cholesterol,
the LDL cholesterol concentration was determined from the densitometric (electrophoretic) ratio and cholesterol contents of the 2 lipoproteins.16
Statistical Analyses
Data management was performed by using SAS (SAS Institute, Cary, NC), and R23was used for the analyses. The
ence, and other statistics to describe the observed laboratory measurement error.
Various characteristics of the sample were summarized by using means and SDs, and lowess24 was used to
illus-trate the association between age and LDL cholesterol levels within each race/gender group. We examined the correlation between an individual’s ini-tial LDL cholesterol level and subse-quent levels in analyses that were stratified according to the interval be-tween measurements. Because sub-jects were examined in multiple exam-inations (mean: 5 examexam-inations), with unequal intervals between examina-tions, most subjects contributed multi-ple pairs for this analysis. For exammulti-ple, a subject with 3 LDL cholesterol mea-surements would be included in the analysis of the first and second deter-minations, as well as the first and third determinations. We also classified LDL cholesterol levels among children by using cutoff points of 70, 110, 130, 160, and 190 mg/dL for the 6 categories, and then we examined the relation-ships of initial and subsequent LDL cholesterol level categories. LDL cho-lesterol levels of⬍70 mg/dL have been suggested as a treatment goal for adults with cardiovascular disease.25
To examine LDL cholesterol levels dur-ing follow-up monitordur-ing, we fit multi-level regression models with the lme package (linear mixed effects),26to
ac-count for within-subject correlations. Predictors in these models included age at initial examination, initial LDL cholesterol level, number of years of follow-up monitoring, race, gender, and interaction between initial LDL cholesterol level and years of follow-up monitoring. Subjects and years of follow-up monitoring were treated as random effects, and polynomials were used to model age and LDL cholesterol
levels. We calculated predicted LDL cholesterol levels according to the number of years after the initial deter-mination and the initial LDL cholesterol level.
RESULTS
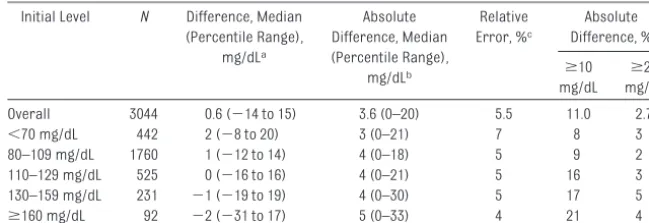
Table 1 shows the reproducibility of LDL cholesterol measurements for children and adults who had duplicate venipuncture samples in any of the cross-sectional studies. Among those 3044 persons, the intraclass correla-tion coefficient between replicate mea-surements was 0.956, and the median absolute difference between determi-nations was 3.6 mg/dL. Stratified anal-yses indicated that the median
abso-lute difference between replicates varied only slightly (3–5 mg/dL) with
the LDL cholesterol level. Of the 92 chil-dren with LDL cholesterol
determina-tions of ⱖ160 mg/dL, approximately
one-fifth had absolute differences be-tween replicate determinations of
ⱖ10 mg/dL, and 4% had differences of
ⱖ20 mg/dL.
Approximately one-half of the 6827
children were reexamined as adults, and Table 2 presents data on various characteristics. Subjects were exam-ined 5 times, on average, and 1397 in-dividuals were examinedⱖ6 times.
Ap-proximately 37% of the examined subjects were black. Participants were (Percentile Range),
mg/dLa
Difference, Median (Percentile Range),
mg/dLb
Error, %c Difference, % ⱖ10 mg/dL
ⱖ20 mg/dL
Overall 3044 0.6 (⫺14 to 15) 3.6 (0–20) 5.5 11.0 2.7
⬍70 mg/dL 442 2 (⫺8 to 20) 3 (0–21) 7 8 3
80–109 mg/dL 1760 1 (⫺12 to 14) 4 (0–18) 5 9 2
110–129 mg/dL 525 0 (⫺16 to 16) 4 (0–21) 5 16 3
130–159 mg/dL 231 ⫺1 (⫺19 to 19) 4 (0–30) 5 17 5
ⱖ160 mg/dL 92 ⫺2 (⫺31 to 17) 5 (0–33) 4 21 4
aPercentile range indicates the 2.5th to 97.5th percentile range. bAbsolute values of the differences.
cThe median absolute difference divided by the mean of the 2 measurements. The median LDL cholesterol level among these 3044 subjects was 94 mg/dL (range: 27–321 mg/dL).
TABLE 2 Study Population Characteristics
Child (⬍18 y) Adult (ⱖ18 y) All
No. of subjectsa 6827 3410
Female, % 51
Black, % 37
Age, mean⫾SD, y 11.4⫾4 27.0⫾7
Examination years 1973–1994 1982–2002
BMI, mean⫾SD, kg/m2 18.9⫾4 26.1⫾6
Overweight, %b 12 24
Obese, %b 9 22
Total cholesterol level, mg/dL 161⫾29 180⫾38
High-density lipoprotein cholesterol level, mg/dL 60⫾19 50⫾17
LDL cholesterol level, mg/dL 92⫾25 115⫾33
ⱖ130 mg/dL, % (n) 7.9 (1562) 29.5 (2067)
ⱖ160 mg/dL, % (n) 1.4 (281) 9.4 (661)
ⱖ190 mg/dL, % (n) 0.3 (51) 2.4 (168)
aThere were a total of 26 748 examinations among the 6827 subjects, all of whom were examined as children; 3410 of those subjects also were examined at least once at⬎18 years of age. Data for all characteristics, with the exception of race and gender, were based on all examinations that were conducted in childhood or adulthood.
relatively heavy, with⬃21% of the
chil-dren and⬃46% of the adults
consid-ered to be overweight or obese. Among children, the mean LDL cholesterol level was 92 mg/dL, and the prevalence of elevated levels was as follows: levels ofⱖ130 mg/dL, 8%; levels ofⱖ160 mg/ dL, 1%; levels ofⱖ190 mg/dL, 0.3%. Ap-proximately 30% of adults had LDL cho-lesterol levels ofⱖ130 mg/dL, and 2% had levels ofⱖ190 mg/dL.
Figure 1 shows smoothed (lowess) lev-els of LDL cholesterol according to age for each race/gender group. This anal-ysis, which did not account for the lon-gitudinal structure of the data, is shown only to illustrate age-related changes. Levels of LDL cholesterol tended to decrease between the ages of 10 and 15 years and subsequently showed large increases (⬃30 – 40 mg/ dL) into adulthood. The observed gen-der and race differences varied ac-cording to age. Among children, girls had higher LDL cholesterol levels than did boys; among adults, however, LDL cholesterol levels were higher among white men than among white women.
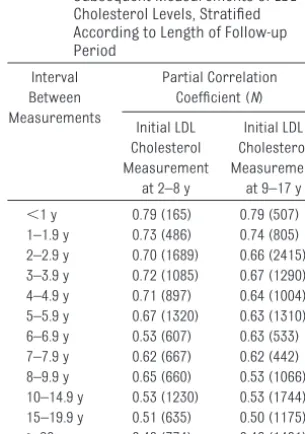
Correlations between initial and sub-sequent levels of LDL cholesterol, stratified according to initial age and the interval between measurements, are shown in Table 3. The magnitude of the association between LDL
choles-terol levels decreased, but at a fairly slow rate, as the follow-up period in-creased. For example, correlations be-tween LDL cholesterol levels werer⫽
0.79 (in both age groups) for measure-ments performed within 1 year of each
other andr⫽0.62 for measurements
performed 7 years apart. There were,
however, moderate correlations (r⫽
0.46 – 0.48) between LDL cholesterol determinations that were separated byⱖ20 years.
Despite the moderate/high correla-tions between serial LDL cholesterol determinations, a large proportion of children with very high LDL cholesterol levels had substantially lower levels at the next examination (Table 4). (Table 4 is based on all consecutive LDL choles-terol determinations.) Among those determinations, 95% of determina-tions (2859 of 2996 determinadetermina-tions) that were initially below 70 mg/dL re-mained below 110 mg/dL at the next examination. In contrast, of the 44
de-terminations that were ⱖ190 mg/dL,
only 39% remained above that cutoff point at reexamination. Only 4 of those 44 very elevated LDL cholesterol deter-minations were below 130 mg/dL at the next examination. Of the 201 deter-minations that were initially between 160 and 189 mg/dL, 132 (66%) were be-low 160 mg/dL and 25% were bebe-low 130 mg/dL at the next examination.
Table 4 also shows the mean changes in LDL cholesterol levels from the ini-tial examination to the subsequent ex-amination, as well as the mean levels at the subsequent examination. There was a strong inverse association be-tween the initial LDL cholesterol levels and the observed changes between ex-aminations. Persons with low LDL cho-lesterol levels (levels of ⬍70 mg/dL) showed a mean increase of 13 mg/dL, but there were mean decreases of 21 mg/dL (levels of 160 –189 mg/dL) and
34 mg/dL (levels of ⱖ190 mg/dL)
among persons in the 2 upper LDL cho-lesterol level categories,. In addition, the variability of the LDL cholesterol changes among persons with initial LDL cholesterol levels ofⱖ190 mg/dL was very large; the SD was 56 mg/dL, and the 10th and 90th percentiles of the LDL cholesterol level changes were ⫺79 mg/dL and 16 mg/dL, respectively. FIGURE 1
Gender- and race-specific levels of LDL cholesterol according to age. Data were treated as cross-sectional, and lines were smoothed by using lowess (locally weighted scatterplot smoother).
TABLE 3 Correlations Between First and Subsequent Measurements of LDL Cholesterol Levels, Stratified According to Length of Follow-up Period
Interval Between Measurements
Partial Correlation Coefficient (N)
Initial LDL Cholesterol Measurement
at 2–8 y
Initial LDL Cholesterol Measurement
at 9–17 y
⬍1 y 0.79 (165) 0.79 (507)
1–1.9 y 0.73 (486) 0.74 (805)
2–2.9 y 0.70 (1689) 0.66 (2415)
3–3.9 y 0.72 (1085) 0.67 (1290)
4–4.9 y 0.71 (897) 0.64 (1004)
5–5.9 y 0.67 (1320) 0.63 (1310)
6–6.9 y 0.53 (607) 0.63 (533)
7–7.9 y 0.62 (667) 0.62 (442)
8–9.9 y 0.65 (660) 0.53 (1066)
10–14.9 y 0.53 (1230) 0.53 (1744)
15–19.9 y 0.51 (635) 0.50 (1175)
ⱖ20 y 0.48 (774) 0.46 (1401)
A child with multiple measurements could be included in the analyses several times, depending on the ages at the serial examinations. Correlations were between a child’s initial LDL cholesterol level and the first determination in the specified interval. Values are partial correlation coefficients (adjusted for gender, race, and initial age) between the initial and subsequent LDL cholesterol levels.
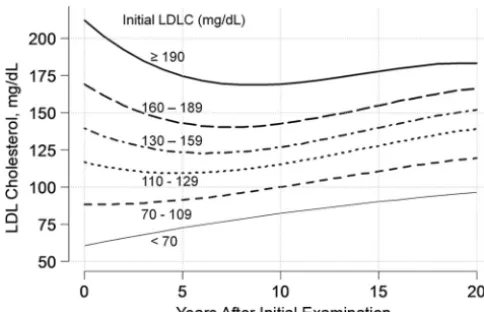
Figure 2 shows predicted LDL choles-terol levels, on the basis of multilevel models, according to baseline LDL cho-lesterol determinations and the num-ber of years after the initial measure-ment. Predicted levels are shown for children who had initial LDL choles-terol levels that were at the mean of each of the 6 categories. LDL choles-terol levels among children in the low-est category (levels of⬍70 mg/dL) in-creased almost linearly over the 20 years of follow-up monitoring, from
⬃60 mg/dL to 96 mg/dL. Despite the
tendency for LDL cholesterol levels to increase with age, however, mean lev-els among children in the 2 upper LDL cholesterol level categories (levels of
160 –189 mg/dL and ⱖ190 mg/dL)
were higher at the initial examination
than after 20 years of follow-up moni-toring. For example, the predicted LDL cholesterol level after 20 years for children who had initial LDL cho-lesterol levels of 212 mg/dL (the mean for the category of LDL
choles-terol levels ofⱖ190 mg/dL) was 183
mg/dL. In general, LDL cholesterol level differences between the 6 cate-gories narrowed substantially dur-ing the follow-up period. There was a difference of 161 mg/dL (212 mg/dL
[highest category]⫺61 mg/dL
[low-est category]) between the 2 ex-treme LDL cholesterol categories at baseline, but the predicted differ-ence in the mean LDL cholesterol lev-els between these categories was 87
mg/dL (183 mg/dL ⫺ 96 mg/dL) 20
years later.
DISCUSSION
A single LDL cholesterol measurement among children and adolescents pre-dicts subsequent levels,4–8,19,27,28 and
we found moderately strong tracking for LDL cholesterol levels. Intraindi-vidual correlations between LDL cho-lesterol determinations ranged fromr
⬃0.8 for measurements made within
the same year tor⬃0.5 for intervals of⬎20 years. However, most children who were identified as having
ex-tremely high (ⱖ160 or ⱖ190 mg/dL)
LDL cholesterol levels had substan-tially lower levels at the next determi-nation. During the 4-year interval, on average, between examinations, mean LDL cholesterol levels decreased by 21 mg/dL (initial LDL cholesterol levels be-tween 160 and 189 mg/dL) or 34 mg/dL
(initial levels of ⱖ190 mg/dL).
Al-though for the most part children with extremely high LDL cholesterol levels had high levels at reexamination, the changes in LDL cholesterol levels that occurred between examinations would have altered the recommend-ed10 dietary or pharmacologic
inter-ventions for many children.
The correlations between serial LDL cholesterol determinations in the cur-rent study are similar to those re-ported by others.4,5,7,27 For example, a
previous analysis of data for children (2–10 years of age at baseline) in the Bogalusa Heart Study4reported
corre-lations ofr⫽0.70 over a 3-year inter-val andr⫽0.60 over an 8-year inter-val. Several studies also found that FIGURE 2
Predicted levels of LDL cholesterol according to number of years after the initial LDL cholesterol (LDLC) measurement. Years of follow-up monitoring and subject were treated as random effects, and the interaction between LDL cholesterol levels, modeled by using orthogonal polynomials, and years of follow-up monitoring was included in the model. Predicted LDL cholesterol levels are shown for children who had initial levels at the means of each of the 6 LDL cholesterol level groups.
Between Examinations, Mean⫾SD, mg/dL
Examination, Mean⫾SD, mg/dL
⬍110 mg/dL 110–129 mg/dL 130–159 mg/dL 160–189 mg/dL ⱖ190 mg/dL
⬍70 mg/dL 2996 2859 (95) 102 (3) 29 (1) 4 (0) 2 (0) 13⫾19 73⫾20
70–109 mg/dL 9923 7871 (79) 1357 (14) 584 (6) 90 (1) 21 (0) 5⫾22 94⫾23
110–129 mg/dL 2164 1024 (47) 671 (31) 377 (17) 78 (4) 14 (1) ⫺5⫾24 114⫾24
130–159 mg/dL 1014 253 (25) 333 (33) 319 (32) 89 (9) 20 (2) ⫺14⫾26 128⫾27
160–189 mg/dL 201 15 (8) 35 (17) 82 (41) 48 (24) 21 (10) ⫺21⫾31 150⫾31
ⱖ190 mg/dL 44 3 (7) 1 (2) 10 (23) 13 (30) 17 (39) ⫺34⫾56 181⫾51
large proportions of children who ini-tially had high LDL cholesterol levels had lower levels at reexamination.4–8,19,27The
cutoff points for classifying children’s LDL cholesterol levels as high varied across these studies, being based on levels in the upper quintile,4,6,27in the
upper decile,5,7above 130 mg/dL,8 or
above cutoff points that varied from 135 to 155 mg/dL across gender and age groups.19
The substantial decreases in LDL
cho-lesterol levels that we observed
among children who had very high LDL cholesterol levels were attributable in part to the extremely high cutoff points identified in the 2008 report by the
American Academy of Pediatrics.10
Only 1.4% of the children in the current study had LDL cholesterol levels of
ⱖ160 mg/dL, and only 0.3% had levels ofⱖ190 mg/dL. (LDL cholesterol levels
of 160 mg/dL were in the⬃99th
per-centile for 12- to 17-year-old subjects in the National Health and Nutrition Ex-amination Survey in 1999 –2004.29) The
magnitude of regression to the mean, in which a subsequent determination is closer to the mean than is the ini-tial value, depends on intraindividual variations (including both biological and laboratory variations) and the distance of the initial measurement from the mean. There is more re-gression if the initial measurement is far from the mean and if the cor-relation between serial measure-ments is weak.
The mean⫾SD for LDL cholesterol lev-els among children in the current
study was 92⫾25 mg/dL, and
regres-sion to the mean could account for the longitudinal changes we observed. On the basis of regression to the mean, a child with an initial LDL cholesterol level of 167 mg/dL (3 SDs above the mean) would be expected to have a level at reexamination of 92 [overall
mean]⫹(3 [number of SDs from the
mean for the initial measurement]⫻
25 [SD]⫻r[correlation coefficient]) mg/dL.30If the child was reexamined
after a period of 4 years, thanrwould be 0.64 (Table 3) and the expected LDL cholesterol level at reexamination would be 140 mg/dL, a decrease of 27 mg/dL. It also can be estimated31,32that
the mean decrease among children who initially had LDL cholesterol levels
ofⱖ160 mg/dL would be 22 mg/dL, a
value similar to the decrease we ob-served among children who initially had LDL cholesterol levels of 160 to 189 mg/dL (Table 4). Regression to the mean also applies to low levels of biological characteristics, and we found that children who had initial
LDL cholesterol levels of⬍70 mg/dL
showed a mean increase of 13 mg/dL at reexamination.
There is substantial intraindividual variability in lipid and lipoprotein
con-centrations,13 with measured levels
varying from day to day12,33,34and even
from hour to hour.35Most of this
vari-ability is attributable to biological and not analytical variation.33,36 It also
seems that the magnitude of LDL cho-lesterol tracking among children de-creases most rapidly within days after the initial determination, with ob-served correlations among children
decreasing fromr⫽0.996 for
dupli-cate samples tor⫽0.97 at 2 days and
r⫽ 0.85 at 7 days.34Because of this
biological variability, several investi-gators have emphasized the need to obtain multiple determinations to characterize a person’s true, long-term, LDL cholesterol status.13,36,37
Al-though measurement errors can be reduced with more-accurate labora-tory methods, the inherent biological variability in LDL cholesterol deter-minations will always be present.
Ad-ditional characteristics, such as
family history and BMI, may help to identify children who are likely to have high LDL cholesterol levels in adulthood.8
A limitation of our study is that the me-dian period between examinations
was ⬃3 years, an interval that is
longer than that between office visits
for children and adolescents; a
shorter interval would be associated with less regression to the mean. The correlation between LDL cholesterol determinations made within 1 year wasr⫽0.80 (Table 3), and it can be estimated that the mean LDL choles-terol level of a child with a level of 167 mg/dL would decrease by 15 mg/dL during a 1-year period, rather than by an estimated 27 mg/dL over 4 years. Although laboratory errors also con-tribute to regression to the mean, all LDL cholesterol determinations in our study were conducted in a single labo-ratory in which levels were obtained by using heparin-calcium precipitation and electrophoresis16and the
repro-ducibility was very high; the median difference between blind duplicate samples from children with initial
de-terminations ofⱖ160 mg/dL was only
⫺2 mg/dL (Table 1). It is possible, how-ever, that there would be larger mea-surement errors among children ex-amined at office visits. LDL cholesterol levels likely would be reported from many laboratories by using the Friede-wald equation, in which triglyceride levels are divided by 5 to provide an estimate of very low-density lipopro-tein cholesterol levels.38 Those LDL
cholesterol measurements would be influenced by the large biological vari-ability inherent in triglyceride levels, with levels fluctuating up to 40% around the mean value,39which might
result in extreme LDL cholesterol levels at office visits showing more regression to the mean than we observed.
CONCLUSIONS
Despite the moderate/strong tracking of LDL cholesterol levels, we found that children with very high LDL cholesterol
levels (ⱖ160 mg/dL) were likely to
attribute these changes, which may be entirely attributable to regression to the mean, automatically to changes in diet or physical activity. Although the subsequent LDL cholesterol levels for most of these children would remain elevated, many children would be
LDL cholesterol levels.10Practitioners
should be aware of the large effects of regression to the mean among chil-dren with very high LDL cholesterol lev-els and should understand that multi-ple determinations may be needed to characterize a child’s true LDL
choles-lesterol levels can be strongly influ-enced by regression to the mean.
ACKNOWLEDGMENT
This work was supported by National Institute on Aging Grant AG16592.
REFERENCES
1. Enos WF, Holmes RH, Beyer J. Landmark
ar-ticle, July 18, 1953: coronary disease among United States soldiers killed in action in Korea: preliminary report.JAMA. 1986; 256(20):2859 –2862
2. Newman WP III, Freedman DS, Voors AW,
et al. Relation of serum lipoprotein levels and systolic blood pressure to early atherosclerosis: the Bogalusa Heart Study.
N Engl J Med.1986;314(3):138 –144 3. McGill HC Jr, McMahan CA, Malcom GT,
Oalmann MC, Strong JP. Effects of serum
lipoproteins and smoking on atherosclero-sis in young men and women.Arterioscler Thromb Vasc Biol.1997;17(1):95–106 4. Freedman DS, Shear CL, Srinivasan SR,
Web-ber LS, Berenson GS. Tracking of serum
lip-ids and lipoproteins in children over an 8-year period: the Bogalusa Heart Study.
Prev Med.1985;14(2):203–216
5. Lauer RM, Lee J, Clarke WR. Predicting adult cholesterol levels from measurements in childhood and adolescence: the Muscatine
Study. Bull N Y Acad Med.1989;65(10): 1127–1142
6. Porkka KV, Viikari JS, Taimela S, Dahl M, Akerblom HK. Tracking and predictiveness of serum lipid and lipoprotein
measure-ments in childhood: a 12-year follow-up: the Cardiovascular Risk in Young Finns study.
Am J Epidemiol.1994;140(12):1096 –1110 7. Laskarzewski P, Morrison JA, deGroot I, et
al. Lipid and lipoprotein tracking in 108 chil-dren over a four-year period.Pediatrics.
1979;64(5):584 –591
8. Bao W, Srinivasan SR, Wattigney WA, Bao W,
Berenson GS. Usefulness of childhood low-density lipoprotein cholesterol level in pre-dicting adult dyslipidemia and other
cardio-vascular risks: the Bogalusa Heart Study.
Arch Intern Med.1996;156(12):1315–1320 9. Stigler SM. Regression towards the mean,
historically considered.Stat Methods Med Res.1997;6(2):103–114
10. Daniels SR, Greer FR; American Academy of
Pediatrics, Committee on Nutrition. Lipid
screening and cardiovascular health in childhood.Pediatrics.2008;122(1):198 –208 11. Ford ES, Li C, Zhao G, Mokdad AH. Concentra-tions of low-density lipoprotein cholesterol and total cholesterol among children and adolescents in the United States. Circula-tion.2009;119(8):1108 –1115
12. Elveback LR, Weidman WH, Ellefson RD.
Day-to-day variability and analytic error in de-terminations of lipids in children.Mayo Clin Proc.1980;55(4):267–269
13. Smith SJ, Cooper GR, Myers GL, Sampson EJ. Biological variability in concentrations of serum lipids: sources of variation among results from published studies and com-posite predicted values.Clin Chem. 1993; 39(6):1012–1022
14. Tolfrey K, Campbell IG, Jones AM. Intra-individual variation of plasma lipids and li-poproteins in prepubescent children.Eur J Appl Physiol Occup Physiol. 1999;79(5): 449 – 456
15. Berenson GS, McMahan CA. Cardiovascular Risk Factors in Children: The Early Natural History of Atherosclerosis and Essential Hy-pertension. New York, NY: Oxford University Press; 1980
16. Srinivasan SR, Frerichs RR, Webber LS, Be-renson GS. Serum lipoprotein profile in chil-dren from a biracial community: the Boga-lusa Heart Study. Circulation.1976;54(2): 309 –318
17. Croft JB, Webber LS, Parker FC, Berenson GS. Recruitment and participation of chil-dren in a long-term study of cardiovascu-lar disease: the Bogalusa Heart Study, 1973–1982.Am J Epidemiol.1984;120(3): 436 – 448
18. Li S, Chen W, Srinivasan SR, et al. Child-hood cardiovascular risk factors and ca-rotid vascular changes in adulthood: the B o g a l u s a H e a r t S t u d y . J A M A . 2 0 0 3 ; 290(17):2271–2276
19. Magnussen CG, Raitakari OT, Thomson R, et al. Utility of currently recommended pediatric dyslipidemia classifications in predicting dyslipidemia in adulthood:
evi-dence from the Childhood Determinants of Adult Health (CDAH) Study, Cardiovas-cular Risk in Young Finns Study, and Bogalusa Heart Study.Circulation.2008; 117(1):32– 42
20. Webber LS, Cresanta JL, Croft JB, Sriniva-san SR, Berenson GS. Transitions of car-diovascular risk from adolescence to young adulthood: the Bogalusa Heart Study, part II: alterations in anthropomet-ric blood pressure and serum lipoprotein variables. J Chronic Dis. 1986;39(2): 91–103
21. Kuczmarski RJ, Ogden CL, Grummer-Strawn LM, et al. CDC growth charts: United States.
Adv Data.2000;(314):1–27
22. Kuczmarski RJ, Ogden CL, Guo SS, et al. 2000 CDC growth charts for the United States: methods and development.Vital Health Stat 11.2002;(246):1–190
23. R Development Core Team.R: A Language and Environment for Statistical Computing. Vienna, Austria: R Foundation for Statistical Computing; 2010
24. Cleveland WS. Visualizing Data. Summit, NJ: Hobart Press; 1993
25. Colhoun HM, Betteridge DJ. Treatment of lipid disorders in patients with diabetes.
Curr Treat Options Cardiovasc Med.2006; 8(1):37– 45
26. Bates D, Maechler M. lme4: linear mixed-effects models using S4 classes. Available at: http://cran.r-project.org/web/packages/ lme4/index.html. Accessed June 3, 2010
27. Orchard TJ, Donahue RP, Kuller LH, Hodge PN, Drash AL. Cholesterol screening in childhood: does it predict adult hypercho-lesterolemia? The Beaver County experi-ence.J Pediatr.1983;103(5):687– 691 28. Sanchez-Bayle M, Gonzalez-Requejo A,
Ruiz-Jarabo C, et al. Serum lipids and apoli-poproteins in Spanish children and adolescents: a 5 year follow-up.Acta Paedi-atr.1996;85(3):292–294
30. Cole TJ. Conditional reference charts to as-sess weight gain in British infants.Arch Dis Child.1995;73(1):8 –16
31. Davis CE. The effect of regression to the mean in epidemiologic and clinical studies.
Am J Epidemiol.1976;104(5):493– 498 32. Chuang-Stein C, Tong DM. The impact and
implication of regression to the mean on the design and analysis of medical investi-gations.Stat Methods Med Res.1997;6(2): 115–128
33. Bookstein L, Gidding SS, Donovan M, Smith FA. Day-to-day variability of serum choles-terol, triglyceride, and high-density li-poprotein cholesterol levels: impact on the assessment of risk according to the National Cholesterol Education Program
guidelines.Arch Intern Med.1990;150(8): 1653–1657
34. Porkka KV, Viikari JS, Akerblom HK. Short-term intra-individual variation and long-term tracking of serum lipid levels in children: the Cardiovascular Risk in Young Finns Study.Atherosclerosis.1994;105(1): 63– 69
35. Statland BE, Winkel P. Variations of choles-terol and total lipid concentrations in sera of healthy young men: differentiating ana-lytic error from biologic variability.Am J Clin Pathol.1976;66(6):935–943
36. Cooper GR, Myers GL, Smith SJ, Schlant RC. Blood lipid measurements: variations and practical utility.JAMA.1992;267(12): 1652–1660
37. Gillman MW, Cupples LA, Moore LL, Ellison RC. Impact of within-person variability on identify-ing children with hypercholesterolemia: Fra-mingham Children’s Study.J Pediatr.1992; 121(3):342–347
38. Friedewald W, Levy R, Fredrickson D. Estima-tion of the concentraEstima-tion of low-density li-poprotein cholesterol in plasma, without use of the preparative ultracentrifuge.Clin Chem.1972;18(6):499 –502
39. Rifai N, Dufour D, Cooper G. Preanalytical variations in lipid, lipoprotein, and apoli-poprotein testing. In: Rifai N, Warnick GR, eds.Methods for Clinical Laboratory Mea-surement of Lipid and Lipoprotein Risk Fac-tors. Washington, DC: AACC Press; 1991: 17–31
Regenerative Medicine: Still a Lung Way to Go:Recent articles in Science and Nature Medicine have described recent developments in the field of regenera-tive medicine. According to an article inThe Wall Street Journal(Naik G, June 25, 2010) scientists at Yale dissolved all the cells in the lungs of dead adult rats and left behind a matrix of collagen and other proteins as well as underlying airway and vascular system structure. Lung cells from rat fetuses were then injected into this matrix and within days they had differentiated in this matrix into rat lung that was able to demonstrate good gas exchange for 45 to 120 minutes in live rats. A similar type or work was done at the Massachusetts General Hospital creating a rat liver, and in 2008 University of Minnesota researchers were able to create a beating heart from primitive fetal cells in the lab. While these exper-iments are exciting, especially given organ transplant shortages, investigators believe it could be years or even decades before such experiments will be tried on people. Nonetheless it appears the field of regenerative medicine is one undergoing substantial growth and development and is worth reading about as studies in this area increase.
Noted by JFL, MD
DOI: 10.1542/peds.2009-3454 originally published online July 19, 2010;
2010;126;266
Pediatrics
Srinivasan and Gerald S. Berenson
David S. Freedman, Y. Claire Wang, William H. Dietz, Ji-Hua Xu, Sathanur R.
Services
Updated Information &
http://pediatrics.aappublications.org/content/126/2/266
including high resolution figures, can be found at:
References
http://pediatrics.aappublications.org/content/126/2/266#BIBL
This article cites 32 articles, 10 of which you can access for free at:
Permissions & Licensing
http://www.aappublications.org/site/misc/Permissions.xhtml
in its entirety can be found online at:
Information about reproducing this article in parts (figures, tables) or
Reprints
http://www.aappublications.org/site/misc/reprints.xhtml
DOI: 10.1542/peds.2009-3454 originally published online July 19, 2010;
2010;126;266
Pediatrics
Srinivasan and Gerald S. Berenson
David S. Freedman, Y. Claire Wang, William H. Dietz, Ji-Hua Xu, Sathanur R.
Among Children
Changes and Variability in High Levels of Low-Density Lipoprotein Cholesterol
http://pediatrics.aappublications.org/content/126/2/266
located on the World Wide Web at:
The online version of this article, along with updated information and services, is
by the American Academy of Pediatrics. All rights reserved. Print ISSN: 1073-0397.