DEPARTMENT OF
FOR THE GENERATION OF FACIAL SURFACE
MODELS
by
F a u stin A g rip a S itim a B a n d a
Ju n e, 1994
DEPT. OF PHOTOGRAMMETRY & SURVEYING
UNIVERSITY COLLEGE LONDON
GOWER STREET
LONDON. WCIE 6BT
Thesis submitted for Doctor of Philosophy Degree
All rights reserved
INFORMATION TO ALL USERS
The quality of this reproduction is dependent upon the quality of the copy submitted. In the unlikely event that the author did not send a complete manuscript and there are missing pages, these will be noted. Also, if material had to be removed,
a note will indicate the deletion.
uest.
ProQuest 10105604
Published by ProQuest LLC(2016). Copyright of the Dissertation is held by the Author. All rights reserved.
This work is protected against unauthorized copying under Title 17, United States Code. Microform Edition © ProQuest LLC.
ProQuest LLC
789 East Eisenhower Parkway P.O. Box 1346
Three dimensional information about the human face is o f importance, not only for medical diagnostic purposes, but also as input to facial recognition systems and, more recently, for the entertainment industry. The orthodontic surgeon in particular needs quantitative information about the average sizes and relations o f the constituent parts of the human face as a whole or parts of it.
A num ber o f methods including a m atrix o f m echanical probes, lasers, holography. Moire fringe patterns and stereophotogrammetry have been investigated as possible ways in which three dimensional records of human heads could be made. Each method has its own merits and demerits ranging from accuracy requirements, safety factor to the subject, complexity and cost of analysis.
CONTENTS.
D E D I C A T I O N . 3
A B S T R A C T . 4
C O N T E N T S . 5
LIST OF F I G U R E S... 10
LIST OF T A B L E S... 13
LIST OF P L A T E S... 14
A B B R E V I A T I O N S... 15
A C K N O W L E D G E M E N T S . 16 1 . I N T R O D U C T IO N . 1.1 T hesis B ackground. ... 18
1.2 T h esis p la n ... 20
2 . THE NEED FOR THREE DIMENSIONAL FACIAL DATA IN ORTHODONTICS. 2.1 In tro d u c tio n ... 23
2.2 Conventional orthodontic and maxillo-facial surgical p ro ced u res. ... 24
2.2.1 A ids to d ia g n o sis... 25
2.3 M otivation and aims of this research w ork... 30
3 . LITERATURE REVIEW. 3.1 W hat is photogram m etry? ... 31
3.1.1 C lose range photogram m etry... 31
3.2 Close range image data acquisition system s... 32
3.3 Film based (analogue) cam eras... 33
3.3.1 C onventional m etric cam eras. ... 34
3.3.2 R eseau c a m e ra s... 35
3.3.3 N on-m etric cam e ra s... 36
3.3 .4 Calibration methods for analogue cam eras... 37
3.4 C harge-coupled device (CCD) cam eras... 43
3.4.1 S ensor arch itectu re. ... 43
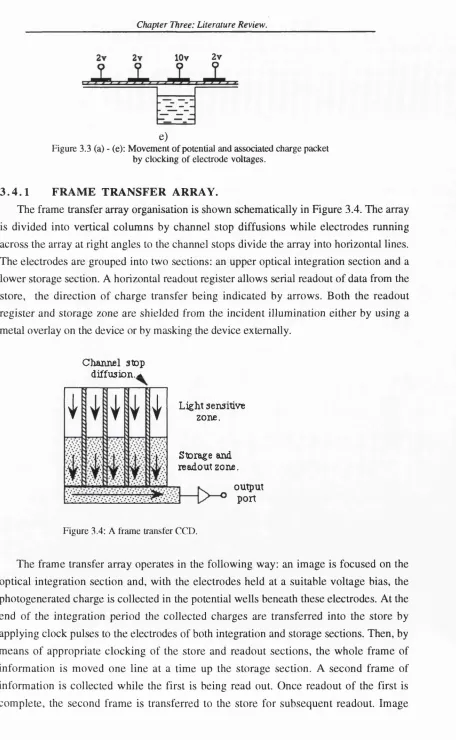
3.4.1.1 Fram e tran sfer arrays... 45
3.4.2 Interline tran sfer a rray s... 46
3.4.3 Performance and pitfalls of digital imaging system s... 47
3.4.3.2 C hoice of o b jects/targ ets... 49
3 .4.3.3 O ptics. 49 3 .4 .3 .4 Sensor. 50 3 .4.3.5 C am era e le c tro n ic s... 51
3.4.3.6 Fram e grabber. ... 51
3.4.3.7 Signal transm ission and synchronization. ... 52
3.4.3.8 T e m p e ra tu re ... 53
3.4.4 Calibration procedures for CCD cam eras... 53
3.4.4.1 C alibrating the principal point... 54
3.5 Digital photogrammetry and image processing... 54
3.5.1 D igital im age. ... 55
3.5.2 W hy process image data digitally ? ... 56
3.5.3 Digital im age processing. ... 56
3.5.3.1 M arr's vision th e o ry ... 58
3.5.3.2 P rim al sk e tc h ... 59
3.5.3.3 2I /2-D s k e tc h ... 59
3.5.3.4 3-D m odel rep resen tatio n ... 61
3.5.4 Im age processing algorithm s... 61
3.5.5 F eature e x tra c tio n ... 65
4. FROM IMAGES TO SURFACES. 4.1 Im age form ation. ... 63
4.2 Surface point recovery from im ages... 67
4.2.1 Conventional photogram m etric m ethod... 69
4.2.1.1 A nalytical p lo tte rs ... 69
4 .2 .1 .2 The Kern D S R l analytical plo tter... 70
4 .2.1.3 The DEM data capture program ... 71
4.2.2 Stereom atching m eth od ... 73
4.2.2.1 Area based stereo-m atching techniques... 74
4.2.2.1.1 Least squares m atching techniques... 75
4 .2.2.2 Feature based stereo-m atching techniques... 77
4.2.2.2.1E dge based stereo-m atching... 78
4.3 Surface representation o f D EM s... 78
4.3.1 R epresentation stra teg ies... 80
4.3.1.1 G rid based m o d els... 80
4.3.1.2 T riangular based m odels... 82
4.3.1.2.1 The D elaunay approach... 83
4.4 S h ap e-from -sh ad ing . ... 86
4.4.1 Principles o f shape-from -shading... 87
5 . EQUIPMENT SETUP. 5.1 M otivation and ob jectiv es... 90
5.1.1 Advantages and disadvantages of photogram m etry... 91
5.2 E q u ip m en t se tu p ... 92
5.3 D esign c o n sid e ra tio n s... 95
5.3.1 C am eras. ... 95
5.3.2 L en ses. 95 5.3.3 D epth of fie ld ... 96
5.3.4 B ase-to -h ieg h t ra tio ... 97
5.4 C alibration targ et d esig n ... 99
5.4.1 B a c k g ro u n d ... 99
5.4.2 Target design and control point position determination... 101
5.5 Softw are u tiliz e d ... 104
5.5.1 Combined A djustment Program software (CAP)... 104
5.5.1.1 M athem atical fo rm u latio n ... 104
5.5.2 H eritable Image Processing System (H IPS)... 115
6. RESULTS AND ANALYSIS OF RESULTS. 6.1 In tro d u ctio n . ... 107
6.2 Fidelity test o f CCD cameras against tim e... 108
6.3 Model creation by the stereo matching method... 110
6.3.1 The Otto-Chau sheet growing stereo m atcher... 110
6.3.2 Stereo matching using manually generated seedpoints... 112
6.3.2.1 Histogram equalized images versus spatially averaged images 114 6 .3.2.2 Effects of varying grid spacing o f the projection grid... 114
6.3.3 Stereo matching using automatically generated seedpoints... 116
6.3.4 Optimizing the stereomatcher param eterisation... 119
6.3.5 Effects o f imaging geometry on number of iterations... 125
6.3.6 Pyram idal (coarse-to-fine) stereo m atching... 126
6.4 B undle ad ju stm en t... 131
6.4.1 O verview o f the problem ... 131
6.4.2 Formulation of the basic bundle solution... 133
6.4.3 C am era calibration using C A P... 136 6.4.4 Generating DEM test data using the Kern DSR-1
6.4.5 M odel creation from CCD im ages... 139
6.5 DEM accuracy assessm ent... 141
6.5.1 Factors affecting accuracy... 145
6.6 D elaunay trian g u la tio n ... 146
6.6.1 M o tiv a tio n ... 146
6.6.2 Program re q u ire m e n ts... 147
6.6.3 The Delaunay triangle surface m odel... 148
6.6.4 C hoice o f data stru ctures... 149
6.6.5 Program d e sc rip tio n ... 149
6.6.6 B u g s ... 150
6.6.7 Perform ance o f program ... 150
6.7 T exture m a p p in g ... 152
6.7.1 G enerating a texture mapped im age... 153
6.8 M odel V ie w ... 154
6.8.1 Influence o f PC architecture on M odel V iew ... 154
6.8.2 D esign p h ilo so p h y ... 157
6.8.3 Implem enting and using M odel View. ... 158
6.8.4 Data input and data structures... 159
6.9 Comparison of King's College London system with other systems. .. 160
6.9.1 The m oire fringe technique... 160
6.9.2 The m oire p ro c e ss... 161
6.9.3 St G eorge's H ospital imaging system ... 162
6.9.4 Com m ents on the m oire m ethod... 163
6.10 Laser triangulation technique. ... 164
6.10.1 University College London Medical Physics imaging system 164 6.10.2 Com m ents on the laser m ethod... 166
7 . CASE STUDY. 7.1 In tro d u c tio n ... 167
7.2 Soft tissue and skeletal relationship... 167
7.3 Case assessm ent. 168 8 . DISCUSSION AND CONCLUSION. 8.1 D is c u s sio n ... 172
8.2 Sources o f 3D volum etric data... 174
8.2.1 M ultim odality in teg ratio n ... 176
8.3 The quest for sp eed ... 178
8.4 C o n c lu sio n ... 178 8.5 F u tu re w o rk ... 179
GLOSSARY... 181
APPENDIX A.
Derivation and linearization o f the collinearity equations... 182
APPENDIX B.
Typical results o f the calibration procedure... 188
APPENDIX C.
Use of the ECDS system in target control point position
d e te rm in a tio n ... 195
APPENDIX D.
M odel V iew file fo rm at... 202
APPENDIX E.
Exam ples of DSR-1 m odel setup files... 204
APPENDIX F.
G lo ssary o f im ag es... 209
APPENDIX G.
M an p ag es. ... 213
L IS T O F F IG U R E S .
Figure 2.1: X-ray and photographic imaging geom etries... 26
Figure 2.2: Skeletal and soft tissue landmarks used on cephalometric x -ray tra c in g s ... 28
Figure 2.3: Facial profiles: a) concave profile b) straight profile and c) convex p ro file ... 29
Figure 3.1: Fiducial centre or indicated principal point of a 35mm film ... 35
Figure 3.2: C o llin earity c o n d itio n ... 38
Figure 3.3: Movement of potential and associated charge packet by clocking o f electrode v oltag es... 45
Figure 3.4: A fram e transfer C C D ... 45
Figure 3.5: An interline transfer C C D ... 46
Figure 3.6: Image acquisition with solid state imaging sensor... 48
Figure 3.7: Response curve for solid state sensor... 50
Figure 3.8: Typical image acquisition components of a frame grabber... 51
Figure 3.9: Symbohc inteiTelationship between the world, projection and im age d o m ains... 58
Figure 3.10: Different size LoG operators used to locate zero crossings... 60
Figure 4.1: Surface reflection properties showing a) specular b) glossy c) diffuse re fle c tio n ... 65
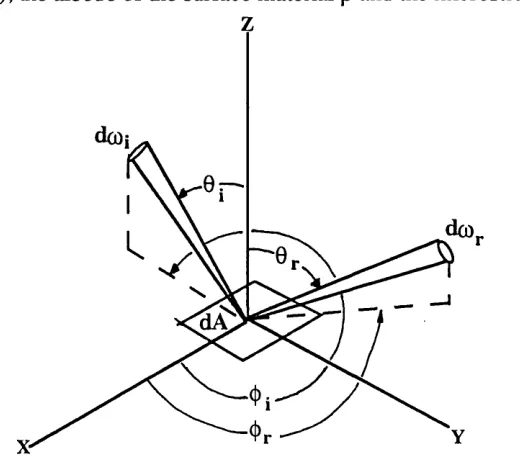
Figure 4.2: Beam geometiy showing the four angles needed to specify the B R D F ... 66
Figure 4.3: The imaging geometry showing showing the incident angle i, the viewing angle e and the phase angle g... 67
Figure 4.4: Relationship between disparity of a point and its distance from v ie w e r... 68
Figure 4.5: Random dot stereogram when viewed stereoscopically, the centre square floats above the ground... 69
Figure 4.6: The Kern DSR 1 analytical plotter system ... 71
Figure 4.7: M odes of data cap tu re ... 73
Figure 4.8: E p ip o lar c o n stra in t... 74
Figure 4.9: Rotational search for Thiessen neighbours to create Delaunay tria n g le s ... 84
Figure 4.10: Methods of surface display with respect to raw data set... 86
Figure 5.1: A plan view of camera setup for image acquisition... 93
Figure 5.2: C oncept o f depth o f fie ld ... 97
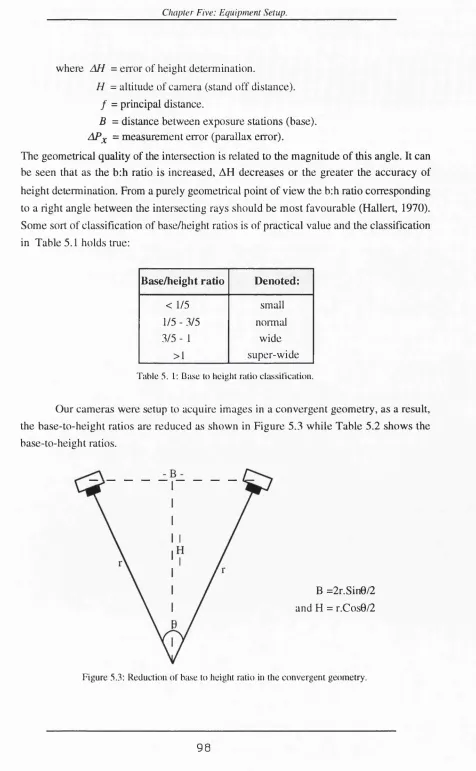
Figure 5.3: Reduction of base-to-height ratio in convergent geometry... 98
Figure 5.4: Constraint imposed by depth of field in convergent close
range p h o to g ram m etry ... 99 Figure 5.5: C alib ratio n ta rg e t... 102 Figure 5.6: Theodolite intersection by ECDS system. Sj and S2 are
th eo d o lite p o sitio n s ... 103 Figure 6.1: Dummy used for preliminary investigation... 107 Figure 6.2 Flow chart showing DEM production... 108 Figure 6.3: Sequence of images from one camera showing raw image
and centroids o f the blobs... 109 Figure 6.4: A plot of positional drift of control point number 1 with tim e 109 Figure 6.5: C oncept o f the G ruen algorithm ... 110 Figure 6.6: Figure show ing test p attern s... 113 Figure 6.7: Left images of the stereopairs of a) random pattern
b) grid pattern showing are successfully m atched... 113 Figure 6.8: Spatial resolution concept of CCD chip... 115 Figure 6.9: Automatic seed points automatically generated using Foersnter
o p e ra to r... 119 Figure 6.10: Probability distribution function of the relationship between patch
radius and num ber of iterations... 121 Figure 6.11: Relation between patch radius and processing tim e... 122 Figure 6.12: Probability distribution function of the relationship between patch
radius and eigenvalues... 122 Figure 6.13: Stereomatcher coverage using 5, 10 and 20 pixel patch radii 123 Figure 6.14: Bar diagram of eigenvalue distribution with respect to eigen
value limit. 125
Figure 6.15: Effect o f view angle on number of iterations... 126 Figure 6.16: A coarse-to-fine matching illustration... 127 Figure 6.17: A plot of CPU time against output of coarse-to-fine matching 128 Figure 6.18: An image pyramid as a multiresolution of an im age... 129 Figure 6.19: A one-dimensional example of smoothing a signal by different size
G au ssian k e rn e ls... 130 Figure 6.20: M ulti image photogrammetric netw ork... 132 Figure 6.21: Geometric basis of the bundle solution... 134 Figure 6.22: Illustration of the strip of the facial photography with
approximate distribution of some of the control points... 137 Figure 6.23: A facial model of the dummy generated from CCD images... 141 Figure 6.24: Histogram distribution of the DEM errors... 144 Figure 6.25: Two alternatives of spliting a quadrilateral into two triangles 147
Figure 6.26: Illustration of the triangulation procedure showing point P being
incorporated into the triangulation schem e... 148
Figure 6.27: Two models triangulated at different resolutions... 152
Figure 6.28: The texture m apping process... 154
Figure 6.29: Dos applications typically rely on MS-DOS and BIOS for their fundam ental requirem ents... 155
Figure 6.30: The structure of W indows N T ... 156
Figure 6.31: Direct video is a far more efficient approach to the display of im ages... 157
Figure 6.32: Schematic diagram summarizing the functions of model view 159 Figure 6.33: Moire fringes obtained by superimposing two patterns... 160
Figure 6.34 Moire imaging geometry with the two optical axes parallel and perpendicular to the b ase ... 161
Figure 6.35: Illustration of St George's imaging system ... 162
Figure 6.36: The University College London Medical Physics imagin system 165 Figure 7.1: V ariations in soft tissue profile... 168
Figure 7.2: Raw im age o f the subject... 169
Figure 7.3: Triangulated models of the subject at different view points... 169
Figure 8.1: Sensitivity or quantum efficiency of certain CCDs to light of different wavelength compared to other forms of light detectors 173 Figure A-1: Photograph in sp ac e ... 183
Figure A-2: Rotation and shift applied to the photograph... 183
Figure B-1: Quantities measured during calibration o f an aerial camera... 190
Figure B-2: Interaction between calibration and object photography... 191
Figure B-3: Plot of radial lens distortion of a Rollei 6006 focused at 2m ... 193
Figure B-4: The pixel and image co-ordinate system ... 194
Figure C-1: Theodolite intersection by the ECDS system. ... 196
LIST OF TABLES.
Table 2.1: Mean angular cephalometric values of Caucasians... Table 3.1: A comparison between close range photogrammetry and aerial survey. Table 5.1: B ase-to-height ratio classification... Table 5.2: Base-to-height ratio of the King's College London system... Table 6.1 : Stereomatcher results using manually generated seedpoints on 512x480 image with patch radius = 10, iterations = 10 and eigenvalue = 100. ... Table 6.2: Match points obtained with respect to vary projection grid spacing... Table 6.3: Foerstner and M oravec interest operator results... Table 6.4: Effect of reducing grid spacing on matched points... Table 6.5: Statistics resulting from varying patch radius on 512x480 image
on a Sunclassic. ... Table 6.6: Effect of varying eigenvalue lim it... Table 6.7: C oarse-to-fine matching results. ... Table 6.8: Results of muti-resolution matching on images preprocessed using
different sized gaussian masks. ... Table 6.9: N um ber o f observation equations... Table 6.10: Effects of manual and subpixel location of centres of targets on
num ber o f itera tio n s... Table 6.11: Statistics of DEM compared against points captured on the DSR-1
an aly tical plotter. ... Table 6.12: System accu racy... Table 6.13: Processing time to surface various numbers of points... Table 6.14: Statistics for different resolution surfaces generated using delaunay. ...
29 32 98 99
113 116 118 120
121
124 128
131 137
141
144 145 151 152
L IS T O F P L A T E S .
Plate 2.1: Illustration o f study model (cast)... 25 Plate 2.2: Photographic montage used in planning surgical procedures... 27 Plate 5.1 : Side views and dentention of patients with cranio-facial
m alfu n ctio n s. ... 90 Palte 5.2: System components. Top plate shows some of the imaging devices and
below the hydraulic lift used to raise the patients... 94 Plate 6.1: A colour coded stereomatched coverage showing associated
eigenvalues of matchpoints (blue/green = low eigenvalues
w hile orange/red = high eigenvalues)... 125 Plate 7.1 : Computer screen showing menu of Model View visualization suite 170 Plate 7.2: Screen shot o f triangulated facial display in M odelView... 170 Plate 7.3: Screen shot showing a display of profiles in Model V iew ... 171 Plate B .l: D epartm ental calibration field... 192 Plates C .l- C.2: Two of the three views of the facial calibration rig during
co-ordinate determination of the control points... 200
A B B R E V IA T IO N S .
BIOS Basic Input Output System.
BRDF Bidirectional Reflectance Distribution Function. CAP Combined Adjustment Program.
CAT Computer Assisted Tomography. CCD Charge-Coupled Device.
CMOS Complementary Metal Oxide Semiconductor. CPU Central Processing Unit.
DEM Digital Elevation Model. DSR Digital Stereo Restitution.
ECDS Electronic Co-ordinate Determination System. HIPS Heritable Image Processing System.
LED Light Emitting Diodes. LoG Laplacian of Gaussian.
MS-DOS Microsoft Disk Operating System. NMR Nuclear Magnetic Resonance.
PC Personal Computer.
PERS Photogrammetric Engineering and Remote Sensing. RISC Reduced Instruction Set Computer.
RMS Root Mean Square.
TSR Terminate and Stay Resident. mm Millimetre (10'^ meter). cm Centimetre (10"^ meter). |im micrometre (10‘6 meter).
A C K N O W L E D G E M E N T S .
Many people have contributed in one way or another towards the completion of this thesis. I am most grateful to my supervisor Prof J.P. M uller, [ Departm ent of Photogram m etry and Surveying, University College London], for his advice and guidance during the course o f the research work. His encouragement during the times I was demotivated was invaluable. I would also like to thank my co-supervisor M r S.N. Bhatia, [Head, Departm ent of Orthodontics, King's College Dental School] for his patience in explaining the medical problem and his guidance in formulating a solution.
Over the years many people in the Department of Photogrammetry and Surveying rendered assistance to me in one form or another. In particular my sincere gratitude goes to the Head o f the department. Prof I.A. Harley, and M r K.B. Atkinson who besides agreeing to correct my script, was more than just the Photogrammetry tutor. He was there for me whenever I had personal and academic problems. I would also like to thank the research assistants in the department especially Philip, Asad, Andy and Athula and other members of staff who I have been unable to mention individually. My special thanks to James, Richard, Kevin and Gordon.
During my research work I have had the privilege of m eeting a number of remarkable people who have had some influence on my work. One of these people is Candido from whom I was able to learn a lot about the personal computer after having been spoilt at UCL with the computing power available on Sun workstations. To my friends and associates like Li Kai, Taejung, Collins and D r Fastone Goma, I say thank you for the stimulating discussions we had and special thanks to D r M. Bukhary at King's College Hospital for allowing me the use of the images of his patients.
I would also like to express my profound gratitude to my wife for her support and sacrifices during my studies and to my daughter who never seemed to understand why I was rarely at home. And at home in Zambia, I am indebted to the numerous relatives and friends who kept me going with letters, parcels, phone messages and prayers. To all of you, I say thank you and God bless. Furthermore, thank you to my head of department in Zambia, Prof A. Bujakiewicz for her personal interest in my work and encouragement in the last years of my research.
Last but in no way the least, I would like to express my deep gratitude to my employers, the University of Zambia, for the time allowed me to pursue my studies and to the Swedish International Development Agency for financing my studies.
Above all, I praise God for giving me the health and inspiration even in my lowest hours.
CHAPTER ONE.
INTRODUCTION.
The application of methods of close range photogrammetry to the solution of medical or industrial measurement problems has become fairly well established over the past two decades. The extent of this can be seen by the availability of systems based on specially developed photogram m etric techniques. One o f photogram m etry's attractions as a metrology technique to surgeons and engineers is that the measurements are carried out indirectly. Classically, the object or phenomenon to be evaluated is photographed from two or more locations and the measurements are made on the overlapping photographs using a w ide range o f m ethods, ranging from sim ple scales (parallax bars) to sophisticated computer assisted equipment.
W hen dealing w ith m edical or en gineering p ro b lem s, the applicatio n o f photogrammetry demands a different approach from that needed from traditional map making. Objects are very much three dimensional in close range photogrammetry, rather than roughly planar as in aerial photogrammetry. More often than not, physical contact with the object is undesirable hence optical triangulation (passive or active) methods for depth determination are employed. Furthermore, close range photogrammetry is a lot more flexible with regard to targeting and illum ination and there are more ways of establishing measurement networks than would otherwise be available in map making applications in aerial photogrammetiy.
1.1
THESIS BACKGROUND.
This research work was mainly done in the D epartm ent of Photogram metry and Surveying at U niversity College London and to a lesser extent the D epartm ent of Orthodontics of King's College Dental School. The thesis reports on the design and construction of a facial imaging system for the provision of facial digital elevation models (DEMs) from which three dimensional information of the face can be extracted by using the software developed.
The process of medical diagnosis involves collecting and evaluating information gathered from a wide range of sources. In an increasing num ber of instances, this information is presented to the clinician in the form of a picture based on some physical property of the structure being investigated and any abstraction is done on the hard copies. Large amounts of discrete measurements between different points o f the human anatomy already exist for the design of well fitting prosthetic devices and for the construction of other devices like breathing masks (Lovesey, 1973). However, what has been lacking for some time are systems that would provide three dimensional information
of the human anatomy interactively. One area that can benefit from the availability of such a system is the area of human facial imaging. It's only of late that interest in developing accurate systems for the provision of three dimensional data o f the human face has resurfaced. This has been made possible with the advent of powerful computers with graphics capabilities, capable of processing and manipulating stereo-images with a view to replicating facial surfaces from which three dimensional data can be derived.
Prior to this work, attempts at generating facial models in the department had been made by Sigalingging (1988), Thomas, (1989) and Deacon, (1991). Sigalingging's work mainly focused on the geometric issues of such an imaging system based on analogue cameras. The system proposed by Sigalingging lacked three dimensional controls as it used planar scale rulers placed in the x and y directions and coordinates of conjugate points were determined by the use of the Kern DSR-1 analytical plotter. The procedure is slow and requires highly trained personnel. Thomas, (1989) used analogue images acquired from Sigalingging's setup and scan digitised by the use of the CCD cameras on the Kern D SR-11. He digitised the images and investigated the feasibility of using an area based stereomatcher to obtain disparity data. Thomas also developed a triangulation routine to display a wire frame of the facial model. U nfortunately, Thom as' work inherited the same deficiencies associated with the Sigalingging's approach; that of lacking three dimensional control. Deacon's work was more comprehensive. Instead of using analogue cameras. Deacon used two CCD cameras hence cutting the time wasted in processing film. Deacon addressed the control point pitfall associated with Sigalingging's and Thomas' work by using a purpose built calibration rig consisting of an array of light emmiting diodes (LED) embedded in two precisely engineered perpendicular planes. Cam era calibration was done using the Tsai calibration model (Tsai, 1986). He used an earlier version of the area based stereomatcher and the targetted dummy head described in section 5. to generate the disparity data. A relative R.M.S. accuracy of 0.5mm was obtained (Deacon et al, 1992). However, given that he only used two camera stations he was not able to generate a full facial model. There has been notable work taking place elsew here too. M ethods involving M oire fringe patterns (L eivesley, 1983), stereophotogrammetry (Vannier, 1991; Waldhausl e ta l, 1990) and contour photography (Segner, 1986) have been used with photographs being the medium of storing the facial records. Laser ( Coombes, 1991 ) and holographic techniques have been used too. Earlier safety concerns with lasers and the cost and complexity of associated equipment are improving hence more systems based on this principle should be expected as laser techniques mature. A comparison between laser techniques and stereophotogrammetric techniques is presented in section 6.9.
In situations where time is of the essence, traditional photogrammetric methods, though accurate, have one major weakness: that of time lag between image capture and when hard copies are available as a result of the developing process. Furthermore, specialized equipment and personnel are needed in order to extract the three dimensional information. W ith the availability o f charge-coupled device (CCD) cameras plugged into a frame grabber sitting on a computer, images of any structure will be grabbed at a press of a key. However, like any m easurement device, the CCD cameras have to be calibrated if meaningful results are to be obtained. Generally dedicated techniques and software have to be developed to process the images so as to obtain the information needed by the surgeon to plan and monitor a surgical procedure. A high degree o f automation is also required to minimise and preferably eliminate the need for highly skilled engineers.
It was in view of the non-availability of suitable imaging systems to provide three dim ensional facial inform ation in an orthodontic environm ent coupled w ith the encouraging results from earlier work in the department that as photogrammetrists, we felt that we could use techniques in the field of close range photogrammetry to develop a facial imaging system incorporating photogrammetric principles. At the outset some of the attributes of the system were the generation of all-round coverage of the complex head surface meeting an absolute accuracy requirement of 0.5mm r.m.s. The image acquisition time from the four cameras was limited to within 2 seconds. The visualization software would have options to vary DEM resolution and would have facilities to provide vital data like distances between points, profiles and variable view positions.
1 .2
THESIS PLAN.
This thesis consists of two sections, with the next three chapters falling under the first section and the last four chapters in the second. The first section introduces the theme of the research and presents a critical literature review whilst the second section contains the main body of the research.
First Section (Chapters 1 - 4).
Chapter one broadly introduces the motivation and objectives o f the research while chapter two presents standard clinical procedures used for the provision o f facial inform ation. Chapters three and four are a literature review on photogram m etric techniques developed over the years to extract three dimensional information from photographs (images). Chapter 3 concentrates on close range photogrammetric image acquisition systems. The review is hmited to characteristics and performance of analogue and digital (CCD) cameras. Chapter 4 looks at the techniques of extracting image co ordinates and the subsequent computation of three dim ensional co-ordinates from
disparity data. This chapter further looks at ways in which three dimensional co-ordinates are m anipulated to produce graphic visualizations o f the surfaces im aged on the photographs.
Second Section (Chapters 5 - 8).
The geometric design and hardware considerations of the imaging system are presented in Chapter five. This chapter addresses issues like the base-to-height ratio, choice of lenses, and computer hardware capabilities. Chapter six forms the bulk o f the second section. This chapter presents the results obtained from images captured by both analogue and CCD cameras and processed by the use of an area based stereomatcher and results obtained by the use of the Kern DSR-1 analytical plotter. An analysis of the results is carried out within chapter six. As well as a quantitative analysis of results, chapter six makes a qualitative comparison of the King's College system with a laser based system developed at University College London in the department of M edical Physics and a system based on Moire fringes being developed at St. George's Hospital, all for the provision of facial topographic information.
Chapter seven evaluates the usefulness of the system and interpretation o f the data generated in an orthodontic environment. The chapter explains how the system will assist in surgical management and planning and how the graphical output will be used by surgeons. The last chapter, chapter eight, comprises a discussion which considers where the research may progress in future and lastly a presentation o f the conclusions is presented which includes a summary of the original contributions made.
In addition to the eight chapters, there are six supporting appendices: a) Appendix A:
Derivation and linearization of the collinearity equations. b) Appendix B:
Theory and measurement of the three dimensional co-ordinates of the control points using the electronic coordinate determination system (ECDS).
c) Appendix C:
Typical results of the calibration procedure using the combined adjustment program (CAP).
d) Appendix D:
Model View file format. e) Appendix E.
Examples of DSR-1 model setup files.
f) Appendix F:
Glossary of images. g) Appendix G:
Manual pages of all of the software developed.
CHAPTER TWO.
THE NEED FOR THREE DIMENSIONAL FACIAL
DATA IN ORTHODONTICS.
2 .1 INTRODUCTION.
Clinicians in orthodontics and other associated medical fields have found a need for an accurate, reliable, and valid system for recording soft-tissues o f the human face. M easurable records o f soft-tissues can be o f use in various phases o f patient management, namely, case analysis, diagnosis, and treatment planning as well as in more obvious fields o f study, such as facial changes under growth and after orthodontic treatment or orthognathic surgery and during postretention reviews (Robertson and Volp, 1981). Unfortunately, traditional techniques currently in use utilize two dimensional projections of the face from which orthodontists and maxillo-facial surgeons obtain most of the relevant data.
Photogrammetry has been used in the study of the head, teeth, and jaws. This is mainly due to the importance placed on personal appearance and functional relationship of teeth. This area o f the human body has been addressed by photogrammetry more than any other area of the body due mainly to the reasons described in section 5.1.1. Orthodontists and oral surgeons have been very interested in photogrammetry due to procedures and results enabling them to obtain measurements of shape and changes in shape resulting from growth, surgery and dental treatment. W ictorin (1971) of Sweden, investigated the change of soft tissue contours of the face following surgical treatment of mandibular protrusion. Photographs o f the patients were taken before and after surgery with Nikkor stereometric camera and a Wild A7 stereoplotter was used to plot the facial contours. Natural points on the face such as facial spots were used as control points to allow comparison of facial plots made from the two sets o f photographs. W ith this procedure used, fixation of the head was not required. Analysis of surgically corrected faces was undertaken in the United States by using stereopairs taken before and after m axillofacial surgery (Berkow itz and Cuzzi, 1977). In this work the subject was positioned in a reference frame and three stereometric cameras, each equipped with an electronic strobe projector to enhance skin contrast, were used to obtain complete coverage of the face and head. Studies of this type have involved the use of conventional stereometric cameras and stereoplotters to enable the user to produce life-size contour plots of the face and to analyze information concerning facial changes.
Stereophotogram m etry has been explored by several researchers as a means of measuring the forms o f palates, of both normal and cleft palate subjects. Impressions of the palate are made from the living subjects and the plaster casts prepared.They then are used to acquire information concerning the shape and size o f the palate. By moving the plaster cast sideways between exposures, stereophotography of the palate was achieved by Berkowitz in 1971 by using a single metric camera. Stereophotogrammetry has been making it possible to analyze the shape and size of palates with far greater detail and accuracy than any other methods previously used. Investigations dealing with teeth configuration and tooth morphology have also been included in stereophotogrammetry. Methods for measuring the occlusal surface o f teeth and then obtaining contour plots is accomplished in the same manner as for the measurement o f palates. In 1967, Gruner developed a close-range camera system to obtain measurements of the mouth in order to control and determine changes in teeth configuration, gum, and bone tissue before and after surgery. A large number of points are measured on the tooth surface, which allows the surface to be described mathematically by a surface fitting technique. For this type of application stereophotogramm etry is considered to be superior to any conventional technique.
2 .2 CONVENTIONAL ORTHODONTIC AND MAXILLO-FACIAL
SURGICAL PROCEDURES.
The word orthodontics is derived from the Greek words op0oÇ meaning right or correct, and oSodto^ meaning tooth. A lthough quite correct, it is an inadequate description o f the subject as it is conceived today. Leighton et al (1976) define orthodontics as:
"the study of growth and development of the masticatory apparatus, and the prevention and treatment of abnormalities of this development."
Orthodontics is infinitely variable as each patient presents the orthodontist with a different problem. It is by studying these many and varied problems that the orthodontist increases his knowledge and it's this knowledge gained that enables him to plan treatment. It has been suggested that orthodontics is both an art and a science as part of the orthodontists concern is with aesthetics as it is to do with need for correcting dental oral relationship. As such the aims of orthodontics has grown to include overall facial appearance and harm ony rather than being lim ited to correction o f m alocclusion. W here as the orthodontic requirements are that the teeth and jaw s are repositioned to achieve a stable, aesthetic, and functional jaw and tooth relationship the patient's aim in seeking treatment is to improve facial aesthetics as far as possible and to improve function. The problem is thus a manipulation o f the various elements in three dimensions to achieve the best
solution within the constraints of aesthetics, stability and function (A nidge, 1985). Such
tooth movements are carried out with extreme care and can not be carried out rapidly;
many months or even years may elapse before achieving the desired results.
2 .2 .1 AIDS TO D IA G N O SIS.
A full clinical examination and treatment planning consists of simultaneous scrutiny
of the patient, models, photographs and cephalometric radiographs. Complex deformities
require a detailed joint appraisal by the orthodontist and surgeon, and even then a single
surgical solution may not suggest itself immediately.
D ental casts.
Study models are made by letting a patient take a squash bite into a tray of soft
ceramic material with a view of providing the orthodontist an impression of the teeth
present as well as their orientation. In certain cases treatment planning may be assisted by
simulating the proposed treatment on study models. The models are mounted on bases in
such a way that the upper and lower teeth are placed in correct occlusion (Plate 2.1).
Generally, study models are used for the following reasons:
- they make it possible to view the occlusion from every aspect.
- they enable accurate measurements to be made of the dental arches.
- they can be used later for the assessment of treatment progress etc.
Plate 2.1: Illustration o f a study model (cast).
P h o to g ra p h s .
Photographs are taken preoperatively and postoperatively as a surgical audit and rarely for medico-legal reasons. The basic orthodontic sequence of colour photography consists of:
1. Full face at rest.
2. Right profile ( or both profiles if any asymmetry). 3. Upper and lower dental arches and
4. Teeth in occlusion.
Attempts have been made to superimpose the 1:1 object-image profile photograph with the lateral X-ray, but as the imaging geometries differ, these images do not match exactly. As may be seen in Figure 1.1, co-registering images from the two sources must take into account the consequences associated with projective displacement of all points not lying on the central or principal ray of the system. This is important in X-ray imaging geometry as teeth, bony structures of the skull and overlying soft tissue are layered upon each other in such a way as to create a confusing and noisy image.
Figure 2.1: X-ray and Photographic imaging geometries.
As may be seen in Figure 2.1, coregistering images from two sources must take into account the consequences associated with the projective displacement of all points not lying on the central or principal ray of the system. Furthermore, corrective procedures ought to be adopted to circumvent the phenomenon where bony structures of the skull and overlying soft tissue are layered upon each other in such a way as to create a confusing and noisy image.
Construction of a photographic montage also assists in treatment planning. To construct a montage, the profile photographs are cut up and the pieces are rearranged to give an impression of what is likely to be achieved by surgery (Plate 2.2). Although empirical and crude, this can be helpful and the anticipated result must be shown to the patient. However, the montage has limitations, the most obvious being the soft tissue
representation. It is impossible to reproduce with accuracy the anticipated change in the lips or soft tissue contour overlying the maxilla.
Plate 2.2: Photographic montage used to compare tlie preoperative profile witli the outcome.
R a d io g ra p h s .
Radiographs show details of the bone and teeth clearer and may be taken with a standard dental X-ray machine operated at 90kV, 30mA and ideally with a rotating anode. Radiographs are used as an aid to diagnosis in orthodontics for the following purposes:
- to establish the absence or, if present, the exact position of unerupted teeth. This is of particular importance when extractions are contemplated.
- to establish the presence or absence of supernumerary teeth, especially in those cases in which there is a space between the upper central incisors.
- to determine the extent of calcification or resorption of the root of a tooth. - to confirm the presence and extent of pathological conditions.
In order to study growth changes in the human skull, Broadbent in 1931, introduced a radiographic technique whereby the head was positioned in a specially designed headholder (cephalostat) by means of ear rods, so that, at regular intervals, serial frontal and lateral radiographs of the same individual were obtained with the minimum inaccuracy. Radiographic cephalometrics is concerned with the measurements of the head. Lateral skull radiographs are helpful in establishing the relations of
- the maxilla to the mandible
- the maxilla and the mandible to the base of the skull - the maxillary teeth and the maxilla
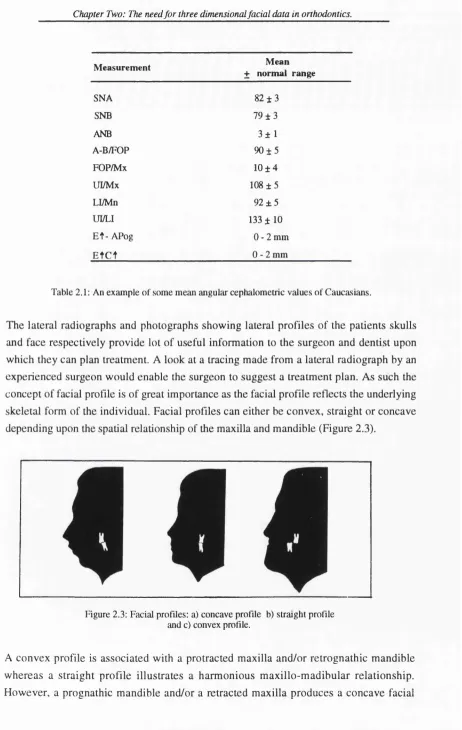
Skeletal and soft tissue landmarks have been defined and their identification on the tracings of the radiographs is essential to the various analyses used in clinical dentistry. Once the landmarks are identified, these points are then connected to form the various lines and planes that are used in cephalometrics. Figure 2.2 shows the skeletal and soft tissue landmarks and Table 2.1 is an example of angular measurement to the nearest whole degree of the mean angular cephalometric values of Caucasians.
A NS ,Ar
Ba PNS
'Go TGo
iTGT
\P o g
'GnJ
Me
Figure 2.2: Skeletal and soft tissue landmarks used on cephalometric x-ray tracings.
Measurement Mean + normal range
SNA 82 ± 3
SNB 79 ± 3
ANB 3 ± 1
A-B/FOP 9 0 ± 5
FOP/Mx 1 0 ± 4
UI/Mx 108 ± 5
LI/Mn 9 2 ± 5
UI&l 133 ± 1 0
Et - APog 0 - 2 mm
E t C t 0 - 2 mm
Table 2.1: An example o f some mean angular cephalometric values o f Caucasians.
The lateral radiographs and photographs showing lateral profiles of the patients skulls and face respectively provide lot of useful information to the surgeon and dentist upon which they can plan treatment. A look at a tracing made from a lateral radiograph by an experienced surgeon would enable the surgeon to suggest a treatment plan. As such the concept of facial profile is of great importance as the facial profile reflects the underlying skeletal form of the individual. Facial profiles can either be convex, straight or concave depending upon the spatial relationship of the maxilla and mandible (Figure 2.3).
Figure 2.3: Facial profiles: a) concave profile b) straight profile and c) convex profile.
A convex profile is associated with a protracted maxilla and/or retrognathic mandible whereas a straight profile illustrates a harmonious maxillo-madibular relationship. However, a prognathic mandible and/or a retracted maxilla produces a concave facial
profile. Discrepancies between angular measurements made on an individuals profile and those given in standard tables like those in Table 2.1 assist in the decision process when considering what surgical procedures to undertake. Unfortunately, on medical grounds this data source can not be obtained regularly as patients can not be subjected to large radiation doses frequently, as such other imaging methods that can provide information of skeletal tissue should be used.
2 .3 MOTIVATION AND AIMS OF THIS RESEARCH WORK.
From the aforegone discussion on current practices on diagnostic aids, the current weakness lies in the fact that the photographs and radiographs that provide useful information of the bone tissue are lateral. This implies that analysis is limited to the occlusal plane (Arridge, 1985). Any inform ation off this plane can thus only be extrapolated. The other major drawback lies in the legal/ethical limits to which patients can be exposed to such radiation doses with an implication that radiograms can not be frequently used. Recommended minimum periods between X-ray radiation exposures is six months. A num ber o f techniques exist that can be employed to provide three dim ensional facial data and of these techniques photogram m etry is one of them. Photogrammetric approaches have the distinct advantage of acquiring images of dynamic scenes almost instantaneously thereafter the images can be used for further mensuration. The aim o f this research w ork was to develop com ponents o f a non-contact stereophotogrammetric system to acquire, process, display 3-D surface models of the human face. Furthermore, to develop tools that would enable clinicians to manipulate the facial data so as to generate profiles, angles and distances between points.
The next two chapters give an overview of close range photogrammetric imaging systems and the advances in three dimensional data extraction from pairs of overlapping photographs (stereopair).
CHAPTER THREE.
LITERATURE REVIEW.
3 .1
WHAT IS PHOTOGRAMMETRY?
The word "photogrammetry” is derived from three Greek words, photos meaning "light," g ra m m a meaning "something drawn or written," and metron meaning "to measure." The root words therefore originally signified measuring graphically by means of light (Slama, 1980). The official definition of Photogrammetry has changed with time to encompass the activities o f the Photogrammetrist. As of 1979, the American Society of Photogrammetry and Remote Sensing defined Photogrammetry as follows:
Photogrammetry is the art, science, and technology o f obtaining reliable information about physical objects and the environment through processes o f recording, measuring, interpreting photographic images and patterns o f electromagnetic radiant energy and other phenomena.
The best known application o f photogrammetry is the compilation of topographic maps and surveys, complete with contour lines, based on m easurem ents and information obtained from aerial and space photographs; the compilation is usually performed by means of optical analogue instruments and/or analytic computations.
3.1.1 CLOSE RANGE PHOTOGRAMMETRY.
The term close range Photogrammetry is generally used when object-to-cam era distances are not more than 300 metres (Atkinson, 1980; and Karara, 1989). Similar topographic principles of precise measurement are applied in close range photogrammetry to m easure objects which are difficult to study; such as in recording measurable deform ations in engineering models and for the m edical study (in situ ) of live specimens, photogram m etry offers a superior solution. Close range applications of photogram m etry are often considered as requiring mere adaptations of techniques developed specifically for aerial survey. Although the essential differences between the photogrammetric measurement of close range systems and an aerial survey may be self- evident, some of these differences have been highlighted in Table 3.1.
In general, any photogrammetric process, consists of two major phases: a) acquiring data on the object to be measured by taking the necessary
photographs, and
b) transforming the photographic data (perspective projection) into maps or spatial coordinates (orthographic projection), or digital elevation models (DEM).
ENGINEERING PHOTOGRAMMETRY. AERIAL SURVEY. Object may have truly spatial charateristics Relief is small in comparison
(great depth) and discontinuities in depth. with the flying height. Accmacy in all three co-ordinates may Accuracy requirements in height
be equally important. different from those in plan.
A restricted format is likely. Entire format is usable.
Spatial nature of object necessitates photo Vertical photography employed almost graphs of varying position and (xientation. exclusively.
Point information is the essential Photogr^hs may be used for plotting
requirement. as well as point detœninatiœ.
Targetting may be possible for all points Excluding cadastral surveys, targets which require co-ordinati(m. may only be used for control points.
Total number of photographs is A large block may consist of
relatively small. thousands of photographs.
Site restrictions frequently Few restrictions other than air
encountered. traffic control and weather.
May be possible to determine some of the Auxiliary data have only a
camera parameters with considerable limited accuracy.
accuracy.
Flexible approach required due to A fairly standardised approach
differences from one project to can be adopted.
another.
Table 3.1: A comparison between close range photogrammetry and aerial survey.
Thus, the total photogrammetric process can be subdivided into data acquisition and data reduction. The data acquisition system is concerned with procuring what may be termed the raw data or raw information and is the more expensive of the two. The raw data is realized in terms of the photograph. Hence the data acquisition system is concerned with obtaining necessary and suitable photography. The data reduction system is used for converting the geometric information on the photographs into a final form suitable for their intended use. The final form may be analogue such as a map or digital.
3 .2
CLOSE RANGE IMAGE DATA ACQUISITION SYSTEMS.
The immediate goal of imaging systems is the provision of image representations of high inform ation content for applications covering every segm ent o f science and technology. Broadly speaking there are three essential components to the making of images.
a) The most essential component is illumination. In most instances an object is imaged as well as viewed by diffusely reflected light. The appearance an object presents in a photograph or directly to the eye, depends not only upon the object itself but also upon the light that illuminates it.
b) The next essential part of an imaging process is image formation. Light from the object must be collected upon the surface where the picture is to be made.
illum inating it in a pattern, or image, which resem bles the object. The faithfulness o f the resemblance depends upon the optical system used,
c) The third essential part of the process is the image perpetuation. This is the part that is generally recognized as that m ost characteristic o f photography (Mack and Martin, 1939).
Image creation is now indispensable in science; to mention a few examples: modem astronomy depends almost exclusively upon imagery of one form or the other for its data. X-ray images are standard aids in medical and dental diagnosis and other non-visible radiations are used for widely different purposes. A list of the different functions of images would fill this volume. The term "light" originally meant the agent of vision (Ray, 1988). This narrow concept has long been discarded and the term is now used to include all radiant energy, that to which the eye is sensitive being only a small part o f the whole spectrum. Even in photography the range of the light used to generate the picture may be considerably broader than that used by the eye to observe the object such as false colour infra-red. Depending on the region concerned, electro-magnetic radiation is detected and recorded by various means. Photographic materials are useful, versatile detectors using direct action of the radiation to form either a latent image or indirect means such as the fluorescence effects used in radiography. Other detector systems include the emission of photo-electrons, such as from the photo-cathode of a TV image tube, the accumulation of charge, as in a focal plane array of charge coupled devices (CCDs).
The types of camera in common use are so many and varied as to defy proper classification. However, the state-of-the-art in sensor techniques for close range photogrammetry is characterized by two major trends. As such, the discussion here will be confined to types of cameras in general use for close range measurement purposes namely film based (analogue) and CCD based (digital) close range cameras. Both categories of cameras employ lenses in order to obtain images that are at the same time bright and clear since, by proper placement of one or more lenses, it becomes easy to direct rays from any point of an object to any other point on the focal plane.
3.3 F IL M B A SED (A N A L O G U E ) C A M E R A S .
This group of cameras have been around for close to a century and as such a lot of investigations on their perform ance has been done. The high perform ance o f such cameras in close range photogrammetry is the result of a hybrid combination of several components involved in the photogrammetric process. In addition to sophisticated camera and lens systems, availability of high-quality film and use o f powerful processing systems, the application of numerical and digital procedures for calibration, orientation
and image m easurem ents have played an im portant role in the reliability o f the procedures. Little wonder that Fryer (1992) observed that in order to comment on image recording systems all these factors have to be taken into account.
3.3.1
CONVENTIONAL METRIC CAMERAS.
There are three m ajor classes o f cameras used in conventional photogramm etric practice. These are metric cameras, reseau cameras and non-metric cameras.Conventional metric cameras use a rigid optical and mechanical construction in order to maintain a stable interior orientation over a long period of time. These cameras can either be single cameras or stereometric cameras. Most modem photogrammetric single cameras consist of two main parts - an orientable camera support which can be mounted on a tripod and a tiltable metric chamber which can be separated for transportation. M ost such cameras operate with glass plates and some permit the use of roll and/or cut film. A number of the metric cameras have variable principal distances to widen their focusing ranges. Focusing may either be in discrete steps or continuous, for example, through the use o f adapter rings or use of lenses which can be attached to the camera (Slama, 1980). W ith a few exceptions, stereometric cameras operate with glass plates and consist o f two single cameras rigidly mounted on a base of definite length, with the optical axes parallel to each other and perpendicular to the base (normal case of photography). The minimum and maximum accuracy thus obtainable are set by the fixed geometry o f the stereometric cam era (Slama, 1980). As is the case with most single cam eras, most stereometric cameras have provisions for changing the principal distance so as to increase the range of focusing. Cameras in this group are characterised by fiducial marks. Fiducial marks of one design or another are engraved on a glass plate which are imaged onto the film at the time of exposure. They are usually a minimum of four in number and are located in or near the centre of each of the four sides. Ideally, the lines joining opposite pairs of fiducial marks should intersect at the principal point of the system (Figure 3.1). Thus in the construction of the cameras, fiducial marks are located or adjusted to indicate the principal point of the system within exceedingly close tolerances. For other cameras not requiring mapping accuracies, the fiducial marks are located by the m anufacturer to indicate only the geometric centre o f the format (Luhmann, 1990). Examples of metric cameras in current use include Wild P31, P32 and Zeiss UMK1318. Although they provide high optical and geometric quality, they are not particularly easy to use nor do they have a wide range of accessories. The price/performance ratio of these systems will ensure that they disappear from the market within the next few years.
Hducial marks
0
/
Fiducial*7 centre
Figure 3.1: Fiducial centre or indicated Principal Point of a 35mm film.
3.3.2
RESEAU CAMERAS.
Reseau cameras have been very successful in practice. In small and medium formats, they provide the comfort of automatic exposure, motorized film cassettes, interchangeable lenses, various accessories and an accuracy similar to conventional metric cameras. In large format cameras the reseau technique offers a constructionally simple method of providing a well-defined interior orientation as well as compensation of film unflatness.
In this group of cameras a glass-plate reseau is designed as part o f the optical system. The reseau consists o f a series o f fine grid intersections arranged in a chosen configuration with some nominal spacing. Typical reseau grids have spacings from 2mm up to 50mm and the reseau marks can be imaged onto the negatives in two ways. Using projectors mounted behind the film plane, reseau marks are individually projected onto the film with separate perspective centres. The images of the reseau points have good local contrast, but the constructional effort is rather high. The standard solution for reseau projection incorporated in all small and mid-size cameras uses the single perspective centre of the camera lens. Sufficient contrast of the reseau image can be obtained by pre exposure of the grid. The engraved reseaux are superimposed on the negatives, prints or diapositives w ithout regard to later changes o f scale (Slam a, 1980). These grid intersections may be closely established with regard to the fiducial marks and the principal point o f the camera. Reseau technique are widely used for photographic sensor systems and have enabled the development of specialized high-precision camera systems in the process making it easier to measure the potential precision of semi-professional cameras (Fraser and Brown, 1986). The main advantage o f a reseau is the facility to com pensate num erically for film deform ation w hich occurs during recording, development and processing. Together with suitable network configurations and on-the- job calibration by bundle adjustment, extremely high accuracies can be achieved. The
additional effort in measuring reseau targets is easily accommodated by using automated monocomparators.
O ff-the-shelf reseau camera systems differ mainly in their film format. There are 35 mm cameras ( Rollei 3003, Leica R5 ), various mid-size cameras (Rollei 6006, Hasselblad MK70, Linhof Metrika, G SIC R C -2) and large format systems (G SICRC-1, Rollei LFC).
3.3.3
NON-METRIC CAMERAS.
In some applications, unm odified conventional off-the-shelf 35mm cameras not designed specifically for photogrammetric purposes are used. The use of non-metric cameras, as opposed to metric cameras, for photogrammetric purposes has the following advantages and disadvantages. The advantages are:
- general availability,
- flexibility in focusing range,
- some are motor driven, allowing for a quick succession of photographs, - they can be hand held and thereby orientated in any direction and
- the price is considerably less than that for metric cameras. The disadvantages are:
- the lenses are designed for high resolution at the expense of increased distortion,
- instability of interior orientation,
- lack of fiducial marks and the absence of level bubbles and orientation provisions precludes the determination of exterior orientation before exposure.
Due to the absence of fiducial marks and lack of film flatness the obtainable accuracy has up until a few years ago been lim iting. However, a lot o f w ork led by ISPRS Com m ission V has resulted in the developm ent o f a num ber o f methods for data reduction particularly suitable for use with photographs from non-metric cameras. These methods are based on highly sophisticated analytical techniques which combine in most cases the calibration and evaluation phases.
The choice o f the cam era depends on the project, w hether the low cost camera/expensive evaluation system or the metric approach is more suitable or financially advantageous, the decision has to be made by the user. Often project arrangements require versatility and light weight cameras which can only be m et by non-metric cameras, and with the progress that has been made regarding the use o f non-metric
cameras this option can now yield high precision results. The photogrammetric potential of non-metric cameras is indeed high!
3.3.4 C A L IB R A T IO N M E T H O D S O F A N A L O G U E C A M E R A S.
Traditionally, the objective o f camera calibration is to estimate those parameters in the photogrammetric system which can be considered as "constants" in later photogrammetric measurement tasks (Hadem and Amdal, 1992). The parameters o f the photogrammetric system (the functional relationship between image points (x,y ) and object points
(X ,Y,2^) are prim arily those o f interior and exterior orientation describing the fundamental model: the central perspective, and secondly additional parameters which describe the deviations from the model. These deviations (model errors) can be mathematically formulated as systematic image errors on the basis of a physical approach or a numerical/statistical approach. Interior orientation defines the internal geometry of the camera which determines:
- the position of the imaging plane with respect to the optical centre of the (ideal) lens, known as the principal d istan ce/ (or calibrated focal distance) (Burnside,
1985).
- the position at which the camera axis of the lens intersects the image plane, known as the principal point or point of symmetry, which then determines the origin for the camera co-ordinate system.
- the distortion properties of the imaging lens.
On the other hand exterior orientation defines the position and orientation of the camera system with respect to some external reference frame Yy^, ). The position of the cam era (perspective centre) is given by the co-ordinates Xq, Yq, Zq and the orientation is given by the Euler rotation angles omega (œ), phi (( j) ) and kappa ( k ) taken about Xyy, Yy^ and Zy^ axes respectively.
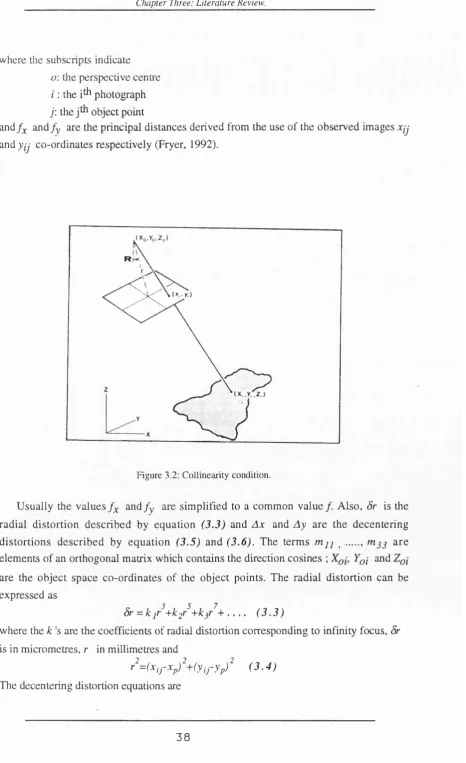
Camera calibration is mostly based on the well known collinearity equations (see Appendix A). This basic formula for analytical photogrammetry can be expressed in several forms. Corrections for the small inaccuracies of co-ordinates of the principal point and principal distance are introduced. Additional correction terms dx and dy for the measured image coordinates x and y respectively are formulated to model lens distortion. The calibration equations can be written as :
where the subscripts indicate
o: the perspective centre
i : the i ^ photograph
j: the object point
an d/y an d/y are the principal distances derived from the use of the observed images xjj
Sind y ij co-ordinates respectively (Fryer, 1992).
Figure 3.2: Collinearity condition.
Usually the values /y and jy are simplified to a common value / . Also, ô r is the
radial distortion described by equation ( 3 .3 ) and A x and A y are the decentering
distortions described by equation ( 3 .5 ) and ( 3 .6 ) . The term s m j j ^..., are
elements of an orthogonal matrix which contains the direction cosines ; YqI and are the object space co-ordinates of the object points. The radial distortion can be
expressed as
5r = k + k2^ ^ . . . . ( 3 . 3 )
where the k 's are the coefficients of radial distortion corresponding to infinity focus, 8r
is in micrometres, r in millimetres and
r^=(Xij-Xp) ^Myi j - yp) ^ ( 3 . 4 )
The decentering distortion equations are
A x = pj[r^+2(Xij-Xpf+2p2(Xij-Xp)(yij-yp) ( 3 . 5 )
=Pi[r^-^^(yij-ypf-^^Pi(Xij-Xp)(yij-yp) ( 3 . 6 )
w here the p's are the values at infinity focus of the param eters of decentering distortion.
The term s d x ^ p and d y ^ p have been included in equation (3.1) and (3.2) to indicate the use of additional parameters which are commonly incorporated in bundle adjustment A great range and variety of sets of additional parameters have been proposed by photogrammetrists. Kilpela (1980) details eight sets o f additional parameters, and Ziemann and El-Hakim (1982) and Murai et al., (1984) have evaluated their effectiveness under different conditions. Although the exact physical meaning of many of the additional parameter terms is unclear, there can be no disputing the effective way by which the systematic errors which remain in image and model co-ordinates after a conventional bundle adjustment can be reduced (Fryer, 1992). There always exists a temptation to successively add more and more additional parameters in order to reduce the size of the residuals of the image co-ordinates. Fraser (1982) has shown that for the case of minimally constrained multi-station adjustment, the use of higher degrees of additional parameters can lead to a serious deterioration in the accuracy of the object co-ordinates. The additional parameter model shown below in equation (3.7) and (3.8) should be sufficient to remove the majority of systematic effects from most close range adjustments.
2 2 2
dXap=xi]X y + a ^ -Myx y+a^x y ( 3 . 7 )
— —2 — 2— ________
d y a p= b jx+ b ^+ bjxy+ b4 x + bsx y + b ^ y ( 3 . 8 )
where
and
X = X i j - X p
y=yij-yp
and
a j , Ü4 and ... , b ^ are the coefficients of the additional parameters.
Theoretically, it is possible to use only seven control points to determine the six exterior orientation parameters and eight parameters of interior orientation. For a complete calibration, a three-dimensional test field is necessary. Its extension in the direction of the optical axis is very important for the reliability of the computed principal distance (Faig, 1971). This requires a favourable spatial distribution of control points for the reliable determination of inner orientation parameters (xp, yp a n d /) , adequately distributed over