An Integrated Skew Detection And Correction
Using Fast Fourier Transform And DCT
Mandip Kaur, Simpel Jindal
Abstract: Skew detection and correction is very important task before pre-processing of an image and it is a major problem in scanned documents, if it not detected correctly it will lead wrong result in future during image analysis. During the scanning of the document, skew is being often introduced in the document image. To measure the processed time and speed taken by skew detection algorithm, the Fast Fourier Transform (FFT) technique is applied as it is fast approach for finding the angle of skewed document. This technique is used by firstly applying DCT compression and thresholding on image to reduce timing computation and after that Fourier spectrum is obtained. Further this spectrum is divided into four quadrants and detected skewed angle of each quadrant is measured. And finally Input image is rotated by using bilinear interpolation method.
Keywords: Skew correction, Skew detection, Skew angle, Fast Fourier Transform, DCT, Thresholding, Spectrum
————————————————————
1
I
NTRODUCTIONSkew angle estimation and correction of a scanned document is very important task for document analysis. During digitization of documents, it often happens that the document is not aligned correctly and it may lead to skewed image. Therefore, due to skew it can cause further performance degradation of segmentation and recognition stage of any text processing system [1]. Skew in scanned document can be of two types and shown in figure 1 [2].
1. Clock -wise skew (Positive skew) 2. Anti-clock wise skew (Negative skew)
(a)
(b)
Figure 1: (a) clock -wise skew (Positive skew) and (b) Anti-clock -wise skew (Negative skew).
Several techniques have been used to do the analysis of skewed images such as Projection Profile [4], Centre of Gravity [5], Fourier Transform [6], Hough Transform [7] and Geometric Text-line Modeling [9] but the Fourier Transformation is the fastest and easiest to implement in comparison to all other existing techniques. The working of Fast Fourier technique is explained bellow.
Fast Fourier Transform
When the image was converted from its Spatial Domain f(x, y) to its frequency domain f(u, v), then by using Fast Fourier Transform technique it is easy to process the image and its further calculations such as skew angle, speed, time etc. because the frequency at each point of the image can be easily calculated. This technique based upon removal of certain range of frequencies from a processed image. This technique mainly contains the following steps:
Computes the Fourier Transform of an Image f(x,y).
Computes a new transform f(u,v) by setting some values to zeros
The FFT of 2D image having spatial domain f(x, y) of size M x N is given by following Fourier equation [3].
2 ( / / )0 0
1
,
,
M N
j u M vy N
x y
f u v
f x y e
MN
————————————————
Mandip Kaur is currently pursuing masters degree program in Computer Engineering in Yadavindra College of Engineering, Talwandi Sabo, India. E-mail: [email protected]
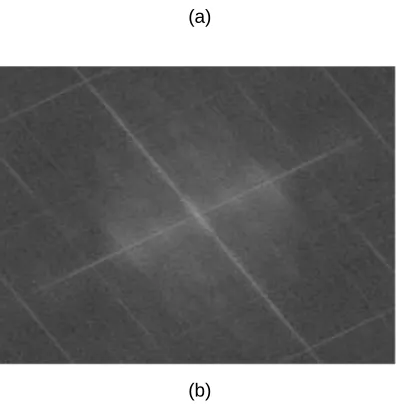
FFT as described by above formula calculates the frequency spectrum of the spatial coordinate function f(x, y). The Fourier function f (u, v) may have complex values but for better accuracy, only absolute values of the frequency spectrum have been taken. As the image is rotated, its frequency spectrum also rotates and shifts the energy of the image to the Centre of the image. Here is the example of the input
(skewed) and output (De-skewed) images frequency
spectrums shown in figures 2 and figure 3.
(a)
(b)
Figure 2: (a) Original input and (b) Fourier Spectrum of input skewed Image.
(a)
(b)
Figure 3: (a) Output-De-skewed Image and (b) Output Spectrum of the De-skew Image.
From the above frequency spectrum it concludes that when image rotates to some angle then its frequency spectrum also rotates, this is the basic mantra of finding the skew angle detection with frequency spectrum. In this paper, we used the Fast Fourier technique to calculate the skewed angle of various images by keeping the similar input parameters as used by Manjunath et al [7] for better performance comparison with Hough transform.
2. LITERATURE SURVEY
In 2012 Kumar et al. has introduced a new method which reduces the time complexity without compromising with the accuracy of Hough transform. The main advantage of Hough transform [1] is due to its better accuracy and simplicity. In 2002 Lowether et al. [6] has presented a new Averaged Block Directional Spectrum (ABDS) technique for determining the skew angle of digitized documents. It is based on calculating the average 2D Fourier Transform of blocks in a document image and using the Radon transform to find the peak in the directional spectrum. In 2007 Aradhya et al. [7] has proposed a novel skew detection method for binary document images. This method considered some selected characters of the text which may be subjected to thinning and after applying Hough transform skew angle of the documents are estimated. On the other hand, several experiments have been conducted on various types of documents such as English documents, Journals, Text-Books, different languages, documents with different fonts and resolutions etc. to reveal the robustness of the proposed method. The experimental results reveal that the proposed method is accurate in comparison to the results of well-known existing methods.
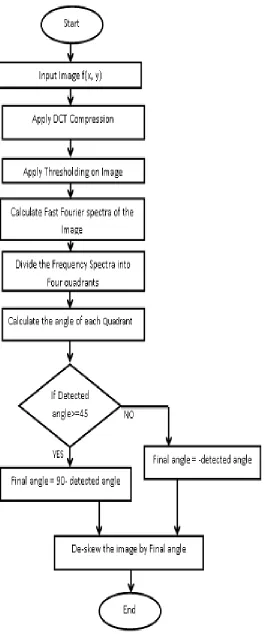
3 RESEARCH METHODOLOGY
Figure 4: Data Flow Diagram of the proposed technique.
3.1 Proposed Algorithm
Step 1.Start.
Step 2.Input the Image and read the image using imread() function of the MatLab.
Step3.Perform the DCT lossy Compression on the image to reduce the timing calculations during processing of the image.
Step 4.Apply thresholding on the input image to get grey-scale image because grey-scale image having improved intensity values and then convert it into binary image.
Step 5.Convert the image into its Frequency Domain Spectrum and now frequency value Matrix of the image is stored in size [M N] matrix.
Step 6.Divide the Fourier spectrum into Four quadrant.
Step7. Calculate the angle of tilt of each quadrant corresponding highest transform intensity of each quadrant say angle degree (1), angle degree(2), angle degree(3), angle degree(4) and Sum up the four angles and find average angle to find the Detected angle.
Step 8. If Detected_ angle>=45 Then final angle=90- Detected_angle. Else
final angle = -Detected_angle.
Step 9.Rotate the image through its centre by angle final angle using bilinear interpolation method.
Step 10. Display the De-Skew image.
Step 11.End
4
EXPERIMENTAL
RESULTS
Figure 5(a) and 5(b) shows the rotation angle of -25 degree and the compressed image.
(a)
Original Image
100 200 300 400 500 600 700 800 900 1000 1100 100
200
300
400
500
600
(b)
Figure 5: (a) rotated and (b) Compressed Skewed Images.
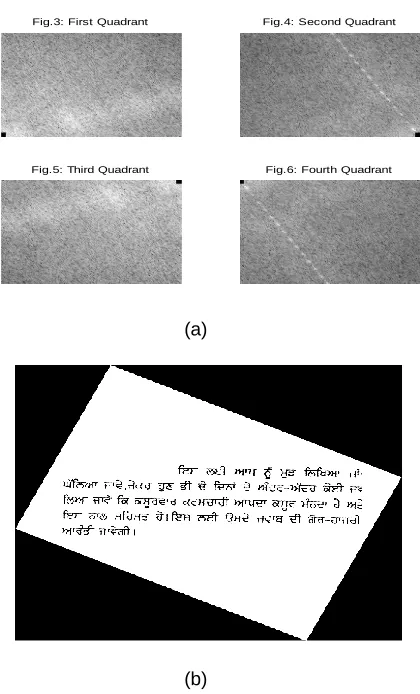
Figure 6(a) and 6(b) shows the four quadrants of the Fourier spectrum of an image and output image rotated by -25.38 degree using experimental technique.
(a)
(b)
Figure 6: (a) four quadrants of Fourier spectrum and (b) Ouput De-skewed Image.
Table 1 (a) and (b) shows the results obtained by proposed and existing techniques. In proposed method, some scanned documents have been selected and after that thresholding is applied on them to convert into binary level documents. The main goal of proposed method is to speed up the skew angle
detection. For better comparison, the similar documents have been taken as input as taken by Aradhya et al. [7] and compared the results obtained with the existing technique. In these both the tables the time taken, accuracy and detection angle calculated by proposed and existing techniques have been presented.
Sr. No. Actual Angle
Detecte d Angle
Error Accurac y
Time Second
1 -30 -30.43 0.014 98.58% 0.202
2 -20 -20.11 0.005 99.45 % 0.296
3 -10 -10.43 0.04 95.88% 0.192
4 -5 -4.90 0.02 98% 0.203
5 -3 -3.01 0.003 99.66% 0.111
6 1 0.77 0.23 77% 0.154
7 3 2.32 0.23 77% 0.126
8 5 5.02 0.004 99.6% 0.110
9 10 10.95 0.095 91.32% 0.173
10 15 15.26 0.017 98.29% 0.156
11 18 17.32 0.038 96.22% 0.134
12 19 19.39 0.02 98.34% 0.224
13 20 20.30 0.015 98.52% 0.216
14 25 25.38 0.015 98.50% 0.257
15 27 27.72 0.027 97.40% 0.277
16 30 29.80 0.006 99.33% 0.205
17 33 32.53 0.014 98.57% 0.347
18 40 40.16 0.04 99.60% 0.187
19 42 41.05 0.023 97.73% 0.257
20 45 44.34 0.015 98.53% 0.239
(a)
Sr. No. Actual Angle
Detected
Angle Error Accuracy
Time Elapsed(in
Seconds)
1 3 2.89 0.037 96.33% 1.78
2 5 5.08 0.016 98.42% 1.68
3 10 9.86 00.014 98.60% 1.77
4 15 15.12 0.008 99.21% 1.70
5 20 20.11 0.005 99.45% 1.80
6 30 30 0.00 100% 1.71
7 40 39.89 0.002 99.72% 1.72
8 45 44.98 0.00004 99.75% 1.74
(b)
Table 1: (a) Evaluation of proposed and (b) existing technique.
Compression Factor 2
100 200 300 400 500 600 700 800 900 1000 1100 100
200
300
400
500
600
700
Fig.3: First Quadrant Fig.4: Second Quadrant
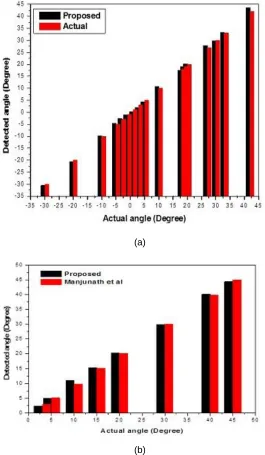
From the above tables it has been obtained that the proposed method has almost similar accuracy in comparison to the results of existing method but with less time consuming. Figure 7 shows the comparison between the actual and detected angle of the scanned document by using proposed technique (a) and comparison of existing and proposed (b) techniques.
(a)
(b)
Figure 7: (a) Detected angle of the proposed technique and (b) Detected angle of the proposed technique.
Accuracy comparison
Accuracy rate must be improved to achieve good results. It increases with decrease in error rate and increase reliability of algorithm.
Figure 8 shows the comparison of accuracy rate of existing technique [7] and proposed technique
Figure 8: comparison of accuracy.
The accuracy results obtained are nearly similar to the results of existing technique.
Time comparison
Time is defined as the time taken by the algorithm to run and it is directly proportional to number of input elements. Also the speed is inversely proportional to the time. The comparison of time taken for detection of the skew angle of scanned document by existing technique [7] and proposed technique has been compared in figure 9.
Figure 9: comparison of Time.
6
CONCLUSION
AND
FUTURE
WORK
6.1 Conclusion
documents with different fonts and printed documents. Accuracy is also near to 95% and time for calculating the skewed angle is less than one second (average) for all scanned images.
6.2 Future Work
Performance evaluation has shown that proposed algorithm is quite good result for determining the angle of an image but there is one limitation it does not work with small resolution images and error is considerable in the case of small degree skewed images. In this technique we have taken pre-processed images, In near future work will to detect low resolution noised skewed images angle correctly and to reduce the elapsed time to detect the angle of skewed image.
ACKNOWLEDGEMENT
The author Mandip Kaur would like to thank Yadwindra College of Engineering staff for their support and also thank to Amanpreet Singh,Amit Bansal,Sheetal Singla and Shevali Garg for their fruitful discussion during the writing of research paper.
REFERENCES
[1]. Deepak Kumar and Dalwinder Singh "Modified Approach of Hough Transform for Skew Detection and Correction in Documented Images" International Journal of Research in Computer Science, Vol. 2, Issue 3, April 2012, Pages 37-40.
[2]. Shijian Lu, Jie Wang and Chew Lim Tan”Fast and
Accurate Detection of Document Skew and
Orientation” 9th International Conference On Document Analysis And Recognition Vol. 2, 2007, Pages 684 - 688.
[3]. Frank Y. Shih "Image processing and mathematical morphology fundamentals and applications”, Edition-2009.
[4]. Shutao Li, Qinghua Shen and Jun Sun “Skew detection using wavelet decomposition and projection profile analysis” Pattern Recognition Letters, Vol. 28, Issue 5, 1 April 2007, Pages 555–562.
[5]. Atallah Mahmoud Al-Shatnawi and Khairuddin Omar “Skew Detection and Correction Technique for Arabic Document Images Based on Centre of Gravity” Journal of Computer Science, Vol. 5, 2009, Pages 363-368.
[6]. S. Lowther, V. Chandran and S. Sridharan“An
Accurate Method for Skew Determination in
Document Images” Digital Image Computing Techniques and Applications (DICTA), 21- 22 January 2002, Pages 1-5.
[7]. Manjunath Aradhya V N, Hemantha Kumar G and Shivakumara P”Skew Detection technique for Binary Documents Images Based on Hough Transform”,
International Journal of Information and
Communication Engineering, Vol. 3:7, 2007, Pages 493-499.
[8]. Zhang ruilin, Hu yan, Fang zhijian and Zhang lei "Skew Detection and Correction Method of Fabric Images Based on Hough Transform” Second International Conference on Intelligent Computation
Technology and Automation,Vol. 2, October
2009,Pages 340-343.