Published online October 20, 2014 (http://www.sciencepublishinggroup.com/j/ijepe) doi: 10.11648/j.ijepe.s.2014030601.12
ISSN: 2326-957X (Print); ISSN: 2326-960X (Online)
Comprehensive evaluation of equipment failure influence
degree before or after accessing distributed power into
distribution network
Na-na Li, Hui-ru Zhao
School of Economics and Management, North China Electric Power University, Beijing, 102206, China
Email address:
[email protected] (Na-na Li)
To cite this article:
Na-na Li, Hui-ru Zhao. Comprehensive Evaluation of Equipment Failure Influence Degree before or after Accessing Distributed Power into Distribution Network. International Journal of Energy and Power Engineering. Special Issue: Energy Conservation and
Management.Vol. 3, No. 6-1, 2014, pp. 6-12. doi: 10.11648/j.ijepe.s.2014030601.12
Abstract:
Distribution network equipment failure causes a serious impact on society. So a reasonable approach to reduce the consequences of equipment failure (ie, equipment failure affecting degrees) is necessary. This paper presents a comprehensive evaluation method which combines fault traversal, AHP-TOPSIS method to ensure the degree of different equipment failures. Meanwhile, in order to reduce the impact of equipment failure, a distributed power is accessed into distribution network, and we compared the impact value before and after it accessed. A numerical example shows that the distributed power can reduce the consequences of equipment failure as well as the grid and social impacts.Keywords:
Equipment Failure Affecting Degree, Distributed Power, Comprehensive Evaluation1. Introduction
Electric power enterprises are aiming at providing customers safe, economic and reliable high quality power. In actual operation, however, some factors can lead to distribution network equipment failure and the interruption of power supply shortage, which brings huge losses to the national economy and people life. Statistics show that the influence on users’ power supply from equipment failure in distribution is most serious, nearly 80% of users outages caused by the fault of equipment in distribution[1]. As a result, it is necessary to analyze the equipment failure influence degree for power distribution network, and adopt corresponding measures to reduce the consequences of equipment failure.
Most researches on the effects of power distribution network fault are aiming at the power failure consequence of user, and many evaluation models are put forward. Through visiting and surveying the short-time power loss of important power users, the short outage loss function of different users under different power outage duration is concluded in reference [1]. Literature [2] constructed the user power outage loss function and the outage loss evaluation rate, while two methods to estimate the power loss were put forward, and the practice showed that method
is feasible. In the reference [3], the power outage loss evaluation model was constructed according to the loss evaluation rate of load point, while the power outage loss of important power users is estimated. On the basis of analyzing the working mechanism of the switch on main feeder section, literature [4] put forward the user power economic loss calculation method under any switch setting schemes considering the feeder automation. Considering the uncertainty of the power failure loss factors on different users, literature [5] put forward a power outages consequences evaluation method on the basis of investigation and the Monte Carlo Simulation. Literature [6] used the formula to make clear the relationship among power loss, customer types, feeder topology structure, maintenance time and recovery time, and provided an accurate DA economic analysis system to estimate the power outage loss.
network power quality from the distributed power has been neglected. Therefore, the research about distributed power improving the power supply quality and reducing the distribution network equipment failure effect is also a critical issue.
Through analyzing the power load set based on fault-traverse technique and combining the AHP-TOPSIS method, this paper evaluated the effect of equipment failure from the loss of the equipment loss load (LL), user loss energy (LE) and power user level weighted number (WPOU) respectively. At the same time, in order to reduce the failure effect of equipment in distribution network, the contrastive analysis about the failure effect degree before and after accessing distributed power was performed in this paper. The calculation results showed that the access of distributed power into power distribution network can reduce equipment failure impact to society at different degree.
2. Analysis of Equipment Failure
Influence Degree
When the equipment on the distribution feeder failures, we mainly fuse or brake fuse, circuit breaker or load switch to realize fault isolation, and automatically reclose and close contact switch to continue to power supply for the fault section. For different equipment in distribution network, equipment failure influence degree are different, some spread to a wide range, some less affected.
Equipment failure influence degree is the comprehensive measurement of equipment fault consequences in the distribution network, the more serious the failure consequence is, the higher is the equipment failure influence degree.
2.1. Power Load Set of Equipment Failure
The influence degree of each equipment failure in distribution network is associated with failure consequence. Therefore, it is necessary to determine the equipment expected set of device-level fault accident. That is, when a device fails, its corresponding load within the equipment expected set S occur sustained power outage. After analyzing the failure consequence of each device on the feeder in the expected accidents set, the corresponding equipment failure fault power load set S on different feeders are built, which considers the transfer capability of tie lines and power supply capacity of distributed power supply[11].
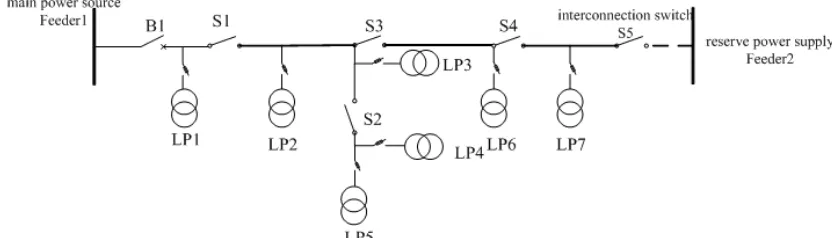
Figure 1 shows a typical feeder in distribution network. When the major equipment failure, the fuse, circuit breaker and load switch in the upstream of the equipment will fuse or brake fuse to isolate fault section, which will leads to the scope and influence of fault power are not the same. Usually, the fault coverage of feeder terminal equipment and branch line equipment failure is relatively larger than Feeder front-end equipment.
Taking load LP3 as an example, when it is broken-down, with varying fails, its upstream fuse will fuse, thus the fault isolation and power range at this time only for load LP3. However, when the overhead line between load switch S1 and S3 fails, the fuse upstream load switch S1 will brake to effectively isolate the fault segment. Under the condition of no standby power supply Feeder2, all the load power failure except LP1 load on feeder Feeder1, which cause a wide range of power outage. Where there exists power Feeder2, we should judge the S3 brake or S4 brake after calculating Feeder2 transport ability, then close contact switch S5 and realize Partial load of power supply. When the transport ability of Feeder2 meets the requirements of LP6 + LP7, the S3 break-brake, and the power load are LP2 LP3 and LP4 which narrows the power range.
Figure 1. Feeder structure in power distribution network
2.2. The Influence of Accessing Distributed Power on Power Load Set
Due to the instability of volatility output of distributed power supply, it is necessary to analyze the probability of distributed power maintaining supply power to the end user after forming island model. According to historical data or
The power outage situation within the scope is the same as other users, power equipment failure load set at this time there is no change[12].
3. Comprehensive Evaluation of
Equipment Failure Influence Degree
3.1. The Evaluation Index and Calculation Formula
The consequence of equipment failure is mainly for power supply enterprise and power users, and is closely related to the power supply reliability. Due to the different outage scope of equipment failure, the extents of effect are different. The main effect factors which reflect equipment failure influence degree contains of Loss load, loss power, number of outage users, user importance level and the blackout time. The low voltage problem of load node boils down to the short-term low voltage appearing after failure. However, due to the partial load power are removed and the feeder tide flow will reduce, even the length of the running feeder, the possibility of low voltage power supply is low, which can be neglected.
Therefore we choose four indicators to reflect the influence degree of equipment failure. The comprehensive evaluation indicators of equipment failure influence degree contains the loss of the equipment loss load (LL), user loss energy (LE), the number of hours without power (POUH) and power user level weighted number (WPOU).
When the equipment in distribution network failure, the loss load (LL) within S can be expressed by the annual average load, the calculation formula is shown in type (1):
∑
∈ = S i A i T ALL (1)
Among them, the is the annual power meter reading of distribution transform within S, is annual average run time of distribution transform in the distribution network[13,14].
Suppose the mean time to repair equipment is , the load of S will sustain blackout within , the loss energy LE is shown as follow:
R
LE=LL T× (2)
The number of hours without power (POUH) of equipment failure is calculated by:
R i
i S
POUH T LU
∈
=
∑
(3)The represents the users’ number of load I in the power load set S.
According to the load level, the influence level of different load is different. The influence degree is respectively the primary, the secondary load and the third level load in order. The power user level weighted number (WPOU) can be calculated by type (4), in which represents
the level of user of load node within the power load set S. The primary load is , the secondary load is and the third level is 1.
∑∑
∈ = = S i LU m m i WPOU 1α (4)
Different indicators reflects the effect of equipment failure from different sides, therefore a comprehensive evaluation method is need to reflect the failure level. Due to the contribution of the four evaluation index's is not same, the AHP method is used to determine evaluation index weights in this article, meanwhile, the ideal point sorting (TOPSIS) assessment method was adopted to realize the evaluation of equipment failure influence degree[13].
3.2. Calculating the Equipment Failure Influence Degree after Accessing Distributed Generation (DG)
When any equipment in distribution network
malfunctions, the power load set S without forming island power supply system and the power load set S* forming island can be formed, according to the circumstance of distributed power supply power output. The equipment failure influence degree of S* and S are calculated, respectively are L * and L. Suppose the probability of island formation is PG, and the equipment failure influence degree accessing DG is IN, which is shown as bellow:
*
(1
)
G G
IN
=
P
× + −
L
P
×
L
(5)Among them, the probability of island formation (PG) is calculated according to the historical load and the probability of PG distributed power supply power output data statistics.
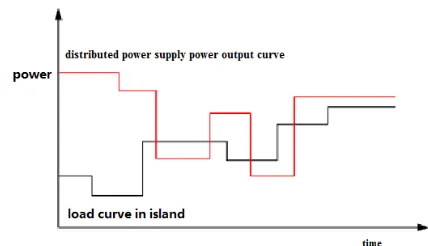
Figure 2 shows the load curve and distributed power supply power output curve within a certain time T. Suppose the time in which the load curve is on the distributed power supply power output curve, then the probability of island formation is [14].
Figure 2. The power generation capacity and load curve on the island system of DG
4. Empirical Analyze
network of A city as an example, the equipment failure influence degree before and after accessing the distributed generation is contrasted and analyzed. The power load sets of this distribution network contain of all equipment except interconnection switches. The maximum transfer power of feeder link F1 is 1500 KW.
The annual average power factor of distribution transform and load rate is respectively are 0.9 and 60%
respectively. The average operation time of distribution transfer power in on year is 7890 hours, meanwhile, suppose the user level load KU1 is 20, the secondary load KU2 is 10 and the probability of island formation PG is 0.73. Figure 4 the average load level of equipment on feeder, and the mean time to repair of all kinds equipment malfunction are shown in table1.
Figure 3. The feeder structure
Table 1. Mean time to repair of equipment malfunction
equipment mean time to repair of equipment malfunction /(hour/time)
Breaker (B) 9
Cable line (C) 8
Overhead line(L) 7
Load switch(K) 6.5
Fuse (R) 4
Power distribution (T) 5.5
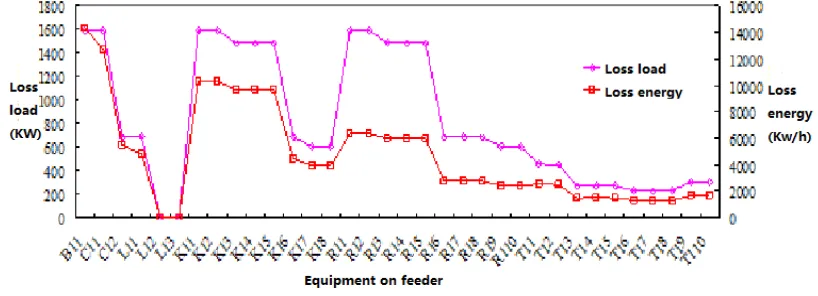
The power on power load set before and after accessing DG is found out by fault-traverse technique, and then the four indexes which represented the equipment failure influence degree: loss load (LL), user loss energy (LE), the number of hours without power (POUH) and power user level weighted number (WPOU) are calculated according
to the formula of 8 to 11.
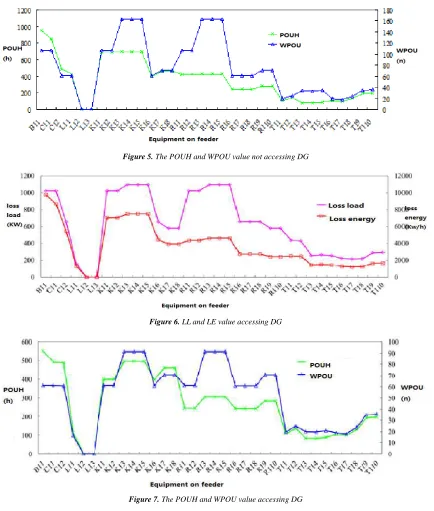
The indicator values of each equipment on feeder which is not accessed DG are shown in figure 4 and 5, and figure 6 and 7 shows the indicator values of each equipment on feeder accessing DG and forming island system.
Figure 5. The POUH and WPOU value not accessing DG
Figure 6. LL and LE value accessing DG
Figure 7. The POUH and WPOU value accessing DG
In order to identify the equipment failure influence degree, the TOPSIS comprehensive evaluation method is performed to integrate the above four indicators into a comprehensive index, which reflects the comprehensive influence after the equipment malfunction.
Firstly, according to the actual distribution network operation experience and expertise, the relative important degree judgment matrix of the four indicators: loss load (LL), user loss energy (LE), the number of hours without power (POUH) and power user level weighted number (WPOU) is given, such as type (6).
1 2 1 2 / 1
2 / 1 1 2 / 1 3 / 1
1 2 1 2 / 1
2 3 2 1
=
A (6)
Calling Matlab program accordingly, the weight vector of each index is (0.42359 0.22704 0.12232 0.22704), and the CI consistency index of judgment matrix is 0.00345 < 0.1, which indicates that the weight and the judgment matrix is consistent and reasonable.
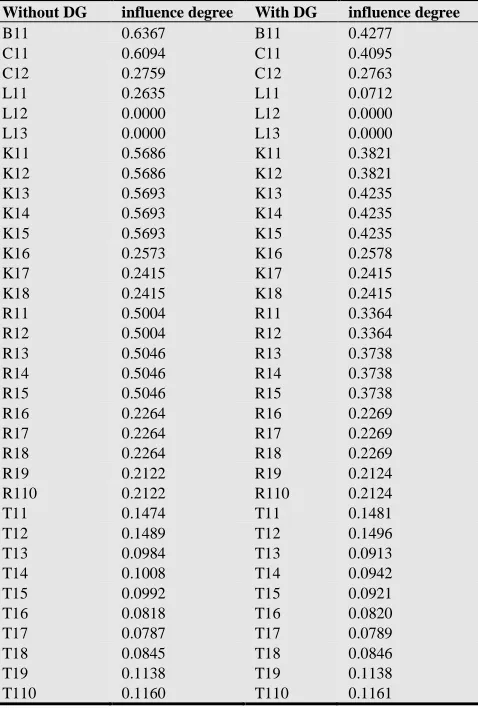
calculated, the results are shown in table 2.
According to relative calculation results, the equipment failure influence degrees are reduced Therefore, we can know that accessing DG into power distribution network can reduce the consequences of equipment failure.
Table 2. The equipment failure influence degree before and after accessing DG
Without DG influence degree With DG influence degree
B11 0.6367 B11 0.4277
C11 0.6094 C11 0.4095
C12 0.2759 C12 0.2763
L11 0.2635 L11 0.0712
L12 0.0000 L12 0.0000
L13 0.0000 L13 0.0000
K11 0.5686 K11 0.3821
K12 0.5686 K12 0.3821
K13 0.5693 K13 0.4235
K14 0.5693 K14 0.4235
K15 0.5693 K15 0.4235
K16 0.2573 K16 0.2578
K17 0.2415 K17 0.2415
K18 0.2415 K18 0.2415
R11 0.5004 R11 0.3364
R12 0.5004 R12 0.3364
R13 0.5046 R13 0.3738
R14 0.5046 R14 0.3738
R15 0.5046 R15 0.3738
R16 0.2264 R16 0.2269
R17 0.2264 R17 0.2269
R18 0.2264 R18 0.2269
R19 0.2122 R19 0.2124
R110 0.2122 R110 0.2124
T11 0.1474 T11 0.1481
T12 0.1489 T12 0.1496
T13 0.0984 T13 0.0913
T14 0.1008 T14 0.0942
T15 0.0992 T15 0.0921
T16 0.0818 T16 0.0820
T17 0.0787 T17 0.0789
T18 0.0845 T18 0.0846
T19 0.1138 T19 0.1138
T110 0.1160 T110 0.1161
5. Conclusion
(1) In this paper, the fault-traverse technique is used to identify the power on power load set of equipment. Meanwhile, in order to identify the equipment failure influence degree, the TOPSIS comprehensive evaluation method is performed to integrate four indicators into a comprehensive index, which realizes the comprehensive evaluation of the influence of the equipment malfunction.
(2) In order to reduce the influence of the equipment malfunction, the DG is accessed in to power distribution network. At the same time, a comprehensive evaluation method which can calculate the equipment failure influence degree before and after accessing DG into the power distribution network.
(3) The equipment failure influence degree before and after accessing DG were contrastively analyzed.
And the result showed that accessing DG into power distribution network can reduce the consequences of equipment failure.
Acknowledgements
This study is supported by The National Natural Science Foundation of China (71373076); State Grid Corporation of projects funded (contract number: 2012 - Technology -88)
References
[1] Li Tianyou, Zhao Huiru. Short interruption load classification cost appraisal characteristics analysis [J]. Automation of Electric Power Systems.2012,36(20):59-63.
[2] Chen Xiao, Wang Jianxing. The research on the estimation method of city grid user power loss and its [J]. Journal of
Kunming University of Science and
Technology,2003,28(1):53-58.
[3] Li Rui, Li Yue. Power Supply Interruption Cost of Important Power Consumers in Distribution Network and Its Emergency Management [J]. Power System Technology,2011,35(10):170-176.
[4] Wan Guanquan, Ren Zhen, Guo Xiaolong. CALCULATION OF CUSTOMER’S OUTAGE COST CONSIDERING
FEEDER AUTOMATION [J]. Power System
Technology.2005,29(1): 24-31.
[5] Aaron J. Praktiknjo, Alexander Hahnel. Assessing energy supply security: Outage costs in private households[J].Energy Polocy.2011,(39)12: 7825–7833
[6] Chun-Lien Su, Jen-Ho Teng. Outage costs quantification for benefit–cost analysis of distribution automation systems[J]. Electrical Power and Energy Systems.2007,29:767-774
[7] Mao Yiming,Miu K N.Switch placement to improve system reliability for radial distribution systems with distributed generation.IEEE Transactions on Power Systems,2003,18(10):1346-1352.
[8] De Britto TM, Morais D R, Marin M A, et al. Distributed generation impacts on the coordination of protection systems in distribution networks[C].2004 IEEE/PES Transmission and Distribution Conference and Exposition, Sao Paulo, Brazil,2004:623-628.
[9] Carpaneto E,Chicco G, Akilimali J S.Branch current decomposition method for loss allocation in radial distribution systems with distributed generation[J].IEEE Transactions oil Power Systems, 2006,21(3):1170-1179.
[10] Hu Hua, Wu Shan, Xia Xiang. Considering multiple distributed power access strategy to calculate voltage regulation constraints [J]. Proceedings of the CSEE,2006,26(19):13-17.
[11] Wang Xiuli, Wang Xikai. Complex system reliability evaluation [J]. Journal of Xi'an Jiaotong University.2000,34(8):9-13.
[13] Liu Zifa, Pang Chengcheng. Index Calculation of Load Density Based on IAHP and TOPSIS Methods [J]. Automation of Electric Power Systems.2012,13(36):56-60.