Experimentation and Optimization of injection
moulding process parameter through Taguchi
method and Mould flow analysis
Suyog P. Bhalerao
#1, T.Y.Badgujar
*2, D.R.Mahajan
#3#P.G. Student (Mechanical Design Engineering) Department of mechanical engineering LGN Sapkal COE,
Nashik, Maharashtra, India
Abstract— Injection moulding is a manufacturing process in which the molten plastic is inserted into a cavity called as mould. Material for the part is fed through hopper into a heated barrel, mixed, and forced into a mould cavity, where it cools and hardens to the configuration of the cavity. In this project Taguchi method is used for Optimization of Injection moulding process parameter. The experiments conducted by using Injection moulding De-Tech100 machine with material Kaiffa PBT 302 G0 used. S/N ratio is used to find the optimum combination of process parameters and importance of each parameter is known by performing ANOVA analysis. The last important aim was to find the effect of Injection pressure, Injection speed, screw speed and cooling time on injection moulding process. The injection moulding process parameters are also optimized using Mould flow analysis using mould flow advisor Autodesk. The main conclusion drawn from this project is that most of rejections are due to short filling which can be minimized by setting the all these parameters at high level.
Keywords: Plastic Injection moulding, Taguchi method, S/N ratio, ANOVA, Creo 2.0, Mould flow analysis.
I. INTRODUCTION
Injection moulding is a manufacturing operation in which molten plastic is inserted into a cavity called as mould. The molten plastic is injected into a mould bodily cavity to form the desirable shape. The different shaped plastic parts can be manufactured using injection moulding process. The plastic material is fed through hopper which flows from heated barrel and forced into mould cavity where it solidifies and gains shape of mould cavity. The different moulds are made by the design engineers according to the product design the mould are made by toolmakers from metal, mostly made from steel or aluminium. The mould may be of single or multiple cavities. Injection moulding can be achieved with large numbers of materials, like metals, elastomers thermoplastics and thermosetting plastics.
Injection moulding machine is mainly formed with two basic parts Injection unit and clamping unit. Injection unit melts the plastic and Inserts into mould cavity. Clamping unit clams the mould
together which opens and closes it automatically and ejects the finished part.
II.PROBLEMSTATEMENT
Industries using injection moulding process for production of plastic components are facing difficulty related to complete shape filling that is mould filling.
It is expected that the optimization of process parameters reduce shape filling problem. The various process variables considered for present study are injection pressure, injection speed, holding pressure, screw speed, nozzle temperature, cooling time.
III.LITERATURESURVEY
and warpage, cooling time and packing time are less significant, melt temperature and injection pressure are secondary.[4]Yiyo kuo, Taho Yang and Guan-wei huang[2008] used grey based Taguchi method for simulation optimization to solve a multi-response simulation-optimization problem.[5] Shi W. Lee & Seokyoung Ahn[2011] In these paper Taguchi method is applied effectively to study the difference and similarities among plastic injection moulding, metal injection moulding and ceramic injection moulding.[6] M. Packianathera, F. Chan[2013]presented the optimization of micro injection moulding process through DoE and Taguchi method. The DoE was used to identify the factors that were active and significant to study and fractional factorial experiment with Taguchi quality concepts has been conducted. And hence optimal setting found for the MIM process. [7] Daniele Annicchiarico & Jeffrey R. Alcock (2014) In this paper author reviwed the factors affecting shrinkage of moulded parts in injection moulding. He used selective screening of 10 papers published in last 10 years and organized it according to material, parameter, mould, specific Design, and found the critical processing parameters were temperature, packing pressure, cooling time, injection speed, temperature and packing pressure resulted critical factors at microscale. [8] B. KC, O. Faruk, J.A.M. Agnelli [2015] Presented an application of Taguchi method to optimize injection moulding process parameters of sigal/glass fiber hybrid composites. For experimentatin, L18 orthogonal array with a mixed-level design and signal-to-noise (S/N) of smaller-the-better was used. Optimal combination IM parameters were determined and the significant variables were identified using ANOVA. [9] Gurjeet Singh ,Ajay Verma [2017] Reviewed a brief information on injection moulding manufacturing processes and the different methodology’s used for various parameters.[10] M.H. Othman, S. Hasan & S.Z. Khamis (2017) controlled the quality characteristics like shrinkage and warpage and selected parameters were packing pressure, barrel temperature, screw speed and filling time. The process was performed based on the orthogonal array from Taguchi optimization method resulted in reduction in rejection due to warpage and shrinkage.
IV.METHODOLOGY
Fig.1 Methodology Flow chart
ProblemIdentification
Selection of process parameter Of Injection moulding machine
Start
Determination of level for process parameters
Selection of L8 Orthogonal array for Experimentation
Conduction of Experiment
Checking Rejection (Quantity)
Converted Result into S/N Ratio
Smaller the better
ANOVA Analysis
Main Effect Table & Graph
Optimized Parameters
Experimental Result
Moulding Die making using Creo
Mould Flow analysis
v
v
v
v
v
v
v
v
v
v
v
v
v
v
v
v
v
v
v
V.TAGUCHIAPROACH
The Taguchi methods are statistical tool defined by Genichi Taguchi to better the quality of manufacturing goods. It is utilised to optimise the process parameters and better the quality of components that are factory-made. The Taguchi method can be well explained using block diagram. Taguchi realized that the first possibility to rid of variation of the last outcome quality is through the product design stage and its manufacturing procedure. He established a plan of action for quality technology that can be utilised in both settings. The activity levels as follows 1) System design, 2) Parameter (standard) design, and 3) Tolerance design. System design is theoretical level, connecting creativeness and innovation. Parameter design: When the concept is accepted, the nominal values of the different measurements and design parameters appeal to be set, the detail design phase of conventional engineering. Taguchi method is important representation which gives perfect choice of variables needful is under-specified by the operation need of that system. In many condition, this allows the factor to be chosen so as to decrease the effects on performance originate from fluctuation in industry, surroundings and cumulative damage. This is also called as robustification. Factor can show controllable and intense noise variant; they desire to feat relation between optimize settings that decrease the effects of the noise variables. Tolerance design with a with success complected factor design and an apprehension of the outcome that the diverse factor have on performance, resources can be focussed on reduction and dominant fluctuation in the critical few dimensions.
A. SIGNAL-TO-NOISES (S/N) RATIO:
Taguchi tool uses the signal-to-noise (S/N) ratio. The S/N ratio show normal and change of the quality characteristics .The S/N ratio is a standard of demonstration intention at processing good and processes unreactive to noise factors. The standard S/N ratio used in three ways: Nominal is best (NB), lower the better (LB) and higher the better (HB). The lower value of short moulding behavior is predictable in this study. Characteristics used in S/N ratio is smaller-is-better functional in the analysis which is shown in table IX and can be calculated by using,
Smaller-is-the-better (minimize)
VI. EXPERIMENTAL CONDITION AND PLANNING OF EXPERIMENT:
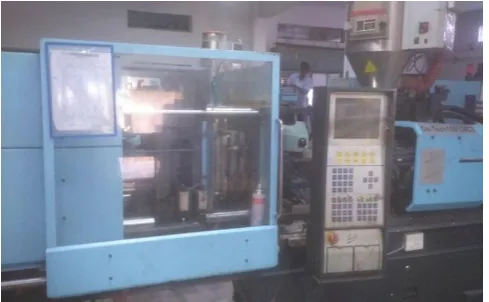
The Experimental work is carried out with the help of De-Tech100 Injection moulding machine as shown in the figure 2 and the technical specifications for the machine are shown in Table 1
Fig.2: Experimental Setup
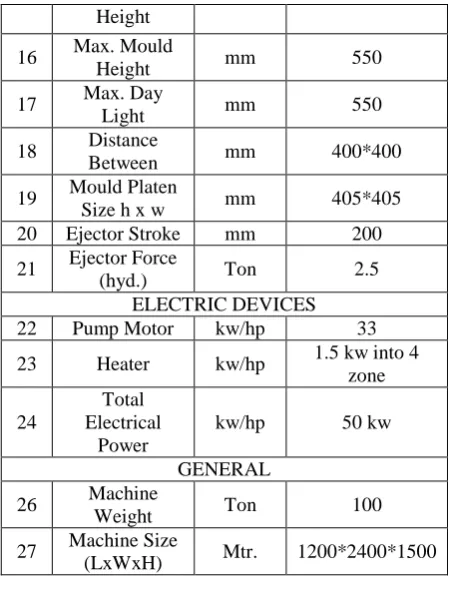
Table I
Technical Specification of Injection Moulding INJECTION UNIT
Sr.
No. Description Unit D-100
1 Screw
Diameter mm 35
2 Plasticising
Capacity Kg/Hr 90
3 Shot Volume cm3 145
4 Shot Wight
(PS) Gram 90
5 Injection
Pressure Kg/cm2 2000
6 Injection
Stroke mm 150
7 Injection Rate cm3/sec. 75
8 Screw
Revolution Rpm 150
9 Nozzle Stroke mm 250
10 Nozzle
Holding Force Ton 5
11 Heating Zones Nos. 5
12 Screw L/D
Ratio - 1:20
CLAMPING UNIT
13
Mould Clamping
force
Ton 100
14
Mould Opening
Stroke
mm 400
Height
16 Max. Mould
Height mm 550
17 Max. Day
Light mm 550
18 Distance
Between mm 400*400
19 Mould Platen
Size h x w mm 405*405 20 Ejector Stroke mm 200
21 Ejector Force
(hyd.) Ton 2.5
ELECTRIC DEVICES
22 Pump Motor kw/hp 33
23 Heater kw/hp 1.5 kw into 4 zone
24
Total Electrical
Power
kw/hp 50 kw
GENERAL
26 Machine
Weight Ton 100
27 Machine Size
(LxWxH) Mtr. 1200*2400*1500
A.PRODUCT INFORMATION
Name of Product: capacitor box
Raw material used: Kaiffa PBT 302 G0 BLU Mould ID:- Capacitor box
Application of Capacitor box:- 1) This product is used in electronic circuits. 2) Tape recorders, 3) Mother Board 4) Printers 5) Scanners 6) Televisions. Manufacturing method of product:- Injection moulding.
B.MATERIAL USED IN EXPERIMENTATION
The material used for the experimentation is Kaiffa PBT 302 G0 BLU and following are the properties of the given material.
Table II
Properties of material Kaiffa PBT 302: Sr.
No. Physical Properties Metric
1 Density 1.40 g/cc
2 Water Absorption 0.001
3 Linear Mold Shrinkage
0.014 - 0.020 cm/cm Mechanical Properties Metric 4 Tensile Strength at Break 45.0 MPa 5 Flexural Strength 80.0 MPa 6 Flexural Modulus 2.50 GPa 7 Izod Impact, Notched 0.280 J/cm 8 Charpy Impact Unnotched 2.50 J/cm² 9 Charpy Impact, Notched 0.300 J/cm²
Electrical Properties Metric
10 Volume Resistivity 1.00e+16 ohm-cm
11 Dielectric Constant Frequency 1e Ohm-cm 12 Dielectric Strength 20.0 kV/mm 13 Dissipation Factor 0.02
D. Selection of process parameter and their levels
According to literature review and Injection moulding machine the Identified process parameters are as follows: Injection pressure, Injection speed, Holding time, holding pressure, screw speed, Nozzle temperature, cooling time etc
.
TABLE III
Process parameter Identified are as follows
NO. Process parameter Symbol
1 Injection pressure A
2 Injection speed B
3 Holding time C
4 Holding pressure D
5 Screw speed E
6 Nozzle temperature F
7 Cooling time G
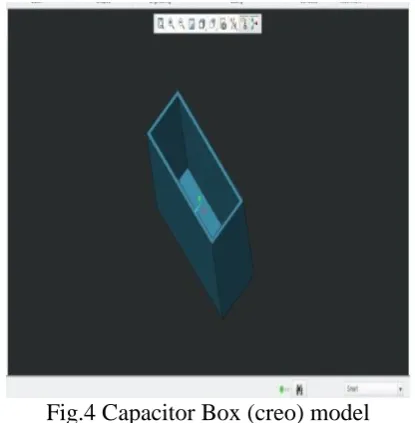
C.COMPUTER AIDED (CREO)MODEL:
Fig.4 Capacitor Box (creo) model
Fig.3 and Fig.4 showing the creo model of injection moulding die assembly with gating for material injection which is used for mould flow analysis.
Fig. 5 Exploded view of mould and plastic
part
E. P-B Design for Experimentation:
The screening designs elaborated by R. L. Plackett and J. P. Burman. And hence the name Plackett-Burman (P-B) designs. The P-B designs are based on Hadmard matrices in which the number of experimental runs or trials is multiple of four. I.e. N=4, 8, 12…, etc.
Table IV
8 Run Geometric P-B Design for the Experiment.
Sr.No. A B C D E F G
1 +1 -1 -1 +1 -1 +1 +1
2 +1 +1 -1 -1 +1 -1 +1
3 +1 +1 +1 -1 -1 +1 -1
4 -1 +1 +1 +1 -1 -1 +1
5 +1 -1 +1 +1 +1 -1 -1
6 -1 +1 -1 +1 +1 1 -1
7 -1 -1 +1 -1 +1 +1 +1 8 -1 -1 -1 -1 -1 -1 -1
Table V
Process parameters and their levels for Experimentation
No. Processing
parameters Unit
Levels
LOW(-1) HIGH(+1)
1 Injection
pressure Bar 960 1000
2 Injection
speed cm3/sec 53 60
3 Holding
time sec 0.1 0.4
4 Holding
pressure Bar 50 400
5 Screw speed rpm 25 35
6 Nozzle
temperature 0C 255 275
7 Cooling
time sec 3 5
Table VI
Experimental Result 8 Run Geometric P-B Design
No A B C D E F G R1 R2
1 1000 53 0.10 400 25 275 5 185 99
2 1000 60 0.10 50 35 255 5 410 410
3 1000 60 0.40 50 25 275 3 410 410
4 960 60 0.40 400 25 255 5 2 0
5 1000 53 0.40 400 35 255 3 0 0
6 960 60 0.10 400 35 275 3 62 49
7 960 53 0.4 50 35 275 5 410 410
8 960 53 0.10 50 25 255 3 395 369
VII. EXPERIMENTAL DESIGN USING TAGUCHI METHOD:
Table VII
An Orthogonal array [OA] L 8[23] for experiment.
NO. A B C D
1 960 53 25 3
2 960 53 35 5
3 960 60 25 5
4 960 60 35 3
5 1000 53 25 5
6 1000 53 35 3
7 1000 60 25 3
8 1000 60 35 5
Where A-Injection pressure (bar), B-Injection Speed (cm3/sec), C-Screw speed (rpm),D-Cooling Time (sec)
A.EXPERIMENTAL RESULT FOR ORTHOGONAL ARRAY
Table VIII
Taguchi L8 Experimental Orthogonal Array No. A B C D R1 R2 R
Means
1 960 53 25 3 4 7 6
2 960 53 35 5 4 2 3
3 960 60 25 5 2 2 2
4 960 60 35 3 2 2 2
5 1000 53 25 5 2 2 2
6 1000 53 35 3 1 1 1
7 1000 60 25 3 4 2 3
8 1000 60 35 5 1 0 1
(Where R1-Trial-1 Rejection In 10 strokes,R2- Trial-2 rejection In 10 strokes, R-means- (R1+R2)/2)
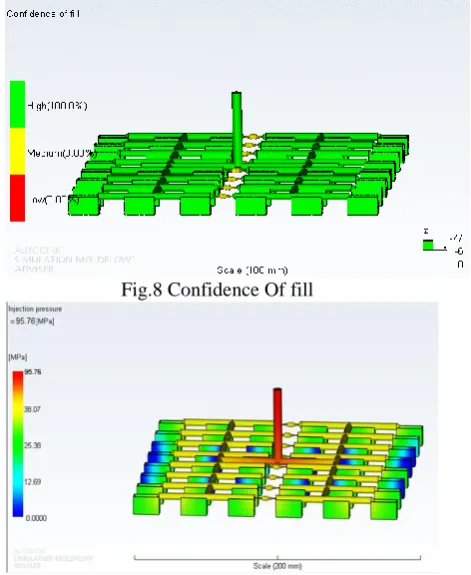
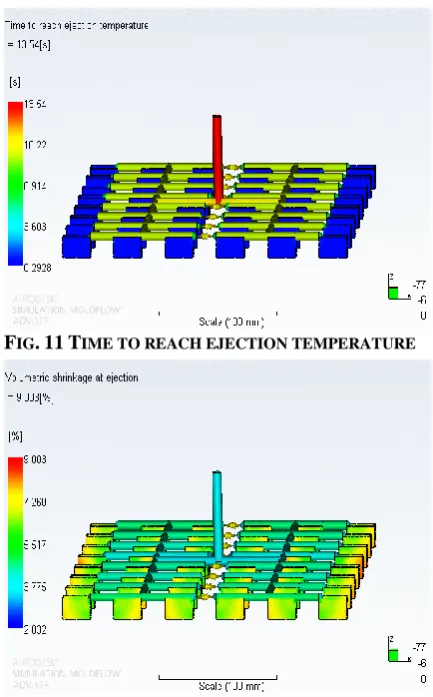
VIII. MOULD FLOW ANALYSIS.
Fig 6 Die and Component in Mould flow analysis
Fig. 7 Filling time required in Injection moulding
Fig.8 Confidence Of fill
FIG.9INJECTION PRESSURE
FIG.11TIME TO REACH EJECTION TEMPERATURE
FIG 12VOLUMETRIC SHRINKAGE AT EJECTION
IX. RESULT AND DISCUSSION:
Using Taguchi method Rejection is minimized during Plastic Injection Moulding Process by setting the parameters to high level.
Table IX
Signal to Noise ratio for Mean rejection
Sr.
No. A B C D Means
S/N ratio
1 960 53 25 3 6
-14.8073
2 960 53 35 5 3
-9.54243
3 960 60 25 5 2 -6.0206
4 960 60 35 3 2 -6.0206
5 1000 53 25 5 2 -6.0206
6 1000 53 35 3 2 -6.0206
7 1000 60 25 3 3
-9.54243
8 1000 60 35 5 1 6.0206
Table X
S/N Response Table for Rejection Means
A B C D
Level (Bar) (cm3/SEC) (SEC) 3.000
1 3.250 3.000 3.000 2.000
2 1.750 2.000 2.000 1.000
Delta 1.500 1.000 1.500 1.000
From Table IX and Table X it shows that Injection speed and cooling time is most Influencing parameter for Rejection and Injection pressure and screw speed are less Influencing parameters for rejection. Fig. 4 shows the main effect plot for mean Rejection.
Fig.13: Main effects plot for means
rejection
Table XI ANOVA Result
Analysis of Variance
Source DF Adj SS Adj MS
F-Value
P-Value INJECTION
PRESSURE (bar)
1 4.500 4.500 2.7 0.199 INJECTION
SPEED (cm3/sec)
1 2.000 2.000 1.200 0.353
SCREW
SPEED (rpm) 1 4.500 4.500 2.700 0.199 COOLING
TIME (sec) 1 2.000 2.000 1.200 0.353 Residential
From the mean effects plot for Rejection means it is clearly observed that Injection pressure, Injection speed, screw speed, cooling time should be set to high levels to reduce the rejection for short filling. Figur 7 shows the main effects plot for Mean Rejection and Table 11 shows ANOVAresult.
Table XII
Results obtained by Mould flow analysis. Actual filling time 0.32 (s)
Actual injection pressure 50.777 (MPa) Clamp force area 137.8701 (cm^2)
Max. clamp force during filling 49.757 (tonne)
Velocity/pressure switch-over at %
volume 98.29 (%)
Velocity/pressure switch-over at time 0.29 (s)
Total part weight at the end of filling 24.696 (g)
Shot volume 48.1078 (cm^3) Cavity volume 16.2720 (cm^3) Runner system volume 31.8358 (cm^3)
X. CONFIRMATORY TEST:
As the Optimum level of the design parameters selected, the last footstep is to predict and confirm the betterment of the quality characteristics using the optimal level of the design parameters. The estimated S/N ratio using the optimal level of the design parameter S/N ratio using the optimal level of design parameters can be calculated as [10]:
ηprediction =ηm + (A2- ηm) + (B2-ηm )+ (E2- ηm)+ (G2- ηm)
ηm= 14/8 = 1.75
ηprediction =1.75 + (1- 1.75) + (1.25- 1.75 )+ (0.75- 1.75)+ (1- 1.75)
ηprediction = 1.75- 0.75- 0.5 -1-0.75 ηprediction = -1.25≈ 0
Thus ηprediction shows that when all four parameters are set at high level there is approximately zero rejection due to short filling. Based on the mean effect plot the optimum setting found is as follows:
Table XIII Final Optimum setting
Sr. No.
Experimental Setting
Predicted
Settings Level
1 A2 A2 1000
2 B2 B2 60
3 E2 E2 35
4 G2 G2 5
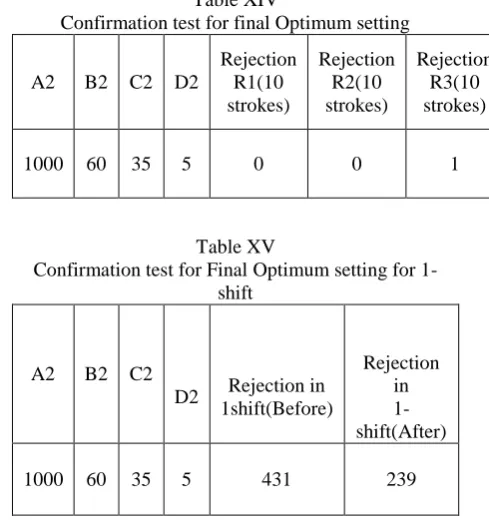
Table XIV
Confirmation test for final Optimum setting
A2 B2 C2 D2
Rejection R1(10 strokes)
Rejection R2(10 strokes)
Rejection R3(10 strokes)
1000 60 35 5 0 0 1
Table XV
Confirmation test for Final Optimum setting for 1-shift
A2 B2 C2
D2 Rejection in 1shift(Before)
Rejection in 1-shift(After)
1000 60 35 5 431 239
After the optimization the optimum settings are set in the machine for 1-shift and the rejection are counted before setting and after setting. The table 14 shows the Rejection count before and after setting.
XI. CONCLUSION
This paper represents an application of the Taguchi method in the optimization of Injection moulding process parameter. The conclusions drawn based on the Experimental result of this study are as mentioned below:
1) Taguchi’s [OA] design method is appropriate to examine the Injection moulding process parameter and their levels.
2) Taguchi method give simplex, organized and efficient methodology for the optimization of the Injection moulding process parameter.
3) The experimental results shows that high level Injection pressure (bar), high level Injection speed (cm3/sec), high level screw speed (rpm), high level cooling time (sec)i.e. A2B2C2D2 are recommended to reduce rejection in injection moulding.
4) The Injection moulding parameters can be confirmed using mould flow analysis.
5) The shape filling problem can be minimized by using taguchi method and mould flow analysis. 6)Mould flow analysis also shows Cycle time, best Gating pattern for filling by Iterative methods.
XII. ACKNOWLEDGMENT
Acknowledge and express my profound sense of gratitude and thanks to everybody who have been a source of inspiration during the experimentation. First and foremost I offer my sincere phrases of thanks with innate humility to Prof. T.Y. Badgujar, (H.O.D) Mechanical Engineering Department, LGN’s Sapkal COE, and Nashik for providing help whenever needed.
The consistent guidance and support provided by Prof. T.Y.Badgujarn is very thankfully acknowledged and appreciated for the key role played by him in providing me with his precious ideas, suggestions, help and moral support that enabled me in shaping the experimental work.
References:
[1] Nik Mizamzul Mehat & Shahrul Kamaruddin (2011) ―Investigating the Effects of Injection Molding Parameters on the Mechanical Properties of Recycled Plastic Parts Using the Taguchi Method‖, Materials and Manufacturing Processes, 26:2, 202-209.
[2] Nik Mizamzul Mehat & Shahrul Kamaruddin (2011)―Multi-Response Optimization of Injection Moulding Processing Parameters Using the Taguchi Method‖, Polymer-Plastics Technology and Engineering, 50:15, 1519-1526.
[3] Manoraj Mohan, M.N.M. Ansari & Robert A Shanks (2016): ―Review on the Effects of Process Parameters on Strength, Shrinkage, and Warpage of Injection Molding Plastic Component, Polymer-Plastics Technology and Engineering.
[5] Shi W. Lee & Seokyoung Ahn[2011] ―Effect of process parameters in plastic, metal and ceramic injection mouliding processes‖,vol.23, No. 3, September 2011 pp.127-138
[6] M. Packianathera*, F. Chana (2013) ―Optimization of micro injection moulding process through design of experiments‖, science direct, Procedia CIRP 12 (2013 ) 300 – 305.
[7] Daniele Annicchiarico & Jeffrey R. Alcock (2014) ―Review of Factors that Affect Shrinkage of Molded Part in Injection
Molding‖, Materials and Manufacturing Processes, 29:6, 662-682,
[8] KC, B., Faruk, O., Agnelli, J.A.M., Leao, A.L., Tjong, J., Sain, M.,(2015) ―Sisal/glass fiber hybrid bio composite: Optimization of injection molding parameters using Taguchi method for reducing shrinkage‖, Composites: Part A (2015)
[9] Gurjeet Singh & Ajay Verma[2017] ―Brief Review on injection moulding manufacturing process‖, science direct, Materials Today: Proceedings 4 (2017) 1423–1433.
[10] M.H. Othman, S. Hasan & S.Z. Khamis(2017)―Optimization of injection moulding parameter towards shrinkage and warpage for polypropylene-nanoclay-gigantochloa scortechinii nanocomposites‖, science direct, procedia engineering 184(2017)673-680.
BIOGRAPHIES
Mr. Suyog P. Bhalerao. received the degree in B.E. Mechanical from S.N.D.C.O.E & R.C. Yeola, Nashik, Maharashtra, India in July 2011 and pursuing master degree in (Mechanical Design Engineering) in LGN’S Sapkal College of Engineering, Nasik, Maharashtra, India under Savitribai Phule Pune University, Pune, and Maharashtra, India
Prof. T.Y Badgujar. is an Associate Professor in LGN’S Sapkal College of Engineering, Nasik, Maharashtra, India. He received the degree in B.E. Mechanical and Specialization in M.E. (Advance Production System). He has 19 Years’ experience.