World Maritime University
The Maritime Commons: Digital Repository of the World
Maritime University
World Maritime University Dissertations Dissertations
2005
Application of risk-based decision making on
planning VTS
Yaotian Fan
World Maritime University
Follow this and additional works at:http://commons.wmu.se/all_dissertations
This Dissertation is brought to you courtesy of Maritime Commons. Open Access items may be downloaded for non-commercial, fair use academic purposes. No items may be hosted on another server or web site without express written permission from the World Maritime University. For more information, please [email protected].
Recommended Citation
Fan, Yaotian, "Application of risk-based decision making on planning VTS" (2005).World Maritime University Dissertations. 294.
WORLD MARITIME UNIVERSITY
Malmö, SwedenAPPLICATION OF RISK-BASED DECISION
MAKING ON PLANNING VTS
By
YAOTIAN FAN
The People’s Republic of China
A dissertation submitted to the World Maritime University in partial Fulfilment of the requirements for the award of the degree of
MASTER OF SCIENCE
in
MARITIME AFFAIRS
(MARITIME ADMINISTRATION)
2005
Copyright Yaotian Fan, 2005
DECLARATION
I certify that all the material in this dissertation that is not my own work has been identified, and that no material is included for which a degree has previously been conferred on me.
The contents of this dissertation reflect my own personal views, and are not necessarily endorsed by the University.
(Signature): ……….
(Date): ………
Supervised by: Jens-Uwe Schröder Assistant Professor
World Maritime University
Assessor: Malek Pourzanjani Professor
Institution/organisation:World Maritime University
Co-assessor : Jens Froese
Professor, Executive Director Institution/organisation: Institute of Ship Operation,
ACKNOWLEDGEMENTS
My study at the World Maritime University (WMU), participation in the Maritime Administration course and subsequent preparation of this dissertation would not have been possible without the support and help of other people.
I would like to express my sincere gratitude to the Wuhan University of Technology and the Ministry of Communications of the People’s Republic of China, which nominated me to join the MSc course at the World Maritime University.
My special thanks go to the World Maritime University, which offered me such good opportunities and conditions for the 17-month study, and all the staff of WMU, who helped me gain a very real and valuable appreciation of the latest maritime developments, especially the staff of the library of the University. This thesis could not have been completed so smoothly without their great and patient assistance.
Specifically I am most grateful to Professor Schröder, my supervisor, who has been greatly encouraging me and offered his assistance and recommendations on my research at all times.
I also wish to say particular thanks to my colleagues at WMU and my friends in China for their firm support and considerable help.
Abstract
Title of Dissertation: Application of Risk-Based Decision Making on Planning VTS
Degree: MSc
The dissertation is a study of the methodologies of applying risk-based decision-making (RBDM) on planning VTS, under the framework of Formal Safety Assessment (FSA) recommended by IMO.
The concept of safety and risk as well as their relationship is introduced and discussed. A brief look is taken at the traditional and risk-based approaches to decision-making in terms of their concepts, principles, and comparison so that the advantages and necessity of RBDM to maritime safety are highlighted. With the presentation of the concept and principle of VTS, the significance of FSA on planning VTS is specified. The problem under analysis and its boundaries related to planning VTS is defined and a model for identifying a list of risks and hazards with associated scenarios, prioritized by risk level, is introduced. After some recommended models were examined, new methods based on the risk index theory are demonstrated in order to practically estimate the risk level and determine risk acceptability for planning VTS. Then, for uncovering the underlying factors of traffic accidents, the m-SHEL model and a new model based on the Reason model, which are especially suitable for specifying the relevant risk control options in the context of waterways management, are presented. The cost-benefit analysis for a prioritisation of the risk control options is elaborated in order to determine whether to implement the options. The dissertation concludes with an emphasis on the importance of RBDM on planning VTS, and gives a number of suggestions aimed at the further promotion of a proactive policy on planning VTS.
TABLE OF CONTENTS
Declaration ii
Acknowledgement iii
Abstract iv
Table of contents v
List of Tables viii
List of Figures ix
List of Abbreviations xi
Introduction 1
1.Risk-based Decision-making in Planning for a VTS 4
1.1 Safety and risk 4
1.2 Traditional approach to making decisions concerning maritime safety 6
1.3 Risk-based decision-making (RBDM) 8
1.4 Vessel Traffic Service (VTS) 9
1.5 Formal Safety Assessment (FSA) 11
2.Identification of Risks and Hazards 15
2.1 Define problem 17
2.1.1 VTS vessels 18
2.1.2 Types of VTS 19
2.1.3 Traffic rules and regulations 20
2.1.4 Risks to be considered 22
2.1.5 Geographical boundaries 24
2.2 Identification of risks and hazards 25
2.2.1 Local traffic hazards 29
2.2.2 Geographical Division 36
2.2.3 Preliminary rank of sub-areas 36
2.2.4 Preliminary evaluation of local accidents 38
2.2.5 Comparison and combination 41
2.2.6 Conclusion 42
3.Risk analysis 43
3.1 Risk estimation 44
3.1.1 Recommended models for risk estimation 45
3.1.2 Risk index approach for risk estimation 52
3.1.2.1 Weighted vessel traffic volume Qk 54
3.1.2.2 Weighted number of traffic accidents Pk 55
3.1.2.3 Risk index 56
3.2 Risk evaluation 57
3.2.1 Stakeholders involved in planning VTS 59
3.2.2 Risk Perceptions 60
3.2.3 Evaluation of risk acceptability/tolerability 61
4.Risk control options 63
4.1 Areas needing control 63
4.2 Alternative risk control options 64
4.3 Identifying risk control options 67
4.4 Marine incident investigation 70
5.Cost-benefit analysis (CBA) and recommendations for decision-making 76
5.1 Definition of interested parties 78
5.2 Catalogue the impacts of VTS and determine measurement units 78
5.3 Predict the costs of VTS 79
5.4 Risk reduction factor 81
5.6 Estimate the benefits of VTS 84
5.7 Assessment of the worthiness for VTS 88
5.8 Recommendations for decision-making 89
6.Conclusions and recommendations 90
6.1 Conclusions 90
6.2 Recommendations 92
7.References 95
8.Appendix A Port of Wuhan: a brief view 101
LIST OF TABLES
Table 1 Accident number in UK coastal area from 1957 to 1981 31
Table 2 Rank of sub-areas in Wuhan Port 37
Table 3 Failure Description in ETA 48
Table 4 Hazard and operability studies (HAZOP) 49
Table 5 Weighted coefficient according to ship’s size 55
Table 6 Weighted coefficient according to accident’ severity 55
Table 7 Defining casualties 56
Table 8 Weighted traffic volume and number of traffic accidents in Wuhan Port 57
LIST OF FIGURES
Figure 1 The basic principle of the traditional approach to decision-making 7
Figure 2 Flow chart of the FSA methodology 12
Figure 3 General risk assessment process 13
Figure 4 An illustration of the principle of the Chinese River Code for Preventing Collisions 21
Figure 5 An illustration of the sailing cross area 22
Figure 6 Factors contributing to marine accidents and affecting the level of port traffic environment 26
Figure 7 Step1 Identification of navigational and environmental risks 28
Figure 8 Accident number in UK coastal area from 1957 to 1981 31
Figure 9 The costs of oil spills 35
Figure 10 Rank of sub-areas in Wuhan Port 37
Figure 11 Average Distribution of Incident Types in Wuhan Port (2000-2004) 39
Figure 12 Distribution of Loss Types in Wuhan Port (2000-2004) 40
Figure 13 Geographical Distribution of Traffic Incidents in Wuhan Port (2000-2004) 41
Figure 14 Contact bridge FTA in Wuhan Port 46
Figure 15 ETA for passenger ferry on collision course with inspected vessel in Wuhan Port 47
Figure 16 Risk contribution tree (RCT) for planning VTS 51
Figure 17 Relation between vessel traffic density and the number of collisions 54
Figure 18 Risk index in Wuhan Port (1999-2003) 57
Figure 19 ALARP Matrix 58
Figure 20 ALARP Matrix based on risk index 62
Figure 21 Measures to ensure safety in shipping 66
Figure 22 Specify risk control options 69
Figure 24 Model for highlighting the deficiencies and insufficiency
in waterways management 73 Figure 25 Model of a passenger ferry accident 74 Figure 26 Ranking of alternatives in risk reduction
for Norfolk/Hampton Roads area 82 Figure 27 Costs per averted spill for all RCOs in situation 2001 and 2008
in Danish waters 84 Figure 28 Value of life and monetary injury costs 86 Figure 29 Distribution of vessel sizes in Wuhan Port
(visual surveys, 1999-2003) 104 Figure 30 Distribution of vessel classes in Wuhan Port
LIST OF ABBREVIATIONS
ALARP As Low As Reasonably Practicable
BF Beaufort Force
CBA Cost-Benefit Analysis
COLREGs Convention on the International Regulations for Preventing Collisions at Sea, 1972
DMA Danish Maritime Authority
EPA United States Environmental Protection Agency ETA Event Tree Analysis
FMEA Failure Mode and Effect Analysis
FSA Formal Safety Assessment
FTA Fault Tree Analysis
HAZOP Hazard and Operability Studies
IALA International Association of Marine Aids to Navigation and Lighthouse Authorities
ICOM Integrated Coastal and Ocean Management
IMO International Maritime Organization
ITOPF International Tanker Owners Pollution Federation Limited
ITU International Telecommunication Union
MOC Ministry of Communications of China
MSA Maritime Safety Administration
PSSA Particular Sensitivity Sea Area
RBDM Risk-Based Decision-Making
RCM Risk Control Measure
RCO Risk Control Option
RCT Risk Contribution Tree
SAR Search and Rescue
SFE System Failure Event
SOLAS International Convention for the Safety of Life at Sea, 1974
TSS Traffic Separation Scheme
UNCLOS 1982 United Nations Convention on the Law of the Sea
USCG United States Coast Guard
VTM Vessel Traffic Management
VTS Vessel Traffic Service
Introduction
Due to the development of larger and less manoeuvrable ships, the increasing traffic volume, dangerous cargoes and the potential for environmental pollution, establishing a VTS to reduce these risks, as a valid measure, has been a practical solution in many ports and waterways around the world. The number of VTS systems worldwide has increased rapidly during the last two decades and there are now about 500 of these services available in total. In particular, with the recent booming seaborne trade and reinforced awareness of a friendly marine environment, the implementation of new VTS and the re-assessment of an existing VTS worldwide are reaching a new high tide. However, constructing a VTS is a considerable investment and its subsequent operation is also very money-consuming. Consequently, how to plan a VTS perfectly, which will result in fulfilling its functions validly, contributing in reaching its purposes to the greatest extent as envisaged, and establishing whether the investment required is justified, are key considerations faced by each VTS stakeholder.
effectively to reducing risks, maximizing the protection of maritime safety and the environment as well as increasing traffic efficiency.
The traditional approach to safety in the maritime sector has been reactive - to react to problems as they occur. Instead of reacting in an ad hoc way to a problem, a careful analysis of the risk situation should be carried out while keeping financial and resource constraints in mind, which is of special importance to the concerned stakeholders and decision-makers. So in order to lower risks rationally as much as possible, it is suggested that when planning a VTS, decision-makers should use proactive methods, which could be the application of the principle of risk-based decision-making on maritime fields.
A practical framework recommended by IMO for RBDM on maritime fields is Formal Safety Assessment (FSA). This gives decision-makers a clearer insight into the policy and a trustworthy platform on which they form policies and can assist them to evaluate the rationality, necessity and cost-effectiveness of a marine project. So it is very useful and significant to do the research concerning the application of FSA, a framework of RBDM on the maritime sector, when planning for a VTS.
This dissertation outlines a process for developing an evaluation tool to be used as the basis for a systematic approach for planning VTSs. The main issues are illustrated through a detailed case study, the Wuhan Port in China, which demonstrates the large range of an area that can be tackled successfully using several newly introduced approaches in the framework of FSA. Thus, the objectives of this paper are:
• To provide decision-makers with useful tools and references for the planning of a new VTS or the re-assessment of an existing VTS, for the purpose of achieving the ultimate goals of marine safety and environmental protection as well as efficient traffic.
• To develop comprehensive marine traffic risk assessment models in order to assess the adequacy and efficiency of the existing mitigation and control systems, develop supplementary measures to tackle the risks, if required, establish a basis for deciding the implementation of measures which can reduce the risk in planned area, as well as form a basis for prioritising the individual risk control options.
CHAPTER 1
Risk-based Decision-making in Planning for a VTS
The purpose of a Vessel Traffic Service (VTS) is to improve the maritime safety and efficiency of navigation, safety of life at sea and the protection of the marine environment and/or the adjacent shore area, work sites and offshore installations from the possible adverse effects of marine traffic in a given area (IALA, 2002). Its performance regarding these aspects greatly depends on the rationality, justifiability and cost-effectiveness related to planning such a large maritime project.
This chapter will introduce the basic concepts of safety and risk as well as their relationship. The traditional approach to making decisions concerning maritime safety will be re-examined, then the concept of risk-based decision-making will be introduced and examined with the aim of identifying its advantages and necessity for marine safety. Next, the concept and principle of VTS will be presented, and the significance of Formal Safety Assessment (FSA), a framework for RBDM recommended by IMO, on planning VTS will be specified.
1.1 Safety and risk
to the whole of human society and has become the province of the public and private sectors.
The term “safety” is discussed widely in literature from different perspectives and its definition is interpreted variously. For instance, safety is defined in the Concise Oxford Dictionary, as “freedom from danger”, while Kuo C. (1998) interprets: safety is “perceived quality that determines to what extent the management, engineering and operation of a system is free of danger to life, property and the environment”. Although safety has different definitions, a generally accepted view of safety could thus be embodied from these definitions: absolute safety is not available and there is always room for achieving more freedom from danger (Kuo, 1998).
Similarly, the term of risk is mentioned in different contexts, by different scholars, and is defined in different literary expressions. For instance, the US Presidential/Congressional Commission on Risk Assessment and Risk Management (1997) defines risk as “the probability of a specific outcome, generally adverse, given a particular set of conditions”; Warner (1992) proposes a definition with two factors: “risk is a combination of the probability, or frequency, of occurrence of a defined hazard and the magnitude of the consequences of the occurrence” (Warner 1992 cited in Jones and Hood 1996).
No matter how risk is defined, there is a consensus in realistic society: zero risk does not exist and what people can do is to reduce the risk to the level toward which they can be satisfied. This level is related to human risk perceptions, which could vary with different individuals, or different circumstances. For example, the public has become accustomed to thousands of fatalities caused by car accidents annually, however it cannot tolerate an incident such as the “Prestige” occurring again.
to which the system presents danger to life, property and the environment, by risk. Consequently, safety could also be expressed by risk in the reverse direction: higher risk, less safety; lower risk, more safety. Thus just like what could be drawn from the popular definition of safety “safety is a state where the level of risk has been reduced to a baseline of as low as reasonably practicable”, it is feasible and reasonable to improve safety by controlling and reducing risks.
In addition, safety is an abstract term, while the term of risk is more concrete and can be qualified and quantified by various means. It is therefore practical to represent safety by means of risk and improve safety by managing risks (Xie, 2001).
1.2 Traditional approach to making decisions concerning maritime safety
Rob Dixon (2003) states in his book that “decision-making, which lies at the heart of management, is a process of thought and action that leads to a decision”. Managers spend their time choosing between alternative courses of action on the basis of the information available to them at the time. Since the first wooden canoe of primitive build challenged the vast oceans and seas, the marine industry has always been regarded as a risky business, accordingly people have been struggling with mitigation of marine risk and improving maritime safety constantly through history in order to maintain and promote this indispensable industry to world trade, while decision-makers have also been developing relevant marine policies to achieve the above attempts.
An old example of this approach is the Titanic incident: after this disastrous casualty people realized the importance of sufficient lifesaving equipment and damage stability, so that the decision to create a new Convention (SOLAS, 1914) was made. A recent example is the introduction of double-hull tankers: people drew lessons from severe oil pollution accidents such as the Exxon Valdez accident in 1989 and
the Prestige accident in 2002 etc. and stipulated marine policies to phase out
single-hull tankers.
Draw lesson, and change
Review Fail
Do according to experience
New experience
Failure mode Reinforce/confirm
old experience Succeed Do according
to experience
Successful mode
Figure 1: the basic principle of the traditional approach to decision-making
Source: Xie. (2001). Risk-based Approach to Maritime Safety. Unpublished master’s dissertation, Malmö, Sweden: World Maritime University.
1.3 Risk-based decision-making (RBDM)
Risk-based decision-making has become a hot topic recently in industry and government, and the maritime community is no exception. The United States Coast Guard (USCG, 2005) defines it as “a process that organizes information about the possibility for one or more unwanted outcomes into a broad, orderly structure that helps decision makers make more informed management choices”.
The adoption of different maritime policies will result in various outcomes. Some are what we want while others are unwanted outcomes which include the harmful effects on safety and health, environmental damage, property loss, or mission failure etc. An obvious feature of risk-based decision-making differing from the traditional approach to decision-making is that the information about the possibility for one or more unwanted outcomes is considered. RBDM adds to the decision-making process a systematic consideration of diverse risks that may be important to various stakeholders. A wide range of risk analysis tools (from very simple to very sophisticated) is available to help decision-makers develop the right information about risks to support their decision-making. Macesker & Myers (2005) say: “The question is not, ‘Should I use risk-based decision-making?’ The question is, ‘How should I use risk-based decision-making?’ The key is to focus on using the most suitable tool(s) for detailed situations.”
effectively to reducing risks, maximizing the protection of maritime safety and environment as well as increasing traffic efficiency (AIChE, 1997).
1.4 Vessel Traffic Service (VTS)
Due to the development of larger and less manoeuvrable ships, the increasing traffic volume, dangerous cargoes and the potential for environment pollution, establishing a VTS to reduce these risks, as a valid measure, has been a practical solution in many ports and waterways around the world. The number of VTS systems worldwide has increased rapidly during the last two decades and there are now about 500 of these services available in total. In particular, with the recent booming seaborne trade, the implementation of new VTS and the re-assessment of an existing VTS worldwide are reaching a new high tide. However, constructing a VTS is a considerable investment and its subsequent operation is also very money-consuming; some VTSs do not play an important role as people anticipate; many seafarers regard VTS simply as a party they have to contact when passing through reporting lines while some VTS cannot provide sophisticated services for crew or cannot meet local waterborne traffic requirement; some VTSs have had to close down because of financial considerations, (for instance New York VTS stopped its services in 1988 and reopened in 1990 due to budget problems etc.). All these depressing news has prompted those persons, who were enthused to establish VTS once, to speculate calmly about what is wrong with it.
The maritime industry operates in an increasingly complex world in which changes – technological, financial, organizational – take place more quickly, are more extensive and run deeper than ever before. Rapid changes lead to higher risk and a greater need to understand and analyse the risk. The final results will depend on how these factors are dealt with in practice in advance and how the important elements are analysed (Ullring, 1998). Consequently, how to plan a VTS perfectly, which will result in fulfilling its functions validly, contributing in reaching its purposes to the greatest extent as envisaged, and establishing whether the investment required is justified, becomes key considerations faced by each VTS stakeholder.
careful analysis of the risk situation should be carried out while keeping financial and resource constraints in mind, which is of special importance to the concerned stakeholders and decision-makers. So in order to lower risks rationally as much as possible, it is suggested that when planning a VTS, decision-makers should use proactive methods, which could be the application of the principle of risk-based decision-making on maritime fields. A practical framework recommended by IMO for RBDM on maritime fields is Formal Safety Assessment (FSA).
1.5 Formal Safety Assessment (FSA)
FSA was originally developed partly at least as a response to the Piper Alpha disaster of 1988, when an offshore platform exploded in the North Sea and 167 people lost their lives (IMO, 2005). As a result of the studies with respect to scientific decision-making for years, two organs of IMO, MSC and MEPC, jointly developed and approved “the Guidelines for Formal Safety Assessment (FSA) for use in the IMO rule-making process”. As the Guidelines (2002) mention, FSA is a structured and systematic methodology, aimed at enhancing maritime safety, including the protection of life, health, the marine environment and property, by using risk analysis and cost benefit assessment. It provides a framework for applying the principle of RBDM in the IMO rule-making process.
the author’s point of view, it is very useful and significant to do the research concerning the application of FSA, a framework of RBDM on the marine sector, when planning VTS.
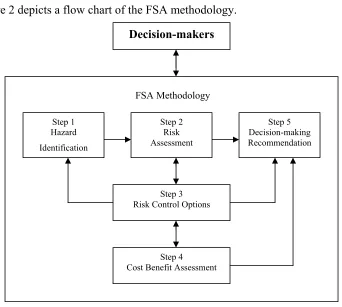
According to the IMO Guidelines (2002), FSA should comprise the following five steps:
.1 identification of hazards; .2 risk analysis;
.3 risk control options;
.4 cost benefit assessment; and
.5 recommendations for decision-making.
Figure 2 depicts a flow chart of the FSA methodology.
FSA Methodology
Step 5 Decision-making Recommendation
Step 4 Cost Benefit Assessment
Step 3 Risk Control Options
Step 2 Risk Assessment Step 1
Hazard Identification
Decision-makers
Figure 2: Flow chart of the FSA methodology
Many scientific disciplines deal with FSA in order to develop solutions for applications in their particular field of interest. As a result of the often- interdisciplinary nature, numerous approaches for a variety of safety and security problems have been developed over the years. Although there are many different methodologies available in order to evaluate different kinds of risks they all follow similar principles, which can be seen in the following Figure 3 (Schröder, 2005).
Risk analysis
Risk evaluation / management
Yes
NO
Develop / introduce risk reduction measures
• Hazard prevention
• Mitigation
No further action necessary but review hazards and risk evaluation regularly
Are hazard control measures adequate?
Evaluate risks
Compare risk levels with acceptance criteria
Risk estimation
• Estimate hazard frequency (likelihood)
• Estimate risk
Evaluate hazards
• Establish underlying causes • Determine extent/nature of consequences
Identify risks
Figure 3: General risk assessment process
Source: Waring & Glendon (1998)
decision-makers would be satisfied or accept. In further steps, the specified options need to be determined whether or not they are worthwhile through conducting a cost-benefit analysis. The option that is assessed as a cost-effective one will generally be adopted and presented in decision-making recommendations.
CHAPTER 2
Identification of Risks and Hazards
In the previous chapter, the concept and process of FSA was briefly introduced. FSA, as a practical framework for RBDM on maritime sectors, adds to the decision-making process a systematic consideration of diverse risks and hazards that influence the various stakeholders. So identification of the risks and hazards is logically regarded as the first step of FSA, which comprises five steps in total as seen in Figure 2.
At the inception of FSA, the first step is to answer the question of what categories of hazards exist in the defined system, which lead to the failure or unacceptance of the system. In its guideline for FSA, IMO (2002) points out that:
The purpose of step 1 is to identify a list of hazards and associated scenarios
prioritized by risk level specific to the problem under review. The purpose is
achieved by the use of standard techniques to identify hazards which can
contribute to accidents, and by screening these hazards using a combination
of available data and judgement.
and essentially uncover the underlying causes behind the levels that can not be accepted by decision makers and need to be improved by the means of establishing a new VTS or upgrading an existing VTS. These two tiers of factors correspond to the two approaches used for hazard identification. The former is achieved by using an analytical technique whereas the latter is put into effect using creative methods. In the Guidelines on Risk Management, IALA (2000) recommends that the two approaches be combined in order to identify as many relevant hazards as possible.
In hazard identification methodology, the analytical element ensures that previous experience is properly taken into account and typically makes use of background information as followed in terms of planning VTS:
1. the existing navigational regulations;
2. historical statistical data on maritime accidents; 3. traffic volume per year within the planned VTS area;
4. main mixture of traffic flows (main crossing traffic flows against main traffic flow);
5. the category and amount of dangerous cargoes loaded and discharged within the defined port per year;
6. the local conditions like geography, hydro/meteo, tides and weather; 7. the local marine environment affected by shipping industry.
The creative element is to ensure that the identification process is proactive through aiming at identifying the causes and effects of accidents and relevant hazards instead of confining it only to hazards that have materialized in the past. As is known to all, the human element is the most important contributory aspect to the causation and avoidance of incidents. So appropriate techniques for incorporating human factors should be used. In Resolution A.947 (23), IMO (2003) states that:
The human element is a complex multi-dimensional issue that affects marine
safety, security and marine environmental protection. It involves the entire
management, regulatory bodies, recognized organizations, shipyards,
legislators, and other relevant parties, all of whom need to co-operate to
address human element issues effectively.
In applying FSA when planning for a VTS, the decision-makers shall focus on how errors in respect of ships’ crews, shore-based management and regulatory bodies lead to the failure of the system which can be defended to reach an acceptable standard by implementing waterways management, especially by establishing a VTS in a planned area. In the third step of FSA, risk control options (RCOs) will be elaborated and potential risk control measures (RCMs) could be identified through analysing these human errors, so the underlying causes may also be left to step 3 to be uncovered.
2.1 Define problem
As a structure and systematic methodology by using risk analysis and cost benefit assessment, FSA may be applied widely in fields from the IMO rule-making process to a maritime administration proposal for regulatory measures, and from the formulation of a new IMO instrument to planning a maritime project regardless of its scope. Although FSA has a similar principle, concept and steps in all kinds of research as long as it is applicable, decision-makers should take into account different factors determining the performance of a system and its corresponding range of study when aiming at a specific project or a category of projects so that the problem under analysis and its boundaries could be carefully defined stating the associated risk issues. This is the most important phase in FSA and it both guides the whole process, how to be within a proper boundary, and guarantees that the limited research resources are appropriately utilized and deployed.
• Range of the vessel
• Geographical boundaries
• Risks to be considered
• Vessel systems
• Relevant regulations
• Measures of risks
Based on the above proposal of the specialists, as well as the features and functions VTS has in doing waterways management, problem definition in terms of planning VTS may focus on the following six aspects: VTS vessels, types of VTS, traffic rules and regulations, risks to be considered, geographical boundaries and determination of risks.
2.1.1 VTS vessels
especially when they do not possess any capability of communication. Generally speaking, VTS services are rendered via VHF. Consequently, VTS vessels may be defined as the vessels carrying VHF in the VTS area.
In the water area of Wuhan port, all ships must at least be equipped with VHF working on channels 8 and 16 in accordance with the norm of Chinese river ship construction and classification or SOLAS 74, except a very small number of wooden fishing boats and barges without power which are always towed or pushed by tugs. This provides a prerequisite for establishing VTS because communication, as one of the essential ingredients of the VTS system, makes sure the establishment of valid relations between VTS organization and VTS vessel.
2.1.2 Types of VTS
A VTS can improve the safety of traffic through the foresighted prevention of situations of unacceptable risk, by contributing to safe encounters from the above foresighted measures and by assisting ships to keep within navigable waters (IALA, 2002). In the process of FSA, the application of which would be particularly relevant to proposals which may have far-reaching implications in terms of either cost or the legislative and administrative burdens that may result, cost/benefit analysis plays a vital role in justifying the discussed projects or measures. The benefits achievable by a VTS depend on its types which may be divided by the services provided and the functions performed, as follows:
The Information Service ensures that essential information is available in a timely manner to the shipboard decision process, either by broadcasting at fixed times or if deemed necessary by the VTS. This is normally provided to general traffic.
The Navigational Assistance Service assists the navigational decision-making process on board, participating by giving information and services.
The Co-operation with allied services and other interested parties is a supporting service for exchanging information, using common data bases and action agreement. (IALA, 2002)
When planning VTS, decision-makers should determine the type of planned VTS and associated level of the above mentioned services on the basis of the outcomes of hazard identification (step 1) and risk analysis (step 2).
2.1.3 Traffic rules and regulations
Although COLREG 1972 has a predominant status in worldwide seaborne traffic, as far as port areas, coastal areas and other sensitive waters are concerned, navigation safety and efficiency generally need to be reinforced through adopting and implementing the relevant traffic rules and regulations which may include not only those defining the navigational requirements such as traffic routes, speed limits, anchorage areas etc, but also any special requirements such as compulsory pilotage and pilot boarding areas, traffic separation schemes, ship reporting systems and prohibited or precaution zones etc. In other words, the risk level of an area depends on its traffic patterns to some extent.
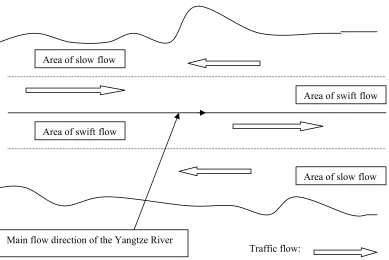
However, as shown in Figure 4, the principle of the Code could be summarized in one sentence: ships sailing down go by swift flow whereas ships going upstream navigate by slow flow.
Traffic flow: Area of slowflow
Area of slowflow Area of swiftflow
Area of swiftflow
Main flow direction of the Yangtze River
Figure 4: an illustration of the principle of the Chinese River Code for Preventing Collisions
Sailing cross area
Main flow direction of the Yangtze River:
Dangerous concave area: Traffic flow of going upstream:
Figure 5: an illustration of the sailing cross area
2.1.4 Risks to be considered
What is risk? Is it synonymous to hazard? The report of a Royal Society Study Group (1992) defines risk as “the probability that a particular adverse event occurs during a stated period of time, or results from a particular challenge where an adverse event is an occurrence that produces harm”. As to hazard and harm, the report (1992) states that “hazard is seen as the situation that in particular circumstances could lead to harm, where harm is the loss to a human being (or to the human population) consequent on damage and damage is the loss of inherent quality suffered by an entity (physical and biological)”.
impact on the safety of the ship, marine environment and traffic efficiency. Examples of these events are fires, explosions, environmental damage, release of toxic gases, collisions, groundings, extreme weather, structural failure and loss of stability etc. (Monioudis, 1997). So from the angle of the marine industry, risk can be explained as the probability that a maritime incident occurs during a stated period of time.
Different agencies define marine incidents in different ways. In the Code for the Investigation of Marine Casualties and Incidents (IMO, 1997), it is stated that:
Marine incident means an occurrence or event being caused by, or in
connection with, the operations of a ship by which the ship or any person is
imperilled, or as a result of which serious damage to the ship or structure or
the environment might be caused.
The Regulations of China on the Investigation and Handling of Maritime Traffic Accidents (1990) is applicable to the following accidents occurring to vessels and installations:
(1) Collision, strike or damage by waves;
(2) Hitting hidden rocks or running aground;
(3) Fire or explosion;
(4) Sinking;
(5) Damage or loss of machinery parts or important tools during a voyage which affects the vessel's seaworthiness;
However, in planning VTS, risks to be considered only comprise those accidents related to movements and the dynamics of vessels that could be prevented or decreased by VTS, including collision, grounding, hitting hidden rocks, contact, wave damage etc, plus damage to the environment or fire and explosion if caused by the above incidents. On the other hand, when making a cost/benefit analysis in the fourth step of FSA, the decision-makers should take into consideration of other accidents in estimating the benefit that the establishment of VTS can contribute to, because VTS could participate in SAR activities and mitigate the consequence of those accidents. For instance, an explosion caused by crew smoking on board the ship should be excluded in identifying the risks and hazards of FSA step1, whereas it should be considered in doing cost/benefit analysis if VTS is involved in the rescue of this ship.
2.1.5 Geographical boundaries
There are three categories of VTS: Port or Harbour VTS, Coastal VTS and River VTS. A Port VTS is mainly concerned with vessel traffic to and from a port or harbour or harbours, while a Coastal VTS is mainly concerned with vessel traffic passing through the area (IMO, VTS Guidelines, 1997). A River VTS which usually renders information services as well as navigational assistance and traffic organization services, could be regarded as a combination of these two types. In its Guidelines, IMO sets out eleven criteria for an area in which VTS is particularly appropriate if the area meets any of them. In fact, these criteria also theoretically determine the geographical boundaries of a planned VTS. In FSA, the decision- makers may refer to these criteria to define what areas need to be studied.
FSA when planning Wuhan VTS. The Geographical boundaries of this study are the same as those described in a brief view of Wuhan port in Appendix A.
2.1.6 Determination of risk
Mathematically, risk is defined as the probability of an adverse event times its impact. The probability can be simply expressed as the mean number of marine accidents per year or be more complicatedly estimated by establishing mathematical models, while the impact, provided that it occurs, can be calculated in different ways. There are monetary methods, count methods and index methods.
Monetary methods are particularly appropriate to evaluate the loss in the form of damage to property or economy. They also facilitate the analysts to categorize the accidents in terms of loss as well as make acceptability and cost/benefit analyses in the process of FSA due to its obvious comparability. However, in some circumstances, it is not always easy to calculate the loss in monetary terms, especially when life loss, damage to the environment and impact on mentality and psychology are involved. Instead, it is sometimes easier to simply count the amount of loss that happened in the stated years. Index methods, which determine the level of risk by giving weight value to individual accidents, are a variety or a combination of the former two kinds of methods. All these three types of methods can be used by decision makers at their discretion in FSA according to the data and information they can collect.
2.2 Identification of risks and hazards
this can be done and these will vary depending upon the risks under consideration and the particular methodology being employed (Dickson, 2003).
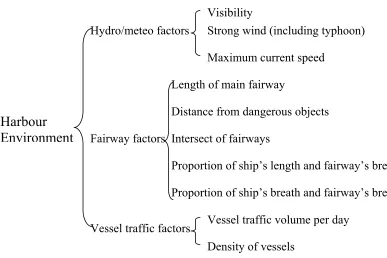
The Chinese VTS project group (1989) thought that there are a lot of factors contributing to marine accidents in harbours and affecting the level of port traffic environment, which could be generally categorized into three main groups as shown in Figure 6: hydro/meteo factors, fairway factors and vessel traffic factors. These factors can be regarded as risks and hazards that need to be identified in planning VTS.
Figure 6: Factors contributing to marine accidents and affecting the level of port traffic environment
Source: Chinese VTS project group. (1989). Research Reports on Class Division of Vessel Traffic Management In Coastal Harbour of China. Dalian: Author.
Length of main fairway
Density of vessels
Vessel traffic volume per day Intersect of fairways
Distance from dangerous objects Maximum current speed
Strong wind (including typhoon) Visibility
Vessel traffic factors Fairway factors Hydro/meteo factors
Proportion of ship’s breath and fairway’s breath Proportion of ship’s length and fairway’s breath
Harbour
Environment
Prestige etc. Consequently, it is necessary to add the factors covering dangerous cargoes and marine pollution into the above lists for more comprehensive identification of the local traffic hazards.
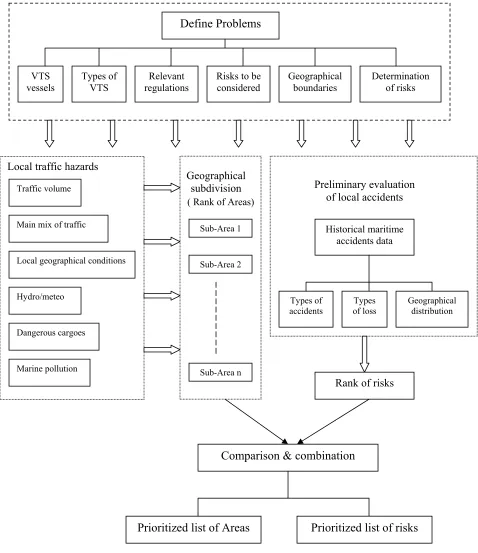
Then according to a preliminary description of these hazards, as well as qualitative and quantitative analysis, the whole water area being studied in planning VTS can be divided into several sub-areas which are ranked in view of the sensitivity of navigation safety and the marine environment. Moreover, through collecting and analysing the historical maritime accident data in the evaluated area, local accidents or risks can also be ranked by considering types of accidents, types of loss and their geographical distribution. Next, the comparison and combination between rank of areas and rank of risks could result in a prioritized list of areas and a prioritized list of risks. The model for Step1, identification of navigational and environmental risks, is indicated in Figure 7:
Prioritized list of risks Prioritized list of Areas
Comparison & combination
Rank of risks Preliminary evaluation
of local accidents
Geographical distribution Types
of loss Types of
accidents
Historical maritime accidents data
Geographical subdivision
( Rank of Areas)
Sub-Area n Sub-Area 2 Sub-Area 1
Local traffic hazards
Marine pollution Dangerous cargoes Hydro/meteo
Local geographical conditions Main mix of traffic
Traffic volume
Determination of risks Geographical
boundaries Risks to be
considered Relevant
regulations Types of
VTS VTS
vessels
Define Problems
2.2.1 Local traffic hazards
• Traffic volume
Traffic volume means the sum of amount of vessels in a specific area during a stated time, including transit traffic, entry/leave port traffic and internal traffic, which reflects to what extent the area is busy or congested. Generally speaking, more traffic volume could result in higher maritime risks. Fujii & Matui (1984) give two mathematic formulas as followed when estimating frequency of collisions with objects and groundings as well as frequency of ships collision:
Nau1=
∫∫∫
ρ
VDφ
dLdVdt (1)Nau2=
∫∫∫ ∫∫∫ ∫∫∫
(ρ
2/2)φ
1φ
2VrdL1dL2dV1dV2dSdt (2) Nau1 --- the number of ships in collisions with objects and groundings; ρ --- the density of traffic;V --- traffic flow speed; D --- the cross section;
Φ --- the normalized distribution function of the ship length and the velocity; L --- length of traffic flow;
t --- time;
Nau2 --- the number of collision of ships;
Φ1, Φ2 --- normalized distribution function of the ship size and velocity; Vr --- the relative speed
S --- area.
The calculation of traffic volume in a defined area can be done through a visual survey and looking up vessel arrival/departure/in-port traffic records. Due to the limitation of human power and resources, it is impossible for researchers to carry out a visual survey 365 days a year. Generally visual survey, which particularly is appropriate to estimate the transit and entry/leave port traffic volume, is implemented by recording the number, types and sizes of vessels passing through the observation lines in three or four continuous days per three months or half a year. The result, as a sample, can be used to estimate approximately the whole year traffic volume passing those lines. Yang & Wu (1992) gave the formula as follows for calculating traffic volume per year. The traffic volume per year (1999-2003) in Wuhan port and its distribution can be seen in Appendix B.
∑
∑
= =+
= n
i ji n
j m j
m K K
K
1 365 1
1 ( ) (3)
K: the mean traffic volume per year;
m: the number of years carrying out visual survey; Kj: internal traffic volume in No.j year;
n: the number of days carrying out visual survey per year; Kji: visual survey traffic volume in No.i day in No.j year.
• Main mix of traffic
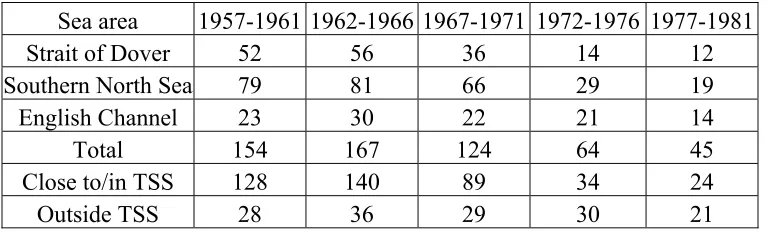
It is easily understood that most collisions between ships happen in crossing situations rather than in the case of overtaking and head-on. The mix of traffic is a very important factor determining the complexity of local traffic. Baldauf (2003) gave statistics concerning the comparison of accident numbers in the previous traffic mode and the new one adopting the Traffic Separation Scheme (TSS) in the UK coastal area from 1957 to 1981, as follows.
Table 1: Accident number in UK coastal area from 1957 to 1981
Sea area 1957-1961 1962-1966 1967-1971 1972-1976 1977-1981
Strait of Dover 52 56 36 14 12
Southern North Sea 79 81 66 29 19
English Channel 23 30 22 21 14
Total 154 167 124 64 45
Close to/in TSS 128 140 89 34 24
Outside TSS 28 36 29 30 21
Source: Baldauf, Michael (2003). Statistics about the Comparison of Accidents Number in Previous Traffic Mode and New One Adopting TSS in UK Coastal Area From 1957 to 1981. The Personal Communication. Wismar University: Author.
0 20 40 60 80 100 120 140 160 180 1957-1961 1962-1966 1967-1971 1972-1976 1977-1981 Total Close to/in TSS Outside TSS
Figure 8: Accident number in UK coastal area from 1957 to 1981
Source: Baldauf, Michael (2003). Statistics about the Comparison of Accidents Number in Previous Traffic Mode and New One Adopting TSS in UK Coastal Area From 1957 to 1981. The Personal Communication. Wismar University: Author.
area, the more complicated the traffic mode is and the more probabilities of marine incidents there will be. The quantity of encountering points can be regarded as one of the parameters for evaluating and prioritizing the areas in terms of risks. The main mix of traffic in Wuhan Port is briefly introduced in Appendix B.
• Hydrology / meteo
In respect of hydrology / meteo, the factors giving influence to accident probability mainly include visibility, current and wind.
Poor visibility is caused by fog in most circumstances. It tremendously reduces the amount of information that seafarers on board vessels can obtain from outside due to the limitation of their visual sense so that officers manoeuvring vessels have great difficulty in making appropriate decisions. In harbour and river areas, the local Maritime Authority generally promulgates strict navigation rules upon a vessel’s behaviour in poor visual range while COLREG states in Rule 19 (conduct of vessels in restricted visibility) that every vessel should proceed at a safe speed adapted to the prevailing circumstances and restricted visibility. Fujii and Yamanouchi (1974) divided 562 collisions and 354 groundings in six Japanese straits from 1966 to 1971 into groups with respect to the visual range and the analysis with these data and the frequency of visual ranges indicates that the ratio of the number of accidents is inversely proportional to the visual range for both collision and grounding. Furthermore, when visibility is below a certain extent, vessel traffic in harbour could have to stop totally. So poor visibility has a considerable impact upon traffic efficiency and traffic safety.
the number of relative accidents and wind speed, Qi (1991) gave the following formula:
kw = 7.9vw – 11.6 , kw 0 ≥
kw --- number of relative accidents;
vw--- wind force on the Beaufort scale.
This formula indicates that there is a linear feature between kwand vw and different
wind forces have different impacts on vessel traffic safety.
The effects of current on vessel traffic mainly focus on two aspects: one is the influence on movement and manoeuvre functions of a vessel while another is on traffic volume. When a vessel goes upstream within the current, its rudder effect will generally improve. Conversely when it sails down, it is more difficult for the crew to manipulate the ship due to the poorer rudder effect. In addition, cross currents may give rise to a ship’s deviation from correct lines and lead to traffic accidents. In some harbours affected by tide, small boats often catch tides for easily entering into or departing from the harbours so that traffic volume sharply increases at that time. Kandori (1972) analyzed the influence of current and wind and indicated that collision risk increases three times for tidal current over six knots in Hayatomoseto but a survey in Oseto did not underwrite this tendency. His study showed a considerable increase in the risks of both collision and grounding in the Kanmon Strait for winds over 20 knots. From these studies, we can also draw a conclusion that visibility, current and wind are the hazards that need to be identified in planning VTS. A short introduction of visibility, current and wind in Wuhan Port can be seen in Appendix B.
• Dangerous cargoes and marine pollution
etc., when vessels carrying them are involved in marine accidents. The briefing of dangerous cargoes in Wuhan Port is illustrated in Appendix B.
Seas, rivers and marine shoreline areas are important public and ecological resources. Water environments affect human health as they are often used for drinking water. The water and shoreline also provide public recreation area throughout the world and serve as homes to a variety of wildlife species including mammals, aquatic birds, fish, microorganisms, and vegetation. However, their cleanliness and beauty, and the survival of the species that inhabit them, can be threatened by accidents that occur when oil and dangerous products are produced, stored and transported (EPA, 1999). In addition, once pollution happens, the associated costs for clean-up operations including shoreline clean-up and recovery of sunken oil may be significant even when only small quantities of spilled oil are involved.
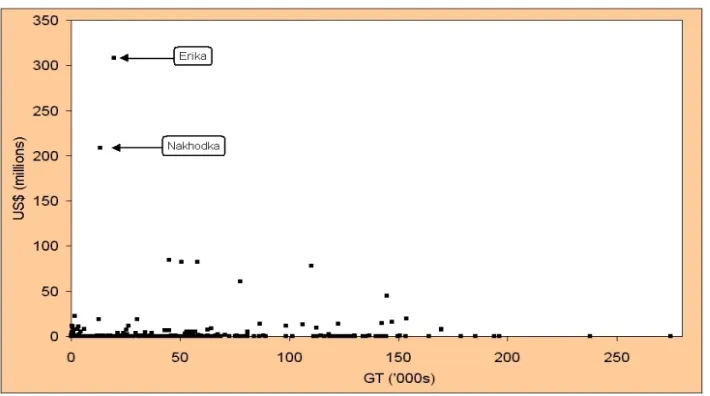
Figure 9 illustrates that there is no linear relationship between spill cost and size of tanker (which might in turn be considered indicative of spill volume). Indeed, some of the most expensive spills have been caused by relatively small tankers. In these cases the most important factor has been the type and place of oil spilled. For example, both the NAKHODKA and ERIKA spilled heavy fuel oil, which is highly
persistent and came ashore along long lengths of coastline (ITOPF, 2004). So
Figure 9: The costs of oil spills
Source: International Tanker Owners Pollution Federation Limited. (2004). The Costs of Oil Spills. From the World Wide Web: http://www.itopf.com/costs.html
• Local geographical conditions
navigational difficulty likely to be encountered by a vessel.” The geographical conditions in Wuhan Port are briefly introduced in Appendix B.
2.2.2 Geographical Division
The whole water area studied can be geographically divided into several sub-areas and ranked if necessary, especially when the size of the area is immense, according to the scenario of those factors determining the level of risks in the studied area in the process of planning VTS.
Wuhan Port is spanned about 150 km along its main channel and 55 km along its branch channel. By considering the above principle, the Port can be delimited into four sub-areas. Their geographical descriptions are shown as follows:
Sub-area1: from the downriver boundary of Wuhan Port to Qingshanxia anchorage; Sub-area2: from Qingshanxia anchorage to Wuhan third bridge of Yangtze River; Sub-area3: from Wuhan third bridge of Yangtze River to upriver boundary of Port; Sub-area4: the Hanjiang section of the Port.
2.2.3 Preliminary rank of sub-areas
comprehensively evaluated and weighed in order to appropriately rank the different sub-areas.
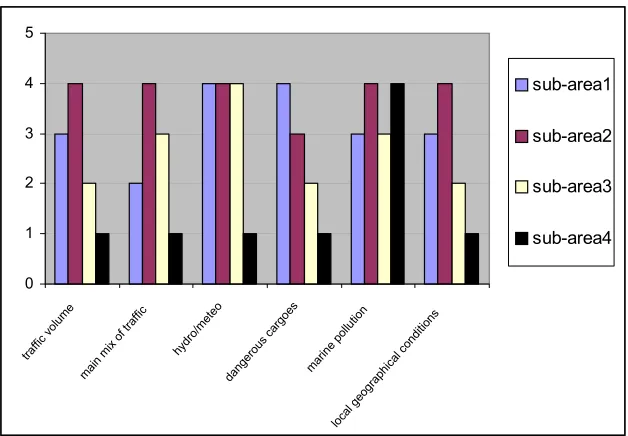
Wuhan Port is divided into four sub-areas. One sub-area is characterized as 4 with regard to a factor if this sub-area has the highest risk in respect of this factor among all the sub-areas. However, it will be valued as 1 if it has the lowest risk. According to the scenario of these factors, four sub-areas in Wuhan Port are assessed as shown in Table 2 and Figure 10.
Table 2: Rank of sub-areas in Wuhan Port
factors to be considered sub-area1 sub-area2 sub-area3 sub-area4
traffic volume 3 4 2 1
main mix of traffic 2 4 3 1
hydro/meteo 4 4 4 1
dangerous cargoes 4 3 2 1
marine pollution 3 4 3 4
local geographical conditions 3 4 2 1
0 1 2 3 4 5 traffi c vo
lum e
mai n m
ix of traf fic hydr o/m eteo dang erou
s ca rgoe
s
mar ine po
llutio n
loca l geo
grap hica
l con ditio ns sub-area1 sub-area2 sub-area3 sub-area4
Table 2 and Figure 10 indicate that sub-area2 has the highest risk in all factors except dangerous cargoes while sub-area4 has the lowest risk in each factor except marine pollution. Consequently, the preliminary ranking of sub-areas in terms of risk can be approximately identified from high to low as follows:
{ sub-area2; sub-area1; sub-area3; sub-area4 }
2.2.4 Preliminary evaluation of local accidents
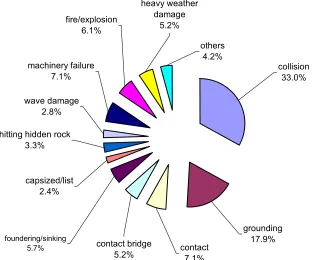
The evaluation of risks depends on the accuracy and volume of collected data on casualties. Therefore, the collection of data would be a vital element in the successful objective application of the FSA, although it is possible to use subjective evaluation as an interim means with a reasonable degree of accuracy (Sekimizu, 1997). In the preliminary evaluation of local accidents, historical maritime accidents data can be collected from the Maritime Administration and analysed through identifying types of accidents, types of loss and the geographical distribution of accidents so that a justified rank of risks can be formed.
collision 33.0%
grounding 17.9% others
4.2%
contact 7.1% contact bridge
5.2%
foundering/sinking 5.7%
heavy weather damage
5.2% fire/explosion
6.1%
machinery failure 7.1%
wave damage 2.8%
hitting hidden rock 3.3%
capsized/list 2.4%
Figure 11: Average Distribution of Incident Types in Wuhan Port (2000-2004)
Source: Wuhan MSA. (2000-2004).
5 5
9.34
13.2
2 3 1.742
10.8
9 8
13.08
5
15.48 15.6
3 4 4.267
8.4 21.7
3
0 20
Loss
2000 5 5 9.34 13.2
2001 2 3 1.742 10.8
2002 9 8 13.08 21.7
2003 3 5 15.48 15.6
2004 3 4 4.267 8.4
loss of life
(persons) total loss (vessels)
direct economic losses (RMBX
100000)
environmental losses (oil spill
klx10)
Figure Distribution of Loss Types (2000 - 2004)
Figure 12: Distribution of Loss Types in Wuhan Port (2000-2004)
Source: Wuhan MSA. (2000-2004).
The geographical distribution of all reported marine traffic incidents in Wuhan Port, developed from data for 2000 to 2004, is shown in Figure 13. the majority of incidents were concentrated in sub-area2 and sub-area3.
From the above analysis of historical data, the outcome for ranking of risks can be roughly expressed from high to low as follows:
31
46
43
27
0 10 20 30 40 50
sub-area1 sub-area2 sub-area3 sub-area4
areas
number of accidents
Figure 13: Geographical Distribution of Traffic Incidents in Wuhan Port (2000-2004)
Source: Wuhan MSA. (2000-2004).
2.2.5 Comparison and combination
The output from Step 1 of FSA comprises a prioritized list of risks/hazards/unwanted events by risk level and a preliminary description of the risks/hazards/unwanted events, which can be generated by comparison and combination of the identified scenarios of local traffic hazards, geographical subdivision, rank of sub-areas and rank of risks that all have been completed in previous phases. In order to reach the goal, methods of qualitative or quantitative analysis can be available, mainly depending on the scope of the collected data and the perspective of analysing the problems.
collisions / grounding / contact / contact bridge incidents and poor visibility, high wind, adverse weather and strong currents; however, none has been identified as having high enough significance. So, it can be said that these incidents making up the majority of all incidents, were mainly caused by the factors of traffic volume, local geographical conditions and traffic mix instead of hydro/meteo factors.
2.2.6 Conclusion
The outcome of the above analysis can promote the formation of prioritized lists with respect to risks, hazards and sub-areas. The lists for Wuhan Port are displayed by risk levels from high to low, as follows:
Sub-areas: { sub-area2, sub-area3, sub-area1, sub-area4 };
CHAPTER 3
Risk analysis
In the previous chapter it has been shown how a framework addresses the identification of risks and hazards in a planned VTS area in the context of planning VTS. When those identified risks occur there will always be an effect upon the risk level of the planned area. Therefore, their frequency and consequence have to be not only measured in some way but also assessed in a combined way by the stakeholders in order to determine whether or not they will be accepted.
The preceding step in FSA is to answer the question of what categories of hazards exist in the defined system while the second step is to reveal how and to what extent they lead to the failure or unacceptance of the system. In its guideline for FSA, IMO (2002) points out that:
The purpose of the risk analysis in step 2 is a detailed investigation of the
causes and consequences of the more important scenarios identified in step 1.
This can be achieved by the use of suitable techniques that model the risk.
This allows attention to be focused upon high risk areas and to identify and
evaluate the factors which influence the level of risk.
navigation safety of all VTS vessels and their traffic efficiency as a whole as well as all marine traffic accidents in a vast VTS area. It determines that the applicable risk analysis model for planning VTS is macroscopic rather than microcosmic although macroscopic may be made up of several microcosmic units.
Ayyub (2005) states: “When assessing and evaluating the uncertainties associated with an event, risk is defined as the potential for loss as a result of a system failure, and can be influenced by a pair of factors, one being the probability of occurrence of an event, also called a failure scenario, and the other being the potential outcome or consequence associated with the event’s occurrence”. This pairing can be represented by the equation:
× = Event e Consequenc impact Time Event Likelihood Time e Consequenc
Risk (Ayyub, 2005)
So risk analysis is assumed to include two major sub-activities, risk estimation and risk evaluation, where risk estimation comprises event-probability assessment and consequence assessment, and risk evaluation requires the definition of acceptable risk and a comparative evaluation of options.
3.1 Risk estimation
Information produced from the hazard identification phase will be processed to estimate risk. In the risk estimation phase, the likelihood and possible consequences of each System Failure Event (SFE) will be estimated, either on a qualitative basis or a quantitative basis (if the events are readily quantified) (Pillay & Wang, 2004).
mathematical or econometric models may be used. Estimates may also be based on expert experience and judgement. Most often, frequency estimates are based on a combination of these methods (IALA, 2000).
In planning VTS, consequence analysis mainly involves estimating the impact in respect of navigation safety, traffic efficiency and the marine environment, which is determined by the purpose of establishing a VTS. The impact on navigation safety can be measured by three factors: numbers of injuries or deaths, property loss and other direct economic loss caused by traffic accidents while the impact on traffic efficiency can be estimated in two different ways: the annual day numbers of bad visibility which could stop local waterborne transport and the traffic density which could lead to traffic congestion in a certain area once it is too high. Impact on the marine environment has to some extent to do with the type and place of oil spilled as well as the local ecological environment and its sensitivity, which can be measured by numbers of wildlife affected, how heavy the influence on the quality of human life is and the associated costs for clean-up operations.
3.1.1 Recommended models for risk estimation
In IMO’s guidelines for FAS, several techniques are recommended for use in the process of risk analysis, which include fault tree analysis (FTA), event tree analysis (ETA), failure mode and effect analysis (FMEA), hazard and operability studies (HAZOP), the what-if analysis technique, risk contribution tree (RCT) and influence diagrams. However, each method has its own appropriately applied fields and limitations, especially when they are intended to be used in a large marine project such as planning for VTS.
Fault tree analysis is a technique that, by means of tree structures, visually models the logical causal relationship between events that singly or in combination cause accidents, and determines the probability of a top event, which may be a type of accident or unintended hazardous outcome (IMO, 2002). One of applications of FTA on planning VTS for Wuhan Port can be exemplified as shown in Figure 14:
Contact bridge probability in Wuhan Port ( Pc ) = 0.9x (9.1 E –4) + 0.1x (1.87 E –3) ≈ 1.01 E -3
Lack of valid watchkeeping 1.0 E- 4
A4 Human error 2.6 E -4
or
A1 A2 A3
stress asleep 1.2 E- 4 2.0 E -5
6.5 E -4 2.6 E -4
9.1 E -4
1.87 E- 3
2.6 E -4 6.5 E -4 9.6 E -4
rudder failure Human error
Human error rudder failure
R D
A D
A
or or
0.1
Bad visibility B2 Human error or rudder or radar failure Human error or
rudder failure 0.9 Good visibility B1 and and
In bad visibility In good visibility
or Contact bridge Probability: Pc=
fatigue 2.0 E -5
radar failure
Figure 14: Contact bridge FTA in Wuhan Port
Source: Based on Friis-Hansen’ model (2005)
specific accident of interest. More fault trees should be developed in order to analyse other types of accidents. The quantification of analysis requires significant expertise and reliable statistical data (USCG, 2005).
• Event tree analysis (ETA)
Event tree analysis is a technique, which by means of a tree structure, visually models the possible outcomes of an initiating event. The model illustrates how safeguards and external influences, called lines of assurance, affect the path of accident chains (USCG, 2005). One example of ETA, which may be used in the process of risk analysis for planning VTS, is indicated in Figure 15 and Table 3:
G2│ABCDEf g2│ABCDEf
S F2
≈ 0
G2│ABCDe g2│ABCDe
S F3
≈ 0
G2│ABCd g2│ABCd
S F4
≈ 0
G2│ABc
g2│ABc
G2│Ab
g2│Ab
G2│a
g2│a F7 1x10⁻⁷
S S F6
9x10-11 S
F5
≈ 0
g1│ABCDEF
f│ABCDE e│ABCD d│ABC
G1│ABCDEF F│ABCDE
E│ABCD D│ABC c│AB
C│AB b│A B│A
a A
F1 5x10⁻¹⁰ S
Collision with an inspected vessel = µ x (PF1+PF2+PF3+PF4+PF5+PF6+PF7)
≈ (3650/yr) x (1.006x10⁻⁷) ≈ 3.67x10⁻⁴/yr
Where: µ is the number of times per year that a passenger ferry is on a collision course with an inspected vessel (assuming that it is 0.5 time when it passes through the Yangtze River and it passes 20 times a day, so µ = 0.5 x 20 x 365 = 3650/yr); s is safety while F is failure.
Figure 15: ETA for passenger ferry on collision course with inspected vessel in Wuhan Port