IQLECÜLM AIALYSIS QF THE
GASTRIJLATIIG «D?SE EKBEYQ
ASP.
ITS GEKX CELL LIHEAGE
A thesis sub mitted to the
Univ ersity of London
for the degree of
Doctor of Philosophy
By
SIMON JAMES CONWAY (B.Sc)
ProQuest Number: 10105694
All rights reserved
INFORMATION TO ALL USERS
The quality of this reproduction is dependent upon the quality of the copy submitted.
In the unlikely event that the author did not send a complete manuscript
and there are missing pages, these will be noted. Also, if material had to be removed,
a note will indicate the deletion.
uest.
ProQuest 10105694
Published by ProQuest LLC(2016). Copyright of the Dissertation is held by the Author.
All rights reserved.
This work is protected against unauthorized copying under Title 17, United States Code.
Microform Edition © ProQuest LLC.
ProQuest LLC
789 East Eisenhower Parkway
P.O. Box 1346
Molecular Analynls of the Gastrulatlng Mouse Embryo and its
germ Cell Population
Abstract
Gastrulation occurs between 6.5 and 8.0 days post coltum in the mouse and is associated with a dramatic Increase In cell proliferation, being initiated when the embryo consists of some 500-600 cells and resulting in a neural plate stage embryo containing 50,000 cells or more. There is evidence to suggest that some of these areas may be determined with respect to their future development quite early in the process of gastrulation. During this period of development it is clear that the
growth rate of the whole embryo, and of its constituent parts, is under intrinsic control and capable of controlled variation aimed presumably
at generating an organogenesis stage embryo of a notional target size in which the parts are of appropriate relative size.
Investigations in the mouse have shown that growth of the embryo parts and their co-ordination can be profoundly disturbed in early embryonic stages by insult with the cytotoxic agent. Mitomycin C. MMC is an alkylating agent that inhibits DMA synthesis. It causes cell death and reduces pre-organogenesis stage embryos to 10% of normal size as measured by cell number. During the progression of embryogenesis the normal co-ordination of development of different parts of the embryo is abnormal. Considerable and localized growth control is obviously operating in these stages, thus the proto-oncogenes with known growth regulatory functions were looked at as likely candidates controlling the dramatic growth patterns observed.
spotting <V> locus of the mouse. The V mutations have plelotropic effects on mouse development, one of which is to cause^an impairment of proliferation and/or migration of primordial germ cells. It appears that the c-kit product is necessary for the maintenance of the primordial germ cells during their migratory/mitotically active phase. This finding holds true for overall expression of c-kit in structures of the developing embryo.
TABLE QF COBTEBTS
Abstract
List of Tables
List of Figures
Eaga.
Chapter One General Introduction 10
Chapter Two Proto-oncogene expression In the gastrulatlng
mouse embryo following Mitomycin C treatment 19
Introduction
Materials & Methods Results Figures Discussion 20 37 43 47 64
Chapter Three Expressslon of the receptor tyrosine kinase
gene (c-klt) In mouse development 67
Part A : Gene expression, proliferation and migration of the primordial germ cell
population in the mouse embryo
Part B : c-kit gene expression In the mouse embryo and adult
Introduction
Materials & Methods Results
Chapter Four Gene expression in the male germ cells of the
adult mouse testis 153
Introduction
Materials & Methods Results
Figures Discussion
154 161 165 172 168
Chapter Five General Discussion 194
Acknowledgement 198
LIST QF TABLES
1.1 Proto-oncogenes encoding peptides related to growth factors, their receptors, or their intracellular messengers.
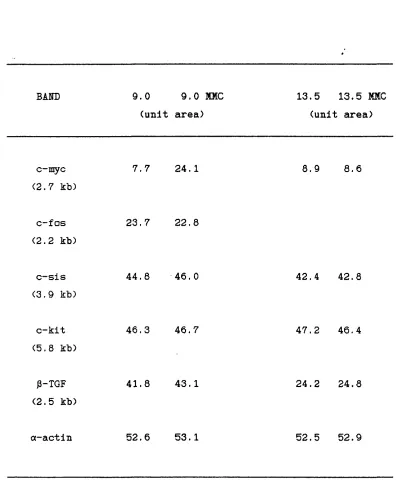
2.1 Densitometer readings from the Northern analysis of proto-oncogene and growth factor expression in control and Mitomycin C-treated 9.0 and 13.5 dpc embryos.
2.2 Quantitative in situ hybridization analysis of c-myc expression in 9.0 dpc control and Mitomycin C-treated embryos.
2.3 in situ hybridization analysis of c-myc RITA expression in 9.5 dpc
male and female normal embryos.
3.1 Pleiotropic effects of various W mutations.
3.2 Results of genotype analysis of Southern blotting of V mutants. 3.3 Number of primordial germ cells (PGCs) in embryos between 7.5 and
13.5 days
3.4 Proportion of PGCs containing alkaline phosphatase (ALP) spots. 3.5 Location of PGCs in mouse embryos at different developmental
stages,
3.6 Correlation of c-kit expression, ALP-activity and proliferation during embryonic development.
4.1 Some genes which have been shown to have post-meiotic transcription.
4.2 Genes with altered splicing/processing during post-meiotic transcription.
LIST QF FIGURES
2.1 ITormal development of the mouse embryo during gastrulation and the size relationships.
2.2 Schematic representation of control and mitomycin C-treated embryos.
2.3 northern analysis of oncogene and growth factor expression in response to mitomycin C treatment.
2.4 northern analysis of c-myc expression during gastrulation. 2.5 Positive control hybridization.
2.6 c-myc localization in 7.5 dpc embryos by in situ hybridization. 2.7 c-myc RITA in sagittal sections of a 8.5 dpc embryo.
2.8 c-myc RITA localization in 9.5 dpc embryos by in situ
hybridization.
2.9 c-myc RffA expression in the normal and mitomycin C-treated 9.0 dpc embryos.
2.10 c-myc RFA expression in the vertebral column of a normal 9.5 dpc embryo.
2.11 Dot blot identification of male and female embryos.
3.1 Analysis of V* embryos by Southern blotting.
3.2 The location of primordial germ cells <PGC> in mouse embryos at 8.0 dpc.
3.3 The location of PGCs in a 9.5 dpc embryo whole mount.
3.4 Alkaline phosphatase (ALP) staining of normal 13.5 dpc male and female gonads.
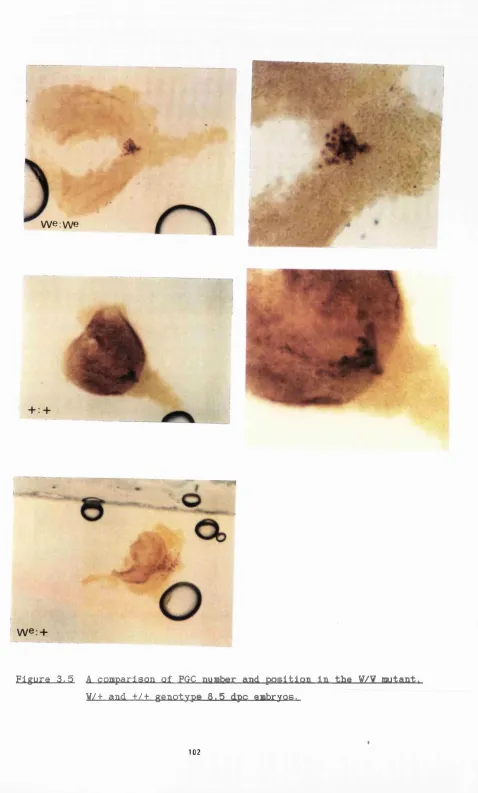
3.5 A comparison of PGC number and position in the V/W mutant, V/+ and +/+ genotype 8.5 dpc embryos.
3.6 Alkaline phosphatase staining of V^/V* 13.5 dpc male and female gonads.
3.7 ALP distribution in the 8.5 dpc embryo. 3.8 ALP distribution in the 9.5 dpc embryo. 3.9 ALP distribution in the 10.5 dpc embryo.
3.11 ALP distribution In the 13.5 dpc embryo. Transverse sections. 3.12 ALP distribution in the 13.5 dpc embryo limb buds.
3.13 Detection of proliferation by bromodeoxyuridine-incorparation in the 9.5 dpc embryo
3.14 Analysis of proliferation in the 13.5 dpc embryo. 3.15 Analysis of proliferation in the 13.5 dpc embryo.
3.16 Analysis of proliferation in the optic and otic vesicles of a 13.5 dpc mouse embryo.
3.17 Analysis of c-kit expression during embryonic development. 3.18 Colour photomicrograph of a normal and homozygous V* mutant. 3.19 Analysis of c-kit expression in V* 14.5 dpc whole embryos. 3.20 c-kit expression early after implantation.
3.21 c-kit expression in the allantois of a 7.5 dpc embryo.
3.22 Expression of c-kit in a transverse section of a 8.5 dpc embryo. 3.23 c-kit expression in a 9.5 dpc embryo.
3.24 A close up of figure 3.23.
3.25 c-kit expression in a sagittal section of the 9.5 dpc embryo. 3.26 Sagittal section through the rhombomeres of a 9.5 dpc embryo. 3.27 A sagittal section through the otic vesicle of a 9.5 dpc embryo. 3.28 c-kit expression in the 13.5 dpc embryo.
3.29 c-kit RffA expression in the male 13.5 dpc embryonic genital ridge. 3.30 c-kit expression in individual migrating melanoblasts at 13.5 dpc. 3.31 in situ hybridization analysis of c-kit expression in the 13.5 dpc
embryonic forehead.
3.32 c-kit expression in the 13.5 dpc head, eye, mouth and forelimb bud.
3.33 c-kit expression in the adult testis. 3.34 c-kit expression in fetal ovaries.
4.1 Diagrammatic illustration of the time-factor in sperm development, 4.2 The presumed origin of the Y-del chromosome.
4.7 The result of in situ hybridization of Y353/B to RFA in testes sections.
4.8 An illustration of Y353/B expression in 47.5 dpc prepubertal mice testes.
4.9 Localization of Y353/B transcripts in prepubertal testis by in situ hybridization.
4.10 Y353/B RITA expression in 37.5 dpc prepubertal testes sections. 4.11 Localization of Y353/B transcripts in 35.5 dpc prepubertal testis
CHAPTER GITE
The aim of this thesis is to investigate the function of specific genes in growth and development, by the use of mouse mutants and by interfering with normal gene expression in vivo.
Very few genes have been identified as being directly involved in the control of embryogenesis in mammals. This is partly because many
important processes, such as gastrulation, occur in utero where the effect of a mutation is not easily observed, but also because any
mutation that results in a breakdown of maternal/fetal interactions will be lethal. Our knowledge of genes involved in development is thus
limited to a few that are not critical to embryo survival, such as those whose mutations give limb or tail abnormalities (Copp et al., 1988); some of the neurological defects which act post-natally, and those involved in sexual dimorphism, eg Tdy (Richer and Vashburn, 1986). Investigation with such genes depends upon their isolation before their mechanism of action at the molecular level can be determined.
There are, however, a number of genes that are suspected of having a role in development, either by their implication in aspects of cell physiology such as growth control, eg proto-oncogenes, or because they share homologous sequences with developmental genes identified in other often distantly related species, eg the homoeobox containing genes. These may be well characterized at the molecular level, but it has not been possible to prove a function for them in mammalian embryogenesis because of the lack of identifiable mutations.
However, recently the first example of a germline mutation in a mammalian proto-oncogene was provided by the mouse dominant white-
the ligand far the Kit tyrosine kinase receptor (Huang et al., 1990; Copeland et al., 1990; Zsebo et al., 1990; Brannan et al., 1991).
Development can be considered in three stages: pre-primitive steak, embryonic and fetal stages. The iniation of primitive streak formation is the first overt sign of organisation of cells which will form the fetus. Growth is slow before the formation of the primitive streak. The embryonic stage Includes the primitive steak and ensuing organogenesis stages during which organ primordia are generated. The embryonic period and especially its early stages is characterized by exceptionally high rates of cell proliferation. During the fetal period, growth and
differentiation of already existing structures occurs; overall the cell proliferation rate is not as high as during the embryonic stages.
Snow and his co-workers (Snow and Tam, 1979; Snow, Tam and McLaren, 1981; Snow, 1983, 1987) discovered a growth regulating system during recovery from cytotoxic damage which produces independent changes in the rates of cell proliferation and morphogenesis in early organogenesis. The molecular basis for this altered timetable may give us some clues about the function of specific developmentally regulated genes, since it seems possible to link deployment of gene products with observed,
experimentally induced changes in the association between growth and differentiation.
Gastrulation in one form or another is an almost universal episode of development throughout the vertebrates. Mesoderm induction occurs before gastrulation and determines particular developmental or
differentiated states within the mesoderm. Gastrulation re-arranges the cells. This dramatic process transforms a simple undifferentiated
(multipotent) epiblast into a structure with the primary germ layers laid down. An anterior/posterior axis and the early organotypic
lineages are established. Subsequent normal development will depend on interactions within the multilayered structure thus formed, and
communication between parts may be closely restricted in time and space (Lehtonen and Saxen, 1986).
(Beddlngtan, 1983) and the ultrastructural level (Tamarin and Boyde, 1976). They can be characterized as local changes in cell shape, cell adhesion, cell proliferation and cell movement. Two Important steps in the organisation of the embryo precede gastrulation. Firstly, during oogenesis and cleavage the major axes are established. Secondly, during cleavage many cell lineages become specified (although the regulatory features of specification remain cryptic and in many cases conditional until later in development (Davidson, 1990)). The movements of
gastrulation depend upon these earlier specifications. Little is known, however, about the underlying cellular mechanisms which govern these changes, or about their molecular and genetic control.
Evidently some growth control in the embryo operates before
organogenesis is completed and is a function of the embryo itself. To enable the highly ordered sequence of development to proceed
successfully, cells must be able to communicate. Recent studies have shed light on some of the factors that are thought to be Important (Hill et al., 1987). These can roughly be divided into three categories: firstly, cell adhesion molecules which are cell-surface anchorage glycoproteins involved in cell-cell recognition and adhesion during pattern formation and organogenesis; secondly, cell-surface adhesion molecules, which are required for cell migration and cell shape; and thirdly, peptide growth factors which are diffusible molecules which stimulate cell proliferation and/or differentiation. These would include the products of the so-called proto-oncogenes.
Oncogenes have oncogenic or cancer-causing potential. They were initially discovered in retroviruses, although they are not native to these viruses. Oncogenes are found in both cancerous and non-cancerous cells and are probably genes that are required for normal growth and development. Cellular oncogenes, known more correctly as proto- oncogenes, have the split structural organization of normal cellular genes with exon and introns whereas viral oncogenes do not. The protein products of many of the oncogenes studied are protein kinases or protein phosphorylating enzymes, and this may in some way be linked to the
altered growth properties of neoplastic cells.
growth factors are the most likely candidates (Smith, 1981; de Laat et al., 1983; Stern and Heath, 1983). Within the third category mentioned above, proto-oncogenes may be included since they appear to impinge on the chain of command that directs the response to polypeptide growth factors. Eukaryotic cells contain proto-oncogenes which have the potential to transform cells In vitro and induce tumours in vivo
(Bishop, 1983). These oncogenes were initially identified through their association with retroviruses which acted as natural transducing vectors
(Stehelin et al., 1976). It is now believed that proto-oncogene products are components of signal transducing pathways and play a pivotal role in regulation of cell growth and differentiation (Bishop, 1985). Proto-oncogenes are likely to be crucially involved in growth regulation and/or differentiation because of their conservation
throughout evolution and because of demonstrable growth deregulation effects produced by the viral homologs to the cellular genes.
The fundamental role of growth factors in controlling the normal proliferation of cells is well established. Some oncogenes may 'short- circuit' the regulatory action of growth factors by encoding products that resemble either growth factors or their receptors (Kelly, 1985). Cell cultures that normally depend on external sources of growth factor to maintain proliferation may lose this requirement if they are infected by a retrovirus carrying an oncogene (Rapp et al., 1985; Cook et a l . , 1985; Pierce et al., 1985).
Proteins encoded by several proto-oncogenes have been identified as cell surface receptors for growth factors. Several of the proteins reside on the inner surface of the plasma membrane, enabling
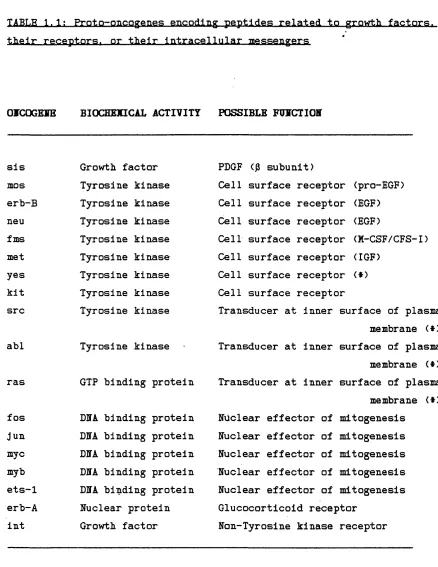
transduction of signals received from outside the cell, and others may be in the nuclear chain of command that enables a cell to divide in response to growth factors (see Table 1.1). At least one of the proto oncogenes, c-sis, encodes a portion of a growth factor receptor, the # chain of the PDGF peptide (platlet-derived growth factor). PDGF (c-sis) is expressed during the early development of the placental trophoblast and at present is the only example of an oncogene with defined growth factor properties expressed in embryogenesis.
TABLE 1.1; Proto-oncogenes encoding peptides related to growth factors, their receptors, or their Intracellular messengers
OTCOGEIE BIOCHEMICAL ACTIVITY POSSIBLE FHMCTIOH
sis Growth factor
mos Tyrosine kinase
erb-B Tyrosine kinase
neu Tyrosine kinase
fms Tyrosine kinase
met Tyrosine kinase
yes Tyrosine kinase
kit Tyrosine kinase
src Tyrosine kinase
abl Tyrosine kinase
ras fos Jun myc myb ets-1 erb-A lut
GIF binding protein
DMA binding protein DMA binding protein DMA binding protein DMA binding protein DMA binding protein Nuclear protein Growth factor
PDGF (j3 subunit)
Cell surface receptor (pro-EGF) Cell surface receptor (EOF) Cell surface receptor (EOF)
Cell surface receptor (M-CSF/CFS-I) Cell surface receptor (IGF)
Cell surface receptor ($) Cell surface receptor
Transducer at inner surface of plasma membrane (*) Transducer at inner surface of plasma membrane (*) Transducer at inner surface of plasma membrane ($) Nuclear effector of mitogenesis
Nuclear effector of mitogenesis Nuclear effector of mitogenesis Nuclear effector of mitogenesis Nuclear effector of mitogenesis Glucocorticoid receptor
Non-Tyrosine kinase receptor
embryogenesis. Most of the evidence for their involvement in growth and/or differentation comes from studies of their actions in late fetal and post-natal stages (see Hill et al., 1987 for review). There is also circumstantial evidence implicating proto-oncogene involvement in growth factor receptor expression and in intracellular regulation of growth in the gastrulation stage embryo, for instance, from studies with
teratocarcinoma stem cells and from oncogenes with known growth
regulating activity (see Adamson, 1987 for review). The expression of certain growth factors may thus provide the link between the genes
(oncogenes ?) involved in developmental growth control and the changing morphology of the embryo.
The connections which have been established between many growth
factors and their receptors and cellular oncogenes (proto-oncogenes) has led to the belief that proto-oncogene products play an important role in normal cell growth and differentiation. This is based largely upon their evolutionary conservation and the fact that viral homologs of the
cellular genes are able to perturb normal growth patterns. A survey of proto-oncogene expression in whole mouse embryos from day 7 of gestation until term, revealed the presence of detectable mRITA from five cellular oncogenes: c-myc, c-erb, c-Ha-ras, c-src and c-sis (Slamon and Cline, 1984). The c-mos gene was also found in the early mouse embryo (Propst and Vande Voude, 1985). The fact that sequential expression of
different oncogenes occurs during development and that different organs show different patterns of expression, lends credence to the view that the products of specific oncogenes are causally related to the growth and differentiation of different cell types.
Elevated expression of proto-oncogenes Is found in proliferating cells both in vivo (Xakino et al., 1984; Slamon et al., 1984) and in vitro
(ttüller et al., 1984). Several reports have shown that the expression of some of these genes and, in turn, cell proliferation, may be
regulated in vitro by hormones and growth factors (review Adamson, 1987). For instance, platelet-derived growth factor stimulates
proliferation of quiescent fibroblasts in vitro by first binding to a specific cell-surface receptor. This binding initiates a cascade of events that leads to activation of c-fos gene transcription within 5 minutes, followed later by transcription from the c-myc gene, and then by cell division (Miiller et al., 1984). In this thesis I have attempted to determine whether a comparable sequence of events occurs during the activation of cell proliferation in vivo during gastrulation and
development. The use and deployment of products of the proto-oncogenes is investigated by conventional molecular techniques.
Considerable and localized growth control is obviously operating in the gastrulation stages, thus the proto-oncogenes with known growth regulatory functions were examined as likely candidates controlling the dramatic growth patterns observed. The proto-oncogenes studied are c-myc, c-fos and c-sis. There is evidence to suggest that these genes may be co-expressed in a cascade fashion, perhaps under the initial control of the transforming growth factor g (Adamson, 1967). c-fos and c-myc products are DNA binding proteins associated with cell
differentiation and cell proliferation respectively. The c-sis product is a secreted protein and a candidate for overall co-ordination of growth.
A central aim of this thesis is to investigate the function(s) of growth-related proto-oncogenes during mammalian development. One crucial approach in tackling this question will be to follow the patterns of transcription of individual proto-oncogenes during
particular oncogene, and detects minor cell sub-populations not detectable by RNA blotting. It Is also useful when dealing with a
CHAPTER TVO
imODUCTIQI
Gastrulation occurs between 6.5 and 8.0 days post coîtum (dpc) in the random bred Q strain mouse used in this study (Snow, 1977). This process is associated with a dramatic and essential increase in cell proliferation, being initiated when the embryo consists of some 500-600 cells and resulting in a neural plate stage embryo containing 50,000 cells or more (Snow, 1986) - (see figure 2.1.)
The growth of the mouse embryos during the gastrulation period is achieved by a high rate of cell proliferation, resulting in a rapid increase in cell number (Kohler et al., 1972; Snow, 1976, 1977; Snow and Bennet, 1978) and reflected by a sharp rise in frequency of mitoses in the epiblast (Snow, 1976; Poelmann, 1980; Lewis and Rossant, 1982). These studies suggest that the average cell doubling time is in the region of 5-6 hours in order to account for the observed cell number increases or increases in DITA content, but may possibly be as little as 2.5 hours in places, due to the fact that the distrubution of mitoses in the epiblast is not uniform (Snow, 1977). This suggests that the average rate of cell proliferation is doubled during gastrulation, as the population doubling time of the originators of the epiblast is about 10 hours (Snow, 1986). Furthermore, the rate of division of the cells during gastrulation is much faster than that of blastomeres during cleavage (Graham, 1973). However, Poelmann (1980) could find no evidence for these short duration cell cycle times, which is in keeping with previous autoradiographic estimates (Solter and Skreb, 1968; Solter et al., 1971). But there is some doubt on the reliability of the autoradiographic techniques used by Solter et al. and Poelmann (Snow, 1976). There is also doubt about Poelmann's description of cell and tissue movement, since he did not take account of one part of the epiblast nor of any mesodermal tissue which has been shown to be of epiblastic origin (see reveiw by Beddington, 1983).
increase of cell volume or in the volume of extracellular spaces. However, gastrulation is preceded by a decline in proliferation rate in the Amphibia (Graham and Morgan, 1966) and 'chick embryos. Nevertheless, in the mouse, the best studied mammal, the comparative studies of embryos In vivo and In vitro strongly suggest that the onset of gastrulation is associated with, and s e ems’dependent upon, a sudden acceleration in cell proliferation. Thus, it appears that the coincidence of rapid proliferation with the onset of gastrulation is unique to the mammals.
The high cell proliferation rate of gastrulation appears to be particular to the gastrulation stages as it is not maintained in subsequent development in the mouse embryo and is not apparent in pre- gastrulatlon stages. The findings of McLaren and Bowman (1973) and Bowman and McLaren (1970) indicate that the control of growth rate operates principally during.postimplantation development and not in the preimplantation period. Also after gastrulation, with the onset of organogenesis, cell groups with lower, different and characteristic growth rates are allocated to particular paths of development culminating in organ formation. During this process, an increasing number of cells become non-dividers and the overall growth rate of the embryo gradually declines during the course of gestation (Snow, 1986).
During this period of development it is also clear that the growth rate of the whole embryo, and of its constituent parts, is under intrinsic control and capable of controlled variation aimed presumably at generating an organogenesis stage embryo of a notional target size in which the parts are of appropriate relative size. Thus parts of the embryo show their own individual growth profiles (Goss, 1986; Brasel and Gruen, 1986).
question of the relationship between growth and the successive steps of the developmental hierarchy. These are some of the questions that my
thesis will address.
Disruption of Forml. .D.eyalopment
Investigations In the mouse have shown that growth of the embryo parts and their co-ordination can be profoundly disturbed in early embryonic (primltive-streak) stages by Insult with cytotoxic agents, such as mitomycin C (Snow and Tam, 1979; Snow, Tam and McLaren, 1981; Snow, 1983, 1987). These studies demonstrated that the cell proliferation rate can be altered, with some cell lineage specificity and with interesting consequences for patterning in the embryo. Using this system, the embryonic development of these mice may reveal Information about growth control and its relationship to morphogenesis (Tam, 1981; Tam and Snow, 1981; Gregg, 1985; Snow and Gregg, 1986).
Mitomycin C (MMC) is an antibiotic, derived from Streptamyces
caespltasuSf that inhibits DMA synthesis. It is an alkylating agent
which is thought to act by binding to the major groove In the large subunit of DMA polymerase and inhibiting DMA synthesis by cross-linking and preventing progress to mitosis. All cells in the S (synthesis) phase of the cell cycle are Inhibited; cells in Gl, M (mitosis) and some of the cells In the G2 phase, which will come into the S phase within the time that the MMC is still present, will also be inhibited. MMC is thought to remain within the system for approximately Ihour and the cell cycle time Is thought to be between 2.5 to 5 hours during gastrulation. It has been reported, (lASC monographs, 1976), that after intravenous injection of a higher dose of MMC than that administered by Snow and Tam, only traces remained in the blood after 30 mlns. Thus MMC reaches its target tissue very soon after Injection. The inhibition of DMA synthesis leads to the extensive cell death observed. The loss of these cells produces a mitotic delay while cells In Gl progress through the cycle to division.
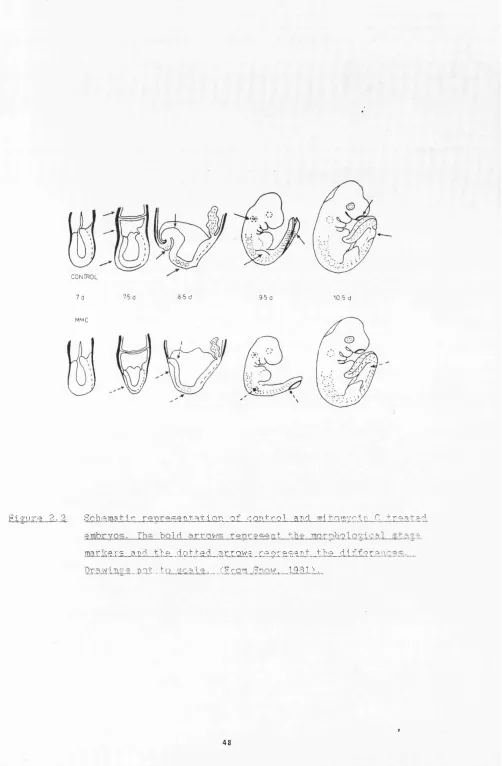
result in a reduction of pre-organogenesis stage embryos (7.5 dpc) to only 10-15% (on average) of normal size as measured by cell number. These embryos all appear to complete gastrulation stages as normal, except that a very small neural plate stage embryo (8.0 dpc) is produced. In general, these embryos do not die but accelerate their growth such that when organogenesis is complete by about 13 dpc, their size,weight and anatomical structure are normal (Snow and Tam, 1979; Tam, 1981). There is a fetal mortality rate of 10% and some of the male mice are infertile, but the existence of long term survivors which appear very normal shows that development can tolerate and then correct these disturbances in growth. During this restoration growth, the mitotic index is raised above normal in all organs. It appears that it is raised more in ectodermal tissue than in mesodermal tissues and that each organ system has its own unique growth rate (Snow et al., 1981). However, mesoderm maintains an elevated level for longer, resulting initially in an imbalance of the ectodermal/mesodermal tissue ratio. The effect of this imbalance can be seen in the neural tube - a wavy form is produced along the axis of the embryo. This abnormality is corrected as the growth rate in the neural tube slows, and the mesoderm continues at its raised level. The neural tube can then proceed through development normally, whereas various structures of mesodermal lineage (somites, limbs, vascular system, haemopoietic system) show developmental delays of differing magnitudes (Snow, 1987). During the progression of embryogenesis we find that the usual co-ordination of development of different parts of the embryo has become abnormal (see Figure 2.2). In this way it is possible to alter the usual co ordination between organs in a predictable way, and this may enable us to gain an insight into how early embryogenesis is controlled.
that individual cell lineages and organ systems have the ability to regulate their growth either in response to tissue-specific growth factors or by autonomous active deployment of receptors 'for non-specific growth factors (Snow, 1989).
There are other examples of embryonic growth control - from natural conditions in which the growth rate of an intact embryo is changed, and from experiments designed to deliberately alter embryo size and monitor the response - that support the notion of accelerated growth. For example, monozygotic twins which originate from a single egg, must undergo some accelerated growth since they are of normal size in the middle trimester, but the embryos were presumably of less than average size. Embryos that have had their size manipulated at the pre implantation stage generate offspring of average birthweight (for example, removal of one or more of the blastomeres to produce a small embryo).
Jlo I ecu 1 ar.. Signa 1 s
A number of proto-oncogenes, growth factors and their receptors have been thought to play a role in developmental decisions.
The myc gene family
The members of the myc-oncogene family encode proteins which move rapidly to the nucleus after synthesis and are short-lived. They are believed to be important for the regulation of cell growth. Three well defined members of the family are known to date: c-myc (Sheiness et al., 1980), N-myc (Schwab et al., 1983) and L-myc (Nau et al., 1985) - and two lesser known functional members, one of which is designated B-myc. They are found in many species and the mEIfA sequences have been deduced from cDUAs of both human and mouse. The known myc oncogenes are all expressed at high levels in the embryo (Jakobovitz et al., 1985; Zi miner man et al., 1986; Sejersen et al., 1986). There is evidence, however, that N'-myc and c-myc expression are separately regulated
<1989). c-myc expression was Investigated as It is abundantly expressed during the pre-gastrulatlon and gastrulation stages in the mouse embryo, and probably at all stages and in all tissues, whereas F-myc is only expressed from 7.5 dpc and L-myc Is expressed even later. The impression from these papers is that c-myc is ubiquitously expressed, while F-myc and L-myc are restricted in their expression.
The myc gene is highly conserved throughout evolution, suggesting that this gene product is required for normal metabolic processes. Expression is seen in humans, mice and chickens. Even Xenopus laevis and
Drosophila mslanogaster genomes contain sequences that hybridize with
myc probes. Xenopus c-myc RFA is highly accumulated in oogenesis through an unusual stability of the transcript (Taylor et al., 1986). Drosophila c-myc mRNA is also found in embryos, pupae and in adults, and stage-specific expression was seen (Madhavan et al., 1985).
The c-myc oncogene is multifaceted and shows all the features expected of a nuclear oncogene: namely, it is inducible with mitogens; it has a rapid mRFA turnover (30 mins) ; it is post-transcriptionally regulated; its protein has a short half-life (30-90 mins); there is post- transcriptional modification of the protein and involvement in cell proliferation and/or differentiation.
The mouse c-myc protein product <58-62 x 10^ Mr) localizes in the nucleus and binds to chromatin (Hann and Elsenman, 1984; Ramsey et al. ,
1984). Although its precise role in the control of cell proliferation is still unclear, when c-myc protein is injected into quiescent Swiss NIH 3T3 fibroblast cells, DMA synthesis is induced (Kaczmarek et al.,
1985). Conversely, inhibition of c-myc expression by c-myc complementary oligo- deoxynucleotlde prevents 8-phase entry in mitogen stimulated T- lymphocytes (Heikkila et al., 1987). DMA synthesis and DNA polymerase activity of isolated human nuclei from several types of human cells can be reversibly inhibited by the addition of affinity-purified anti-c-myc antibodies (Studzinski et al., 1986). Enhanced c-myc transcript abundance has been seen in a variety of human malignancies, in normal liver tissue induced to proliferate in vivo by partial hepatectomy and in cells in culture induced to proliferate with the addition of growth factors. In a recent report, the abundance of c-myc transcripts in vivo
correlates well with the degree of cell proliferation induced within a chick oviduct by the steroid hormone, estrogen (Remple and Johnston,
1988). These results suggest that the c-myc protein acts as a competence factor for cell proliferation. Therefore, it is probable that an enhanced c-myc transcript abundance would accompany the onset of proliferation associated with gastrulation and that decreased abundance would be observed in differentiated tissues.
remodelling of embryonic tissues - such as that securing in the mouth at 7 to 8 weeks post-conception in the human embryo. These findings suggest that c-myc expression is not simply a marker of cell proliferation, since rapidly dividing human embryonic mesenchyme and cartilage cells of the limb buds showed no in situ hybridization. Furthermore, predominantly normal development occurs in transgenic mice that express varying levels of c-myc (Leder et al., 1986). However, in the developing Xenopus embryo c-myc is expressed in specific tissues including ectodermal cells and rapidly proliferating gill buds - and studies on limb regeneration show that c-myc is down-regulated during cell differentiation <M. Méchali, personal communication). Since c-myc m E M levels rise transiently during cell proliferation in vitro
(Blanchard et al., 1985) the findings of high transcript levels in precise cellular structures may indicate a degree of cell synchronization during tissue remodelling (Hill et al., 1987).
Work by Jaffredo et al. (1989) on the c-myc protein expression during avian development, has shown that there is a time and tissue-specific expression during the gastrulation stages. The c-myc protein was barely detectable in nuclei of blastodiscs until somite formation. Then, it became ubiquitous in the embryonic body until stage E4 (post-gastrulation). During these stages, myotomal cells displayed especially high levels of c-myc. The signal disappeared when these cells organized into premuscular masses.
serum or Insulin In skeletal myotubes which are postmitotic cells in
vitro (Endo and Nadal-Grinard, 1986), suggesting that c-myc may have
several roles In the cell. In this context It is noteworthy that mutagenesis of the c-myc gene has shown four discrete domains and possibly separate functions (Gilman, 1987).
It has been shown that v-myc can cancel the dependence of murine fibroblast cells on growth factor (Rapp et al., 1985), and presumably the action of v-myc occurs In the nucleus at a site separated from the growth-factor receptors. The cellular myc gene, c-myc, Is Induced by growth agents: It has therefore been suggested that It Is an Intracellular mediator of mltogenesls. However, immortalized murine or rat fibroblasts transfected with c-myc or v-myc are not made completely independent of growth factor (Armelin et al., 1984; Roberts et al ., 1985). Consequently, it seems that myc sequences, at least in fibroblasts, must work In concert with other intracellular mediators to stimulate continuous proliferation In the absence of exogenous growth factors (Kelly, 1985).
needed to pass each G1 period. However, In a study where centrifugal élutriation was used to enrich peculations of avian and human cells at different stages of the cell cycle, it was shown, using myc-specific anti-bodies, that the synthesis, half-life and modification of c-myc proteins is constant throughout the cell cycle of normal and transformed cells (Hann et al., 1985). In an accompanying paper, it was shown that the levels of c-myc oncogene mRlTA are invariant throughout the cell cycle (Thompson et al., 1985). These contrasting results suggest that the level of c-myc expression is essentially the same in all growth phases of proliferating cells and in non-proliferating cells. Thompson et al. concluded that c-myc expression is continuous, with a rapid turnover throughout the cell cycle in non-differentiated cells, and that the increase in c-myc expression on stimulation, with the elevated levels of both c-myc RHA and protein, falls back to a constant basal level which is then maintained throughout subsequent cell cycles. At present, it is impossible to determine if c-myc expression is specific to the G1 part of the cell cycle or if it is an activational event that renders the cells competent to enter the cell cycle.
c-fos
The proto-oncogene c-fos has been directly Implicated^ In cell growth (Fishlkura and Murray, 1987), differentiation (Distel et al., 1987) and development (Eüther et al., 1987). The c-fos gene is of interest in the context of embryonic growth; a transient expression of c-fos mEITA is induced by external signals transferred by growth factors, suggesting that its protein product has a function in growth control and differentiation (Muller, 1986; Adamson, 1987).
The c-fos protein is DMA binding, and is thought to control the passage of cells from GO to 01 in the cell cycle (reviewed by Muller, 1986). c-fos is a nuclear phospho-protein of 55 K, which has a rapid turnover of about 20 mins in the cell. There are also differing degrees of post-translational modification of the protein (Curran et al., 1984), mainly by serine phosphorylation (Barber and Verma, 1987). c-fos has all the characteristics of a nuclear oncogene and has several similarities with c-myc. Indeed, it was shown that the c-fos protein efficiently trans-activates the c-fos and c-myc promoters but not a number of other promoters in a co-transfection assay (Gilman, 1987).
processes of fetal bone and mesodermal web tissue. Recent findings have shown enhanced expression of )3TGF and c-fos mRFAs in the growth plates of developing human long bones (Sandberg et al., 1988). Osteoblasts, involved in bone remodelling, contained high levels of c-fos and #TGF, suggesting that they could have functions in both skeletal growth and remodelling during embryogenesis. The complex pattern of stage and tissue-specific expression has raised the hypothesis that c-fos might function in the control of differentiation. However, no detailed analysis of the normal expression of the c-fos proto-oncogene during embryonic development in the gastrulation stages is presently available.
Despite extensive knowledge of the structure and expression of the c- fos gene, its precise role in the cell remains unclear. The rapid induction in a wide variety of cell types in response to many different stimuli suggests a generalized role in signal transduction (Verma and Sassone-Corsi, 1987). The c-fos protein can form a complex with DNA, thus it may have a role in the regulation of gene expression (Sambucetti and Curran, 1986). However, the evidence to date indicates that the c- fos protein may not bind DNA directly, but may require the formation of a complex with other nuclear proteins (Verma and Sassone-Corsi, 1987) - possibly with the c-jun proto-oncogene which dimerizes with itself and with c-fos, forming complexes of different DNA binding affinities
(Halazonetis et al., 1988), or with c-myc?
c-sls
In 1983, it was demonstrated that the v-sis (viral oncogene) of the simian sarcoma virus, was homologous to the J3 chain of PDGF (Vaterfield et al., 1983; Robbins et al., 1983). This was the first direct demonstration that an oncogene encodes a molecule involved in growth control.
Mouse embryo fibroblast cells stimulated with j3TGF express the c-sis gene after 4hr with a peak at 12-16hr and release a PDGF-like activity into the culture medium (Adamson, 1987). Early embryonic stem cells produce a PDGF-like activity (Rizzino and Bowen-Pope, 1985), but fail to bind the PDGF growth factor. It has not been shown whether these cells lack PDGF receptors, or if they are down-regulated by the secreted PDGF. However, when F9, PC13 and PSAl cells differentiate, they are able to bind and respond to PDGF. It has been suggested that if the corresponding embryonic cells, namely epiblast cells, produce PDGF-like factors, then these could stimulate growth of the adjacent, differentiating mesodermal cells which arise on 7 dpc in the mouse
(Adamson, 1987).
c-kit
Recent studies have shown that c-kit encodes a receptor tyrosine kinase and is a member of the PDGF receptor/CSF-1 receptor family (Yarden et al, 1987; Qui et al, 1988). Antibodies generated to the encoded protein detect glycosylated forms of 124-165 X lO^Mr, and a nonglycosylated form of 106 X lO^Mr consistent with the size of the predicted protein; it is a cell surface protein with autophosphorylation activity (Yarden et al., 1987; Majumder et al., 1988). Characterization of the molecular defects of several mutant alleles at the V locus has shown that they affect kinase activity and other aspects of c-kit receptor function (Tan et al., 1990; Mocka et al., 1990). c-kit expression is required for normal melanogenesis, haematopoiesis and gametogenesis and any mutation within the gene leads to developmental failure (Mintz and Russell, 1957). It is clear that c-kit and its ligand play an essential role in normal development during early embryogenesis and in postnatal development.
Growth Factors
trophoblast tissue developed In blastocyst outgrowth, which are equivalent to about 7 or 8 dpc (Adamson and Meek, 1984), However, the embryo/fetus does not appear to make EGF itself until around birth CPopliker et al., 1987). aTGF, which has homology with EGF and binds to EGF receptors (producing the same effects), has been found in 7 dpc mouse embryos (Twardzik, 1985) and may act via EGF receptors to modulate early embryonic growth. The other family of transforming factors, the #TGF group, has known growth regulating functions, both inhibition and stimulation in embryonic/fetal systems (see Massagué, 1987 for review), #TGF is widely distributed in normal tissues and will stimulate expression of c-sis. c-sis is the homolog of the ^ chain of PDGF, thus it has been suggested that fetal growth may be modulated locally by the interaction between #TGF and PDGF (Adamson, 1987). Complex multiple expression is also found in the FGF-like int-2 proto-oncogene, with sites in the mesoderm and extraembryonic endoderm during gastrulation and neurulation of early mouse embryos (Vilkinson et al., 1988), and later in the mesenchyme of the teeth and retina and in the cerebellum (Vilkinson et al., 1989). There is also a limited developmental expression of the colony stimulating factor, CSF-1, in the uterine epithelium, and its receptor, c-fms, (a tyrosine kinase receptor) is found in the maternal placenta (Eegenstreif and Rossant, 1989). Thus there is growing evidence for the role of polypeptide growth factors in mammalian development.
of secretory molecules, the homologue to human tissue factor, plasminogen activator Inhibitor, and two putative cytokines have been found.
From the data presented here. It Is possible to speculate upon the role of polypeptide growth factors and oncogene products In the control of cell growth and differentiation. In order to maintain homeostasis and prevent excessive proliferation, the division of normal cells must be tightly controlled. In mouse fibroblasts In which c-sis is induced by #TGF, the release of the PDGF-like factor seems to stimulate activation of c-fos and then c-myc. Both oncogenes are expressed In EC cells, c-fos at low levels in undifferentiated cells, but Increasing as differentiation proceeds; c-myc Is maximally expressed during proliferation of the stem cells and declines with differentiation. The changes In c-fos expression appear to occur at the transcriptional level, while for c-myc the changes appear to be both transcriptional and posttranscrlptlonal. Both c-myc and c-sls are co-expressed In the human placenta. It appears that c-sis expression leads to c-fos expression and then to c-myc expression, although the relationship between these oncogenes needs clarification - a growing volume of literature seems to support the notion of a cascade Involving all three in that order, possibly triggered Initially by J3TGF (Adamson, 1987). Unfortunately, in the context . of embryonic growth where prolonged cell proliferation precedes differentiation, the expression of c-fos and c-myc seems to be in the reverse order to what would be expected (Snow, 1987). It is possible that there could be a local interaction between #TGF and PDGF, controlling this embryonic growth. It has been suggested that there is also a feedback loop to limit proliferation, as some genes expressed after growth factor stimulation encode growth Inhibitors. For example, PDGF Induces elevated expression of two such Inhibitors, #TGF and Interferon p-2 (C-H. Heldln, personal communication). Down-regulation of c-myc expression has been observed in haemopoletic cell lines whose growth is inhibited by interferon (Marshall, 1987).
elements in a network that governs growth control. There are probably many pathways and widespread co-operativity amongst the oncogenes and elements of the cell.
MATERIALS AKD B EIBQDS
Nice
Pregnant females from the randomly bred Q stock were each given a single injection of 100-120 ug JOCC intraperitoneally between 6.75 and 7.0 dpc. Mice were killed by subluxation of the cervical vertebrae and the embryos were removed, microdissected if required, frozen directly in liquid nitrogen, and stored at -80 '=C until used to prepare RITA. Embryos
for in situ hybridization were washed in PBS x 3 and then immediately
fixed in 4% PFA.
Probes
Both the RITA membrane and tissue sections were hybridized with a 1.4kb Hind III/EcoRI fragment from pSVG2, c-myc (from Reuberger and Calabi, 1983) subcloned into pSP64 and pSP65. This fragment encodes the transcribed exon 2.
The following proto-oncogene and growth factor probes were hybridized to the Rorthern: the c-sis probe used was a 2.0kb BamHI/PstI cDRA fragment (generously provided by R. Gallo) which includes coding sequences presently described as the fifth and sixth exons of the human c-sis gene (Gelmann et al., 1981); the c-fos probe was a genomic Ikb HincII/RcoI fragment (provided by I, Verma) corresponding to most of the coding sequence (Curran et al., 1982); the c-kit probe was a l.lkb Sacl/Hindlll fragment (provided by P. Besmer) which encodes the transmembrane region near the 5' end of the region encoding the extracellular domain (Besmer et al., 1986); the J3TGF probe was a 1.05kb EcoRI fragment (provided by R. Derynck) that codes for the human #TGF gene (Derynck, 1986); the control a-actin probe was a l.lSkb PstI fragment, kindly provided by D. Wilkinson.
After washing with 70% ethanol the pellet was redlssolved In lOmX Trls- Cl, ImM EDTA, pH 8.0 and heat denatured hy boiling for 5 mln. The probe was chilled on ice and added to the hybridization mixture. Probes were labelled to an approximate specific activity of 1.5 x 10® cpm/ug DNA. These high specific activity were always used within 24 hours of preparation.
ENA Isolation
Firstly, total RNA was extracted from control and mitomycin C treated 9.0 and 13.5 dpc whole embryos by LlCl precipitation CAuffray and Rougeon, 1980): embryos were homogenized In 4ml of 3M LlCl, 6M urea, 0.5% SDS, 70 mM 2-mercaptoethanol, lOmM sodium acetate, pH 5.0. The homogenized embryos were stored at 4*C overnight, then RNA was pelleted by centrifugation In an HB4 rotor at 8000 revs mln~’ for 20 mins. RNA was resuspended In 0.2% SDS, lOOmM sodium acetate, pH 5,0 and extracted twice with phenol: chloroform: Isoamyl alcohol (24:24:1) and once with chloroform:Isoamyl alcohol (24:1). The aqueous phase was adjusted to a final concentration of 0.3 It sodium acetate pH 5.2 prior to overnight ethanol precipitation at -80*0. The RNA was recovered by centrifugation at 8000 revs mln"' for 20 mins, the pellet washed twice with 70% ethanol, once with 95% ethanol and alr-drled. The RNA was then dissolved In DEPC-treated water and stored at -80"C until used for mRNA Isolation.
Poly (A)^ RNA was then prepared by two cycles of chromatography on ollgo(dT)-cellulose.
Northern blots and Hybridizations
This technique Is more sensitive than in si tu hybridization as the tissue is fixed immediately after removal and allows some degree of quantitation of the mRFA levels in different fractions.
5ug of mRFA was electrophoresed in 1.2% agarose gels and blotted onto Hybondt (Amersham, UK). Blots were hybridized at 65*C overnight with a series of randomly primed probes. Blots were washed at 6 0 *C for 3 x 20 min in 0.1 x SSC, 0.1% SDS, filters were then exposed to preflashed Fuji RÏ-100 X-ray film with intensifying screens for 3-14 days at -70"C. Bound probes were removed prior to rehybridization by immersing the membrane in boiling 0.1% w/v SDS.
Several test Northerns were carried out in order to perfect the technique, and re-probing of a single blot was tested under suitable conditions. It was possible to re-probe a single blot up to six times without a large increase in background.
Densitometry
Relative amounts of D M and R M were quantitated by densitometry with a Sigma FTR-20 TIC densitometer and normalized with respect to the control probe. The densitometer was pre-set at appropiate parameters for the baseline sensitivity, speed and attenuation level and each track was similarly scanned.
jLa situ Hybridization
Due to the technical complexity of the technique and the absence of well-tested protocols for its application to mammalian embryos, it was felt that preliminary work with a well characterized tissue specific gene was essential. The mouse a-fetoprotein gene was therefore chosen to establish the technique (results shown in figure 2.5). Once the technique was working correctly, the c-myc proto-oncogene was used.
single-stranded probes generated from p8P.c-myc64 (114) hybridized to a 2.4 kb message (=c-myc), whilst probes from p8P.c-myc65 (113) detected no bands (data not shown). This confirmed that p8P.c-myc64 generated the antisense (=probe) transcript, whilst pSP.c-myc65 generated the sense
(=control) transcript.
[ -labelled single-stranded RNA probes (specific activity 8.5 x 10® dpm/ug) were synthesized by a modification of the method of Melton et al. (1984). Briefly, the transcription reaction was performed at 40'C for 60 min in a final volume of 20ul containing 40mM Tris-Cl, pH 7.5, 6mM MgCla, 2mM spermidine, lOmM NaCl, lOnM DTT, 2.5mM each of ATP, CTP, OTP, SOU RNase inhibitor (Amersham, UK), lug template DNA, lOOuCi [ a- ®®S]-UTP OlGOOCi/mmol, Amersham) and 16U SP6 RNA polymerase (Amersham). Following in vitro transcription, 7.5U DNase I (FPLC pure, Pharmacia) together with 30U RNase inhibitor and 20ug F.coli tRNA (Boehringer, Mannheim, ERG) were added to remove the template DNA. After incubation for 15 min at 37*0, the RNA was extracted once with phenol : chloroform (1:1) and once with chloroform. Unincorporated nucleotides were removed by ethanol precipitation of the labelled RNA (2M ammonium acetate, 2vol ethanol) for 10 min on dry ice. The RNA was then redissolved in 20mM DTT. The antisense (-) strand (i.e., complementary to c-myc mRNA) was synthesized using SP6 RNA polymerase after linearizing the template DNA with Hindlll. The sense (+) strand was synthesized using SP6 RNA polymerase after linearizing with EcoRI, and was used for control hybridization.
It has been suggested that for effective in situ hybridization, probes should be hydrolysed down to 50-150 nucleotides in length (Cox et al. , 1984). A time course for hydrolysis was determined for the c-myc which confirmed that the time dependence described by Cox et al. (1984) also held true for these probes. Probes were stored in 50% formamide and 20mM DTT at - 2 0 *C.
was omitted. After incubation in 0.21C HCl (20 min, RT) to remove basic proteins, sections were treated with proteinase K at lug/ml for 10 min at 37*C. The proteinase reaction was subsequently blocked with 0.2% glycine in PBS <30 sec, RT). The slides were then rinsed in PBS, fixed in 4% paraformaldehyde, acetylated, dehydrated and air-dried. Hybridization conditions were as described by Ingham et al. (1985). Probes were used at a final concentration of approximately 0.3ng/ul. Post hybridization washes including RNase A digestion were performed as described (Hogan et al., 1986), For autoradiography the slides were dipped in emulsion (G5, Ilford), diluted 1:1 with 1% glycerol in water. After air-drying, slides were exposed at 4*C for 3-10 days, developed in Kodak D19 developer (2 min at 2 0 * 0 , stopped in 1% acetic acid (1 min at 2 0 * 0 , fixed in 30% sodium thiosulphate (5 mln at 2 0 * 0 and rinsed in distilled water. Sections were stained in toluidine blue (0.02% for 30 sec), dehydrated and mounted. Photographs were taken under bright field and dark field illumination.
Hydrolysed single stranded probes from each construct were then used to probe sections from 7.0, 7.5, 8.5 and 9.5 dpc normal mouse embryos and to 9.0 dpc MMC treated embryos (9.0 dpc embryos were analysed as this was the stage where the greatest catch-up growth has been seen).
Important general results are that the background in these experiments was low with respect to the signal, under conditions-described above, and that hybridization is specific to the antisense probe. As well as the positive controls mentioned above (aAFP), negative controls were also included. Hybridization was carried out with the sense (mRNA) probe, RNase A treatment prior to hybridization and hybridization was performed without the antisense RNA probe. All three of these controls showed no hybridization.
this, emulsions of uniform thickness are required to eliminate variability in grain density due to variations in emulsion thickness. The main difficulty with measuring absolute quantities is the uncertainty about the extent of loss of m R M during tissue processing and about the efficiency of hybridization. In order to standardize the results, a system of using standard thickness emulsion-coated coverslips was used (Kodak, UK). Control and experimental sections were always placed on the same slide, and tissue processing was always uniform. Thus, these hybridizations provide an estimate of mRlîÀ quantities and not merely indicate if a cell does or does not transcribe a given gene.
Dot blot analysis