ISSN: 2231-5381
http://www.ijettjournal.org
Page 4104Design and Modelling of PV system and
Different MPPT algorithms
Ch.Kiran Kumar#1, T.Dinesh#2, S.Ganesh Babu#3 #1
Final Year B. Tech, Dept. of EEE, KL University, Guntur, AP, India
#2
Final Year B. Tech, Dept. of EEE, KL University, Guntur, AP, India
#3
Final Year B. Tech, Dept. of EEE, KL University, Guntur, AP, India
Abstract: Photovoltaic (PV) is a technical name in which
radiant (photon) energy from the sun is converted to direct current (dc) Electrical Energy. PV power output is still low, continuous efforts are taken to develop the PV converter and controller for maximum power extracting efficiency and reduced cost factor. Maximum power point trackers (MPPTs) play an important role in photovoltaic (PV) power systems because they maximize the power output from a PV system for a given set of conditions, and therefore maximize the array efficiency. Thus, an MPPT can minimize the overall system cost. MPPTs find and maintain operation at the maximum power point, using an MPPT algorithm. Many such algorithms have been proposed. The mostly used MPPT are P&O and Incremental Conductance Method and Constant voltage and current, Pilot cell etc, Fuzzy. In this paper the designing and Modelling of different algorithms have been implemented using Matlab and comparison of two algorithms is done.
Key points: Solar cells, MPPT, P& O, Fuzzy
I.INTRODUCTION
Solar Energy is the ultimate source of energy, which is naturally replenished in a short time period of time, for this reason it is called “Renewable Energy” or “Sustainable Energy”. Due to the severity of the global energy crisis and environmental pollution, the photovoltaic (PV) system has become one kind of important renewable energy source. Solar energy has the advantages of maximum reserve, inexhaustibleness, and is free from geographical restrictions, thus making PV technology a popular research topic. In this world 80 % of the green houses gases are released due to the usage of fossil fuel based. The world primary energy demand will have increased almost 60% between 2002 and 2030, averaging 1.7% increase annually, increasing still further the Green House Gases [1]. Oil reserves would have been exhausted by 2040, natural gas by 2060, and coal by 2300 [2]. This causes issues of high per KW installation cost but low efficiency in PV generators. [3-5]. currently more research works has been focussed on how to extract more power
ISSN: 2231-5381
http://www.ijettjournal.org
Page 4105focused on the design of PV and MPPT algorithm in Matlab.
II PV MODELLING OF PV CELL:
The solar cell is the basic unit of a PV system. An individual solar cell produces direct current and power typically between 1 and 2 W, hardly enough to power most applications. Solar Cell or Photovoltaic (PV) cell is a device that is made up of semiconductor materials such as silicon, gallium arsenide and cadmium telluride, etc. that converts sunlight directly into electricity. The voltage of a solar cell does not depend strongly on the solar irradiance but depends primarily on the cell temperature. PV modules can be designed to operate at different voltages by connecting solar cells in series. When solar cells absorb sunlight, free electrons and holes are created at positive/negative junctions. If the positive and negative junctions of solar cell are connected to DC electrical equipment, current is delivered to operate the electrical equipment.
Fig 1 PV cell equivalent circuit.
For simplicity, the single-diode model of Figure 1 is used in this paper [14]. This model offers a good compromise between simplicity and accuracy with the basic structure consisting of a current source and a parallel diode. In Figure 1, Iph represents the cell photocurrent while Rsh and Rs are, respectively, the intrinsic shunt and series resistances of the cell. where Iph [A] is the light-generated current at the nominal condition (25◦C and 1000W/m2), Ki is the
short-circuit current/temperature coefficient (0.0017A/K), Tk and Tref are, respectively, the
actual and reference temperatures in K, λ is the
irradiation on the device surface (W/m2), and the nominal irradiation is 1000W/m2. The value of module short-circuit current is ISC taken from the datasheet of the reference
model. in Figure 2.
Fig 2 : Modelling of Pv cell in Simulink
In view of that, the current to the load can be given as:
I= − ( )
−( ) (1)
In this equation, Iph is the photocurrent, Is is the reverse saturation current of the diode, q is the electron charge, V is the voltage across the diode, K is the Boltzmann's constant, T is the junction temperature, N is the ideality factor of the diode, and Rs and Rsh are the series and shunt resistors of the cell, respectively.
As a result, the complete physical behaviour of the PV cell is in relation with Iph, Is, Rs and
Rsh from one hand and with two
environmental parameters as the temperature and the solar radiation from the other hand.
Fig 3: SIMULINK subsystem for varying cell temperature
and solar radiation.
= [ + ( −298)]
1000 (2)
1 Iph S ub tract1
S ub tract
Pro du ct2 P rod uct1
Di vi de
c
Co nstan t4 rsh
Con sta n t3
10 0 0
Con stan t1
3 Isc 2
ISSN: 2231-5381
http://www.ijettjournal.org
Page 4106( ) = exp T
T
−1 E
NV (3)
Figure 4:Matlab/SIMULINK temperature effect
subsystem on diode reverse saturation current
III MPPT CONTROL ALGHORITHM
A. Perturb and Observe (P&O):
In this algorithm a slight perturbation is introduce system [7]. This perturbation causes the power of the solar module changes. If the power increases due to the perturbation then the perturbation is continued in that direction [7]. After the peak power is reached the power at the next instant decreases and hence after that the perturbation reverses. When the steady state is reached the algorithm oscillates around the peak point. In order to keep the power variation small the perturbation size is kept very small. A PI controller then acts moving the operating point of the module to that particular voltage level. It is observed that there some power loss due to this perturbation also the fails to track the power under fast varying atmospheric conditions. But still this algorithm is very popular and simple Figure 5, which shows an family of PV array power curves as a function of voltage (P–V curves), at different irradiance (G) levels, for uniform irradiance and constant temperature. As previously described, these curves have global maxima at the MPP. Assume the PV array to
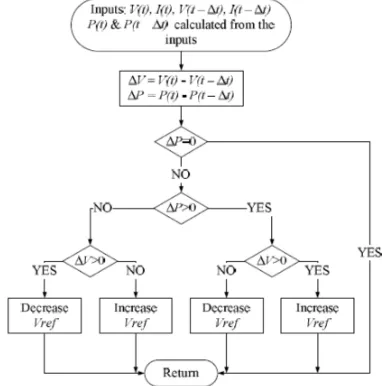
be operating at point A in Figure 5, which is far from the MPP. In the P&O algorithm, the operating voltage of the PV array is perturbed by a small increment, and the resulting change in power, Delta P, is measured. If Delta P is positive, then the perturbation of the operating voltage moved the PV array’s operating point closer to the MPP. Thus, further voltage perturbations in the same direction (that is, with the same algebraic sign) should move the operating point toward the MPP. If Delta P is negative, the system operating point has moved away from the MPP, and the algebraic sign of the perturbation should be reversed to move back toward the MPP.
Fig 5:Photovoltaic array power–voltage relationship
Fig 6: Flow chart Of P& O MPPT algorithm
ISSN: 2231-5381
http://www.ijettjournal.org
Page 4107respect to the perturbation of the voltage. The drawback of P&O
is that it cannot determine when it has actually reached the MPP. Instead, it oscillates around the MPP, changing the sign of the perturbation after each P measurement
B. Pilot cell:
In the pilot cell MPPT algorithm, the constant voltage or current method is used, but the open-circuit voltage or short-circuit current measurements are made on a small solar cell, called a pilot cell, that has the same characteristics as the cells in the larger solar array.13 The pilot cell measurements can be used by the MPPT to operate the main solar array at its MPP, eliminating the loss of PV power during the VOC or ISC measurement. However, the problem of a lack of a constant K value is still present. Also, this method has a logistical drawback in that the solar cell parameters of the pilot cell must be carefully matched to those of the PVarray it represents. Thus, each pilot cell/solar array pair must be calibrated, increasing the energy cost of the system.
C.Incremental conductance:
The incremental conductance algorithm is based on the fact that the slope of the curve power vs. voltage (current) of the PV module is zero at the MPP, positive (negative) on the left of it and negative (positive) on the right, as can be seen in Figure 7:
Fig7: PV panel characteristic curves
By comparing the increment of the power vs. the increment of the voltage (current) between two consecutives samples, the change in the MPP voltage can be determined.
Fig 8: Incremental Conductance algorithm
In both P&O and In Cond schemes, how fast the MPP is reached depends on the size of the increment of the reference voltage the drawbacks of these techniques are mainly two. The first and main one is that they can easily lose track of the MPP if the irradiation changes rapidly [7], [15]-[18]. In case of step changes they track the MPP very well, because the change is instantaneous and the curve does not keep on changing. However, when the irradiation changes following a slope, the curve in which the algorithms are based changes continuously with the irradiation, so the changes in the voltage and current are not only due to the perturbation of the voltage. As a consequence it is not possible for the algorithms to determine whether the change in the power is due to its own voltage increment or due to the change in the irradiation.
D: Fuzzy logic control:
ISSN: 2231-5381
http://www.ijettjournal.org
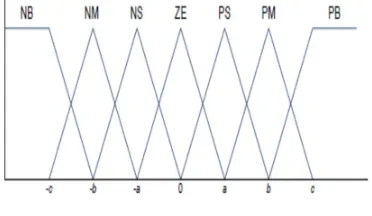
Page 4108degree of membership to certain sets. Membership functions, like the ones in Figure 15, are used to associate a grade to each linguistic term. The number of membership functions used depends on the accuracy of the controller, but it usually varies between 5 and 7 [8], [23]-[25]. In Figure 15 seven fuzzy levels are used: NB (Negative Big), NM (Negative Medium), NS (Negative Small), ZE (Zero), PS (Positive Small), PM (Positive Medium) and PB (Positive Big). The values a, b and c are based on the range values of the numerical variable. In some cases the membership functions are chosen less symmetric or even optimized for the application for better accuracy [8], [25].
Fig 9Membership functions.
The inputs of the fuzzy controller are usually an error, E, and the change in the error, Delta E. The error can be chosen by the designer, but usually it is chosen as Delta P/Delta V because it is zero at the MPP. Then E and Delta E are defined as follows
E= ( ) ( )
( ) ( )
∆ = ( )− ( −1) (3,4)
The output of the fuzzy logic converter is usually a change in the duty ratio of the power converter,
∆D, or a change in the reference voltage of the DC-link, ∆V. The rule base, also known as rule base lookup table or fuzzy rule algorithm, associates the fuzzy output to the fuzzy inputs based on the power converter used and on the knowledge of the user. Table I shows the rules for a three phase inverter, where the inputs are E and ∆E, as defined in (3,4) and the output is a change in the DC-link voltage,
∆V. For example, if the operating point is far to the right of the MPP, E is NB, and ∆E is zero.Then to reach the MPP the reference voltage should decrease, so ∆V should be NB (Negative) to move
the operating point towards the MPP. The
advantages of these controllers, besides dealing with imprecise inputs, not needing an accurate mathematical model and handling nonlinearity, are fast convergence and minimal oscillations around the MPP. Furthermore, they have been shown to perform well under step changes in the irradiation. However, no evidence was found that they perform well under irradiation ramps. Therefore, their performance under the conditions specified in [9] for testing the dynamic MPPT efficiency is unknown. Another disadvantage is that their effectiveness depends a lot on the skills of the designer; not only on choosing the right error computation, but also in coming up with an appropriate rule base [8].
E.Fractional short circuit current:
Just like in the fractional open circuit voltage method, there is a relationship, under varying atmospheric conditions, between the short circuit current ISC and the MPP current, IMPP, as is shown by:
≈ (5)
ISSN: 2231-5381
http://www.ijettjournal.org
Page 4109literature using this MPPT technique uses a DSP as controller
IV MODEL STRUCTURE AND SIMULATION
Fig 10 simulation of MPPT
In the process of simulation environment
temperature is settled at the level of 300 and the
light 1kw/m2. To facilitate the observation of trace
results light intensity changes from the original
1kw/m2 to 0.6kW/m2 after 0.4 seconds. Taking
simulating accuracy and speed into consideration,
we chose ode23tb. Simulation time take 0.1s. The
pv system is designed using subsystem in Matlab
and the o/p of the pv cell is connected to diode and
is connected to the filter capacitor and resistor and
is given to the boost converter and the ripples form
the boost converter can be eliminated using the
capacitor filter and the Load of resistive load is
connected which acts as a dc load, the o/p terminals
of the PV system are connected to the MPPT
algorithm either the P&O or Incremental
conductance Method. And the o/p signal of MPPT
is Compared with The carrier wave this in terms
can be known as PWM (Pulse Width Modulation),
and the gating signals generated from the PWM are
given to the IGBT Gating signals.
A: Incremental Conductance Method:
Fig:11 Incremental conduction method circuit
Fig 12Incremental conduction method algorithm 2 V 1 I 2 b 1 i1 1 const ant1 1 const ant v + -Voltage Me asure me nt
31 V oc1 31 V oc 23.45 V mp1 23.45 V mp S um
S er ie s RLC Branch1
S e rie s RLC Branch
Product 3 P roduct 2
P roduct1 Product eu Math Funct ion3 1 u M at h Functi on2 l n Mat h Functi on1 eu Math Functi on 4.085 Isc 3.6 I mp -1 Gain u(1)*4.085 Fcn Divi de4 Divi de3 Di vide2 Di vide1 Divi de i + -C urre nt Me asure ment
s
-+
C ontrolle d C urrent Sour ce 1
s
-+
C ontrolle d C ur rent S ource
4. 085 Constant 5 31
Const ant4 1
Constant2 A dd1 A dd 2 I n2 1 I n1
C 2 C 1
Dis crete, Ts = 5e-005 s.
powergui +v
-Voltage Measurement fourth To Workspace3 third To Workspace2 second To Workspace1 first To Workspace In 1 In 2 In 3 O u
t1Subsystem 1 Step
Signal Generator
Series RLC Branch3 Series RLC Branch2
Series RLC Branch1Series RLC Branch
ISSN: 2231-5381
http://www.ijettjournal.org
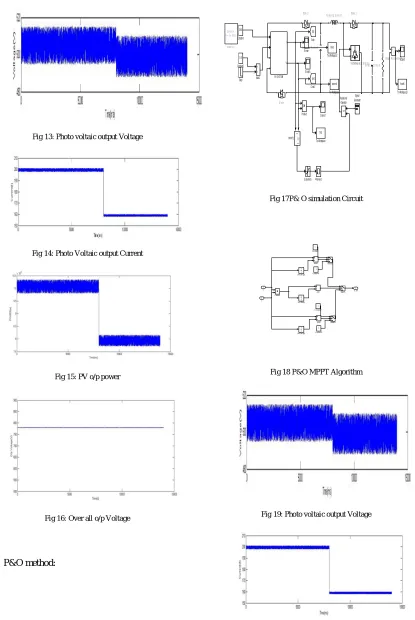
Page 4110 Fig 13: Photo voltaic output VoltageFig 14: Photo Voltaic output Current
Fig 15: PV o/p power
Fig 16: Over all o/p Voltage
B: P&O method:
Fig 17P& O simulation Circuit
Fig 18 P&O MPPT Algorithm
Fig 19: Photo voltaic output Voltage
Fig 20: Photo Voltaic output Current
Discre te, Ts = 5e-005 s.
powe rgui
v + -Voltage Measurement
fourth
T o Workspace3 third
To Workspace2
second
To Workspace1
first
T o Workspace Step
Signal Generator
Series RLC Branch3 Series RLC Branch2
Series RLC Branch1Series RLC Branch Scope3
Scope2 Scope1 Scope
Saturation <= Relational Operator
Product I
V
PV SYST EM
Memory1 V I
V
_
re
f
MPPT1
g C E IGBT/Diode
[vs]
Goto1 [Is]
Goto
Diode2 Diode1
Diode
0.5
Constant1 300
Constant
+ + Add1
1 V_ ref
z 1
Un it De lay2 z 1
Un it De lay1
z 1
Un it De la y
Switch 2 Switch1
Switch P ro d uct
1
C on stan t3 -1
C on stan t2 -1
Con sta nt1 1
Co n stan t
Ad d2 Ad d1
Add
ISSN: 2231-5381
http://www.ijettjournal.org
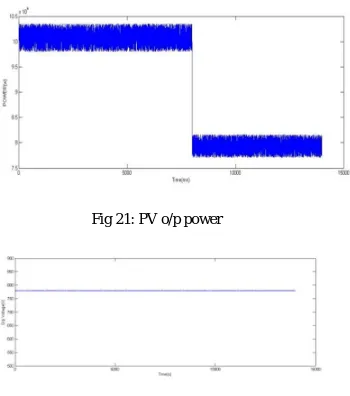
Page 4111 Fig 21: PV o/p powerFig 22: Over all o/p Voltage
CONCLUSION
This paper has presented a Modelling and designing of PV and different algorithms and comparison of two most popular MPPT controllers, Perturb and Observe Controller with Incremental Conductance Controller. This paper focus on comparison of two different converters which will connect with the controller. One simple solar panel that has standard value of insulation and temperature has been included in the simulation circuit.The scope of the study was limited to those algorithms thought to be applicable to low-cost implementations with currently available hardware. The results suggest that, on the basis of maximum power point tracking efficiency, the perturb-and-observe method, already by far the most commonly used algorithm in commercial converters, has the potential to be very competitive with other methods if it is properly optimized for the given hardware. Incremental conductance performed as well as P&O, but in general its higher implementation cost would not be justified by any improvement in performance. Finally, as expected, the MPPT efficiency increases gained by using the perturb-and-observe and incremental conductance algorithms make them favourable over the others.
REFERENCES
1. Katan RE, Agelidis VG, Nayar CV. Performance analysis of a solar water pumping system. Proceedings of the 1996 IEEE
International Conference on Power Electronics, Drives, and Energy Systems for Industrial Growth (PEDES), 1996; 81–87.
2. Taha MS, Suresh K. Maximum power point tracking inverter for photovoltaic source pumping applications. Proceedings of the 1996 IEEE International Conference on Power Electronics, Drives, and Energy Systems for Industrial Growth (PEDES), 1996; 883–886.
3. Kourtoulis E, Kalaitzakis K, Voulgaris NC. Development of a microcontroller-based, photovoltaic maximum power point tracking control system. IEEE Transactions on Power Electronics 2001; 16(1): 46–54.
4. Won C-Y, Kim D-H, Kim S-C, Kim W-S, Kim H-S. A new maximum power point tracker of photovoltaic arrays using fuzzy controller. Proceedings of the 24th IEEE Power Electronics Specialists Conference (PESC), 1994; 396–403.
5. Hua C, Shen C. Comparative study of peak power tracking techniques for solar storage systems. IEEE Applied Power Electronics Conference and Exposition—APEC, Proceedings of the 1998 13th Annual Applied Power Electronics Conference and Exposition 1998; 2: 697–685.
6. Hussein KH, Zhao G. Maximum photovoltaic power tracking: an algorithm for rapidly changing atmospheric conditions. IEE Proceedings of Generation, Transmission, Distribution 1995; 142(1): 59–64.
[7] Vikrant.A.Chaudhari, "Automatic Peak Power Traker for Solar PV Modules Using dSpacer Software.," in Maulana Azad National Institute Of Technologyvol. Degree of Master of Technology In Energy. Bhopal: Deemed University, 2005, pp. 98.
[8] T. P. Nguyen, "Solar Panel Maximum Power Point Tracker," in Department of Computer Science & Electrical Engineering: University of Queensland, 2001, pp. 64.
[9] B. S, Thansoe, N. A, R. G, K. A.S., and L. C. J., "The Study and Evaluation of Maximum Power Point Tracking Systems," International Conference on Energy and Environment 2006 (ICEE 2006), pp. 17-22, 2006.
10. Andersen M, Alvsten B. 200W low cost module integrated utility interface for modular photovoltaic energy systems. IECON: Proceedings of the 1995 IEEE 21st International
Conference on Industrial Electronics, Control and
Instrumentation 1995; 1(1): 572–577.
11. van der Merwe L, van der Merwe G. Maximum power point tracking—implementation strategies. Proceedings of the IEEE International Symposium on Industrial Electronics 1998; 1(1): 214–217.
12. Abou El Ela M, Roger J. Optimization of the function of a photovoltaic array using a feedback control system. Solar Cells: Their Science, Technology, Applications and Economics 1984; 13(2): 185–195.
ISSN: 2231-5381
http://www.ijettjournal.org
Page 4112 14. Brambilla A, et al. New approach to photovoltaic arraysmaximum power point tracking. Proceedings of the 30th IEEE Power Electronics Conference, 1998; 632–637.
15. Hovel HJ. Semiconductors and Semimetals: Solar Cells. Academic Press: New York, 1975; 64ff.
16. Fraas LM, Avery JE, Gruenbaum PE, Sundaram VS. Fundamental characterization studies of GaSb solar cells. Proceedings of the IEEE Photovoltaic Specialists Conference, 1991; 80–84.
17. Hua C, Lin J, Shen C. Implementation of a DSP-controlled photovoltaic system with peak power tracking. IEEE Transaction on Industrial Electronics 1998; 45(1): 99–107.
![Figure 1 is used in this paper [14]. This model offers a good compromise between simplicity and accuracy with the basic structure](https://thumb-us.123doks.com/thumbv2/123dok_us/8603246.1724754/2.612.363.503.542.600/figure-paper-model-offers-compromise-simplicity-accuracy-structure.webp)