TEXT MINING TRANSPORTATION RESEARCH GRANT BIG DATA:
KNOWLEDGE EXTRACTION AND PREDICTIVE MODELING USING
FAST NEURAL NETS
Kasthurirangan Gopalakrishnan1, Siddhartha K. Khaitan2
1 Department of Electrical Engineering and Computer Science, Northwestern University, USA 2 Department of Electrical and Computer Engineering, Iowa State University, USA
Received 26 March 2017; accepted 15 June 2017
Abstract: Research grant databases offer a wealth of information to study research trends, research collaboration networks and patterns of funding over time. Natural Language Processing (NLP) and Text Mining (TM) in combination with Machine Learning (ML) are excellent data science tools to collect, analyze and to unearth interesting findings from huge text corpora such as these databases. At a time, when transportation agencies across the globe are facing budgetary constraints and are asked “to do more with less”, extracting information from such databases to build predictive models for aiding or providing guidance to researchers and agencies has become very important. At the same time, understanding past patterns of funding and interest in various subject areas is also useful for PhD researchers planning their research formulation and for academic researchers seeking funding in general. We present a comprehensive study of the Transportation Research Board’s (TRB’s) Research in Progress (RIP) “big data” that contains information on more than 14,000 current or recently completed projects funded in the past 25 years, mainly by U.S. Department of Transportation (DOT) and State DOTs. We perform longitudinal studies to discover various interesting patterns and anomalies in the data using text mining pipelines. Finally, we develop a predictive model to leverage text mined information for predicting the most appropriate funding agency to target for a researcher working across various research areas.
Keywords: database, natural language processing, text mining, machine learning, predictive modeling.
1 Corresponding author: [email protected]
1. Introduction
The Transportation Research Board (TRB), one of the seven program units of the U.S National Academies of Sciences, Engineering, and Medicine, has the primary mission of promoting transportation innovation and progress through research. It manages transportation research by producing publications and online resources.
users from these funding agencies to add, modify and delete information on their current research projects individually or in batch mode submittal. All project records are reviewed by professional indexers, who add Transportation Research Thesaurus (TRT) terms. In addition to funded transportation projects in the US, the RIP database also contains curated records from the International Transportation Research Documentation Database and the Canadian Surface Transportation Research Database. Users of the R IP website can search the entire RIP database by various fields (keywords, title, etc.), browse subject records by subject category (administration and management, aviation, bridges and structures, construction, data and information technology, etc.), download the records, etc. These records contain a lot of useful information which can be converted into knowledge using appropriate data science techniques. A number of students, researchers, and practitioners in transportation across the globe use the RIP database for identifying emerging transportation research topics, prevent duplication of research, identify/connect researchers working on similar projects, identify experts for panels or committees, etc. Albeit the ease of use of TRB’s RIP website, it is still not straightforward for a user to extract the needed information.
Currently, advances in Text Mining (TM) and Machine Learning (ML) have shown significant success in mining important information from text corpora and build predictive models to solve several real world problems (Singhal et al., 2016b). In this paper, we use TM and ML approaches to mine several important insights from the TRB’s RIP database. We use the data extracted from the TRB RIP website which stores detailed
and curated records of over 14,000 research projects funded or proposed in the last 25 years (since 1990). We used several project descriptors such as its subject areas, funding agencies, funding amount to understand patterns and trends in funding and research interest over a period of time. Based on the analysis, we answer some interesting questions about: how funding agencies have invested over a period of time, what subject areas have emerged as interesting and which ones have diminished in interest, how have funding agencies invested in various subject areas over time, etc. We also propose a novel ranked recommendation approach using Neural Networks (NN) to recommend appropriate funding agencies to researchers with multiple research interests.
The rest of this paper is organized in the following manner. A brief summary of related works is first presented before describing the data and the proposed approach which involves data extraction, cleaning, preprocessing, analysis, and predictive modeling. Following a thorough analysis of the RIP text data, we discuss a machine learning approach to predict a ranked list of agencies given a list of researcher’s subject areas of interest followed by overall research findings and conclusions.
2. Related Works
program. In the recent times, the analysis is done on publically available databases such as those from National Institutes of Health (NIH) (Talley et al., 2011; Park et al., 2016), National Science Foundation (NSF), and The National Natural Science Foundation of China (NSFC) (Huang et al., 2016). Park et al., (2016) performed analysis on the NIH database that revealed several insights about funding investment patterns in various diseases. Huang et al.,
(2016) provided a comparative study of NSF and NSFC in the field of Big Data. Their main finding explained how these agencies address the need of big data by focusing on interdisciplinary research projects. (Wu, 2015) used the NSFC database to study the distribution of scientific funding across universities and research disciplines.
In our current work, we focus more on the TM aspect of the databases and add a component of predictive modelling to make the analysis useful in the real world scenario. There are
various other aspects of scientific research where novel scientific artifacts are discovered using TM and used for predictive modeling purposes. Singhal et al., (2016a, 2016b, 2016c) leveraged text mining and web intelligence to discover scientific research datasets from research articles in the domain of computer science and built a predictive modelling based search engine to help researchers find relevant datasets for their research purposes. In the area of bioinformatics and healthcare, Singhal et al., (2016b, 2016c) used TM and ML based predictive modeling approaches to find potential diseases for a given gene-mutation in a patient. These works used information from biomedical literature to build such a predictive system.
3. Study Approach
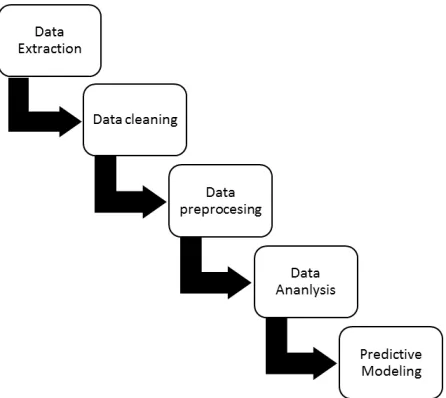
In this section, we discuss the text mining pipeline designed to analyze the entire RIP database. Fig. 1 shows the text mining pipeline.
Fig. 1.
3.1. Data Extraction
The dataset for this study was collected from the URL of the TRB’s RIP database: https://rip.trb.org/. The data was extracted in XML format using the ‘Save’ feature of the URL. Currently, the database server does not support converting all the project entries (~14,000) in single phase. The data was, therefore, downloaded in four chunks portioned on the ‘from date’ to ‘to date’. We used the following partitions on ad-hoc basis: (1) 1990 – 2004, (2) 2005 – 2009, (3) 2010 – 2014, and (4) 2015 – 2017.
Since, the XML format cannot be directly used for analysis purpose, we converted it into a tabular format using an online service called ‘convertcsv.com’. The data fields
were delimited using tab-delimiter to avoid comma within the text fields of the data to distort the data table. Finally, we aggregated all the four tables into a single table.
3.2. Data Cleaning
The final table contained a total of 14,506 rows (denoting projects) and 129 columns (denoting fields describing the project). The table had to be further cleaned by removing duplicate rows and removing HTML tags in the text field of each project, cleaning project funding amounts by removing ‘$’ signs, text content and commas.
For cleaning HTML tags, we used Python’s HTMLParser library (MLStripper function). We formatted the funding amount values using regex patterns and converted them into float values.
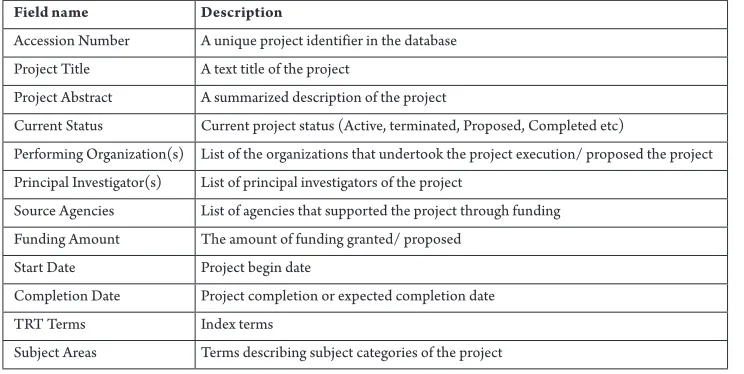
The cleaned up version of the table was finally reduced to 14,183 rows and 129 columns. However, for further analysis, we utilized only a subsets of the 129 columns. We provide a sample summary of the fields extracted from the RIP database in Table 1.
Table 1
A Sampling of the Fields Extracted from the RIP Database
Field name Description
Accession Number A unique project identifier in the database Project Title A text title of the project
Project Abstract A summarized description of the project
Current Status Current project status (Active, terminated, Proposed, Completed etc)
Performing Organization(s) List of the organizations that undertook the project execution/ proposed the project Principal Investigator(s) List of principal investigators of the project
Source Agencies List of agencies that supported the project through funding Funding Amount The amount of funding granted/ proposed
Start Date Project begin date
Completion Date Project completion or expected completion date
TRT Terms Index terms
3.3. Data Preprocessing
In this work, we limit our analysis to projects’ subject areas, funding amounts, funding agencies, start date, completion date (or expected completion date), project current status, TRT terms, abstract and title. The data table prepared in the previous step was further processed to append the table with new derived fields. For analysis purpose, we appended each project entry in the table with: count of source agencies, count of performing organizations, count of principal investigators, abstract word count, count of TRT terms, and count of subject areas.
3.4. Data Analysis
In this section, we discuss the various interesting analysis performed on the dataset
we prepared in the previous section. The analysis is performed to summarize both the overall status of the database as well as the temporally evolving aspect of the database content (i.e. the research projects in the database).
3.4.1. Analysis of the Overall Dataset
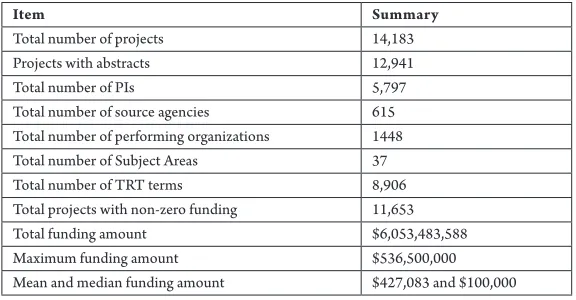
In Table 2, we provide a basic summary of the various fields contained in our data. As shown in Table 2, about 91% of the total projects in the database have abstracts and about 82% projects have the funding amount mentioned. The 20% of non-funded projects is due to error in data entry for these projects. Our analysis is therefore helpful for database curators to correct data entry errors due to human involvement. The table provides various interesting details about the funding levels of the projects.
Table 2
Summary of the RIP Database Contents
Item Summary
Total number of projects 14,183
Projects with abstracts 12,941
Total number of PIs 5,797
Total number of source agencies 615
Total number of performing organizations 1448
Total number of Subject Areas 37
Total number of TRT terms 8,906
Total projects with non-zero funding 11,653
Total funding amount $6,053,483,588
Maximum funding amount $536,500,000
Mean and median funding amount $427,083 and $100,000
3.4.2. Temporal Analysis of the Overall
Dataset
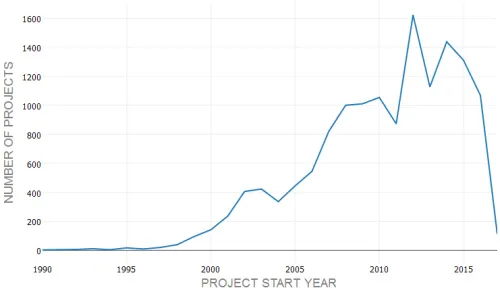
In Fig. 2, the count of projects per year is plotted. As shown in the figure, there is a sharp increase in the total projects in
Efficient Transportation Equity Act: A Legacy for Users (SAFETEA-LU), a bill for funding the surface transportation infrastructure, was signed into law by the then President George W. Bush in 2005 and expired in 2009. The
bill was updated and replaced by the Moving Ahead for Progress in the 21st Century (MAP)
Act in 2012. This explains to a great deal the sharp increase in the funding amount and the number of projects right after year 2012.
Fig. 2.
Plot Showing Trend of Total Projects per Year (1990 to 2017)
The trend of total funding amount per year is shown in Fig. 3. There are two sharp peaks in year 2002 and 2012. The peak in year 2012 can be explained using the observation in year 2012 in Fig. 2; increased number of
projects leads to increased number of total funding in that year. However, the sharp increase in total funding in year 2002 is very interesting. The reason for this is not fully clear.
Fig. 3.
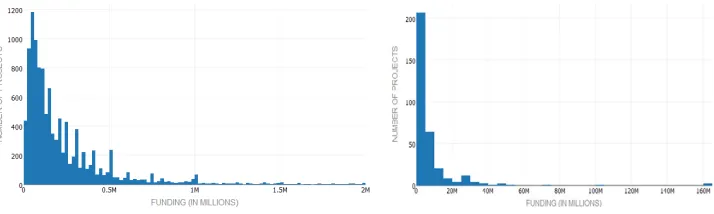
Next, we analyze the distribution of projects across funding amounts using histograms shown in Fig. 4 (a) & (b). Because of large variation in the funding amounts, we divided the data into two funding slabs: (1) funding amount less than $2M USD; (2) funding amount greater than $2M USD.
We have removed the project that received the maximum funding because it was an outlier and would have skewed the histogram in Fig. 3(b) significantly. Consistent with the observations in Table 1, the maximum number of projects are funded at around $100,000.
Fig. 4.
Histograms Showing Distribution of Projects Over Various Funding Levels: (a) Projects With Funding Below $2M; (b) Projects With Funding Above $2M.
In Fig. 5, a summary of funding amount invested by various agencies over time is presented. In the data analyzed, we had several projects supported by multiple source agencies, although a majority came from US DOT, State DOTs, and university transportation centers. In order to calculate the total funds invested by each agency, in case of multi-agency funded projects, we distributed the full project funding to all the supporting agencies. Although the relative importance of the supporting agencies may have varied, we did not account for the relative importance in the current work. Fig. 5 shows only a subset of total 615 agencies (on the y-axis) ordered by the total overall
Fig. 5.
Heatmap Showing Temporal Trend of Funding Amounts Given per Year Across Various Source Agencies
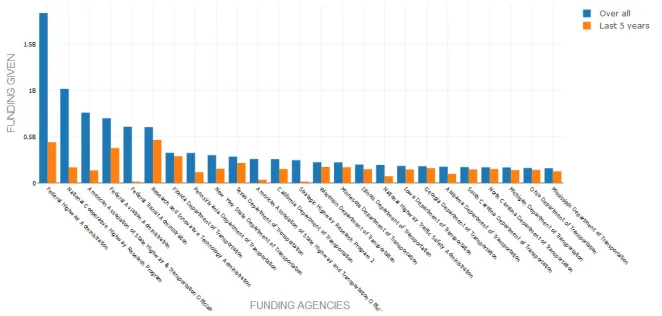
In Fig. 6, we analyze the top-25 highest funding source agencies. We perform a comparative analysis to uncover the change in participation of these agencies in supporting various research projects in the last five years compared to its overall participation. For agencies such as the Federal Transit Administration (FTA), American Association of State Highway and Transportation Officials (AASHTO)
and Strategic Highway Research Program (SHRP) 2, participation in funding has been significantly less in the last 5 years. On the other hand, agencies such as Florida DoT, Texas DoT, Wisconsin DoT, Illinois DoT, Georgia DoT, South Carolina DoT, North Carolina DoT, Michigan DoT, Ohio DoT, Mississippi DoT have mostly begun funding more projects only in the last 5 years, at least as reported in the RIP database.
Fig. 6.
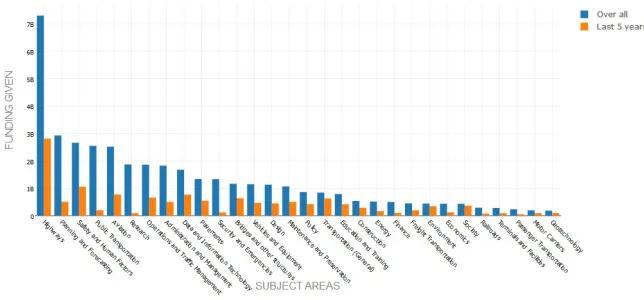
After the analysis of how various source agencies have invested over time, we perform analysis to extract information about how funding amounts and project counts have varied across various subject areas over time. The aim of the analysis is to observe whether there are some prominent subject areas where funding agencies have greater interest than others. The analysis reveals further insights about the unusual observations made in Figs. 1 and 2. As found earlier, year 2002 marked some anomalous funding investments and Fig. 7 further details the subject areas where these investments were made. We find that subject areas such as “Highways”, “Planning and Forecasting”, and “Public Transportation” were amongst the highest funded projects. The second tier of high funding was in the subject areas of “Aviation” and “Security and Emergencies”. In Fig. 8, we analyze the changes in funding distributions across
the top-25 of the highest funding source agencies in detail. This figure provides some guidance on understanding those areas that have become less interesting or relevant from the funding perspective in the last 5 years as reported in the RIP database. Clearly, “Planning and Forecasting” shows a decreased interest although it was one of the heavily funded areas in 2002. Similarly, “Public Transportation” and “Security and Emergencies” have a significant drop in the funding amounts in the last 5 years. Such important trends are very helpful for researchers working in these fields to understand the need of the society and stakeholders for research and development. Since the federal or state interest in various subject areas is heavily driven by the geo-political and social situations at a given time, the interest and therefore the funding amounts will vary accordingly at different times.
Fig. 7.
Fig. 8.
Comparative Analysis of Funding Distribution (Total vs. in last 5 Years) Across Subject Areas
3.5. Predictive Modeling
Following the thorough analysis of the data and studying various interesting patterns in the longitudinal study of investments by agencies across various subject areas, a natural question arises: Can we leverage all the information to help researchers find the best funding agency for their research area? In this section, we discuss a machine learning
approach to predict a ranked list of agencies, given a list of researcher’s subject areas of interest. We leverage the Neural Network (NN) learning model in a novel way to learn from the agency and subject areas interaction data for the entire study period, i.e., 1990-2017. Fig. 9 shows a pictorial representation of the NN model we have used to model the interactions between subject areas and the funding agencies.
Fig. 9.
The NN predictive model consists of two phases: training and testing. In order to perform predictive modeling on our dataset, we first filtered the data using the following conditions to minimize noisy samples in the training and testing phase:
1. Funding >= 10000; and (to remove projects with errored funding amount curation);
2. Agencies.Count > 0; and 3. Subject.area.count > 0.
Our dataset consisted of a total 11,465 projects where each project was represented by its subject areas and the agencies that funded the project. The total dataset was then partitioned into train and test sets using a random 80%-20% sampling. The training set contained 9,172 samples and the test set contained 2,293 samples.
Each row in the train and test samples was then converted using one-hot encoding. In one-hot encoding, each row is represented as vector with dimensions corresponding to all the possible attributes for a row. Our dataset contained 37 unique subject areas and 437 unique source agencies. Hence, each row in the train and test set was represented in a 37+437 (474) dimension space. As shown in Fig. 9, the subject areas are set as input to the input layer of the NN and the funding agencies are at the output layer. There is one hidden layer which can contain a variable number of neurons. We determine the optimal number of nodes by empirical analysis of our NN’s predictive performance.
We employed a fast NN model (FCNN4R - Fast Compressed Neural Network library for R) for efficient training of the model on the train set. Each row in the training set was input in the following manner: the
37 length binary vector representing the subject areas was fed to the input nodes and the 437 length binary vector representing the funding agencies was set at the output layer. Using these inputs and outputs, the NN was trained to learn weights of all the connecting edges using the resilient backpropagation algorithm. Each layer used the sigmoid activation function. We used sum of squared errors (SSE) as the metric for optimizing the weights learned on the connecting edges (tolerance level was set to 0.0005) and maximum epoch was set to 500. The weights on the edges were initialized randomly and then updated as new training samples were fed to the network. The final trained network was generated using the train set.
The trained network was then tested on the test set with 2,293 samples. In this case, only the 37 length binary vector representing the subject area per projects were input to the trained network. Corresponding to each input sample, each output node obtained a value between 0 and 1 (not a binary prediction). The predicted scores per node can be used to rank the funding agencies for a given project. A higher predicted score (close to 1) on the output node denotes that the corresponding funding agency is highly probable to fund the project whereas a lower score (close to 0) on the output node denotes that the corresponding funding agency is less likely to fund the project. The ranking is done by ordering the agencies in the descending order of their predicted scores. Finally, the agencies with a 0 predicted score were pruned off from the predicted list.
the actual list of agencies that funded each project in the test set to validate the accuracy. Since our predicted output was a ranked list, we employed commonly used information retrieval metrics to compute the accuracy (results summarized in Table 3), namely average Recall@k and average Precision@k:
• R ec a l l@k : it i s def i ned a s t he proportion of relevant (or correct) results that are present in the top-k predictions;
• Precision@k: it is defined as the proportion of top-k predictions that are relevant (or correct).
Table 3
Summary of NN Predictive Modelling Results
k Avg Precision Avg Recall
1 0.44 0.31
2 0.32 0.42
3 0.26 0.50
4 0.22 0.55
5 0.19 0.58
10 0.11 0.67
15 0.08 0.74
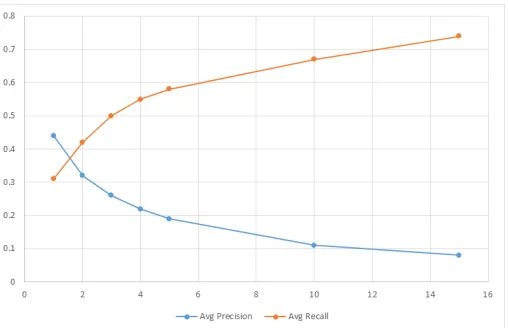
Fig. 10 displays the precision@k and recall@k values plotted at different values of k. We observe that precision drops as k increases and recall increases as k increases. In this figure, we find that the developed NN model is able to predict nearly 75% of the correct agencies in the top-15
predictions (on average) on the test set. Even the performance in top-1 prediction in terms of precision and recall shows that the predictive model can predict nearly 31% of the correct agencies on the first rank and the prediction results on the first rank are 44% correct.
Fig. 10.
4. Summary of Findings and Conclusions
The TRB’s Research in Progress (RIP) database is a public online repository that contains information on more than 14,000 (as of January 2017) current or recently completed transportation projects funded mostly by U.S. Department of Transportation (DOT), State DOTs, and U.S. DOT funded university transportation research centers. In this paper, we use Text Mining (TM) and Machine Learning (ML) approaches to mine several important insights from the TRB’s RIP database. We also propose a novel ranked recommendation approach using Neural Networks (NN) to recommend appropriate funding agencies to researchers with multiple research interests. Important findings from the study are summarized as follows:
• There is a sharp increase in the total number of projects awarded in the year 2012 as compared to other years. This is likely to be attributed to the reauthorization of the transportation funding bill by the U.S. congress in the form of Moving Ahead for Progress in the 21st Century (MAP) Act in 2012.
• Significantly higher number of funding grants were awarded by NCHR P, especially in year 2002. This could probably be related to a number of research grants awarded for the development and implementation of the new Mechanistic-Empirical Pavement Design Guide (MEPDG) in the highway side. Similarly, there is a distinctly high funding in year 2012 by a few agencies which could be linked to the reauthorization of the highway bill under the MAP Act.
• For agencies such as the Federal Transit Administration (FTA), American Association of State Highway and Transportation Officials (AASHTO) and Strategic Highway Research Program (SHRP) 2, participation in funding has been significantly less in the last 5 years. On the other hand, State Departments of Transportation (DOTs) have funded relatively more projects in the last 5 years, at least as reported on the RIP website. Even the same funding agency’s interest in various subject areas vary significantly every year (based on analysis of funding patterns in the last 5 years).
• The developed NN-based predictive models can be used to find appropriate funding agencies for projects spanning multiple subject areas.
Our future work will focus on analyzing the interaction between source agencies and subject areas over the years using unsupervised co-clustering algorithms. We’ll also employ Deep Learning (DL) algorithms to predict the estimated budget for a new project in a given subject area and source agency based on historical trends.
Acknowledgements
References
Daly, J. 2016. TRB Webinar: Learning About and Using the Research in Progress (RiP) Database. Available from internet: <http://www.trb.org/ElectronicSessions/ Blurbs/174599.aspx>.
Grobelnik, M.; Mladenić, D. 2003. Analysis of a database of research projects using text mining and link analysis. In Data Mining and Decision Support, Springer. New York, US. pp. 157-166.
Huang, Y.; Zhang, Y.; Youtie, J.; Porter, A.L.; Wang, X. 2016. How Does National Scientific Funding Support Emerging Interdisciplinary Research: A Comparison Study of Big Data Research in the US and China, PLoS ONE 11(5): e0154509.
Park, J.; Blume-Kohout, M.; Krestel, R.; Nalisnick, E.; Smyth, P. 2016. Analyzing NIH funding patterns over time with statistical text analysis. In Scholarly Big Data: AI Perspectives, Challenges, and Ideas, Workshop at AAAI. AAAI Press, Palo Alto, CA, 698-704.
Simmons, M.; Singhal, A.; Lu, Z. 2016. Text Mining for Precision Medicine: Bringing Structure to EHRs and Biomedical Literature to Understand Genes and Health. In Translational Biomedical Informatics. Springer, Singapore, 139-166.
Singhal, A.; Srivastava, J. 2016a. Data extract: Mining context from the web for dataset extraction, International Journal of Machine Learning and Computing 3(2): 219. Singhal, A.; Simmons, M.; Lu, Z. 2016b. Text mining for precision medicine: automating disease-mutation relationship extraction from biomedical literature,
Journal of the American Medical Informatics Association
23(4): 766-72.
Singhal, A.; Simmons, M.; Lu, Z. 2016c. Text mining genotype-phenotype relationships from biomedical literature for database curation and precision medicine,
PLOS Computational Biology 12(11): e1005017. Talley, E.M.; Newman, D.; Mimno, D.; Herr II, B.W.; Wallach, H.M.; Burns, G.A.; Leenders, A.M.; McCallum, A. 2011. Database of NIH grants using machine-learned categories and graphical clustering,
Nature Methods 8(6): 443-444.
Wu, J. 2015. Distributions of scientific funding across universities and research disciplines, Journal of Informetrics