Research article
Available online www.ijsrr.org
ISSN: 2279–0543
International Journal of Scientific Research and Reviews
Evaluation of Rain Gauge Network using Maximum Information
Minimum Redundancy Theory
Vivekanandan N.*, Roy SK, Chavan AK
Central Water and Power Research Station, Pune 411024, Maharashtra, India
________________________________________________________________________________
ABSTRACT
Establishment and maintenance of a Rain Gauge Network (RGN) in any geographical region is required for planning, design and management of water resources projects. Setting up and maintaining a RGN is an evolutionary process, wherein a network is established early in the development of the geographical area; and the network is reviewed and upgraded periodically to arrive at the optimum network. This paper illustrates the use of entropy theory-based criterion, namely, Maximum Information Minimum Redundancy (MIMR) for evaluation of RGN of upper Bhima basin. The transinformation index obtained from marginal and conditional entropy values, adopting 2-parameter Normal/ Log-Normal (N2 and LN2) distributions are used for evaluation of RGN. The paper presents that the derived network consisting of seventeen raingauge stations with network density of 865 km2 per gauging station is considered as the optimum RGN for upper Bhima basin, which satisfied the WMO recommended value of 600-900 km2 per station.
KEYWORDS: Entropy, Network density, Raingauge, Transinformation index, Optimization
____________________________________________________________________
* Corresponding author
N. Vivekanandan
Assistant Research OfficerCentral Water and Power Research Station, Pune 411024, Maharashtra, India
INTROUDCTION
Monitoring networks established in different river basins collects data on
hydrometeorological parameters such as rainfall, streamflow and stage, water quality, sediment, etc
required for water resources planning, design and management of water resources projects.
Efficient information gathering system should assess the variability in hydrologic processes with
spatial and temporal scales and reduce the costs of data collection1. Network optimization involves
determining optimal monitoring stations and their siting at appropriate locations. This study
exemplifies the use of MIMR theory for evaluation of RGN of upper Bhima basin.
Entropy method quantifies the relative information content for RGN, and has the advantage
that the method needs only rainfall data for evaluation. The method facilitates network design by
quantifying the marginal contribution of each data collection node to the overall information
provided by the network using an index termed as marginal entropy2. The MIMR criterion
maximizes the joint entropy of stations within the optimal set, and the transinformation between
stations within and outside of the optimal set. Meanwhile, it insures that the optimal set contains
minimum duplicated information3. In recent past, entropy method is widely applied by various
researchers for evaluation of different hydrometeorological networks such as streamflow, rainfall,
groundwater, water quality monitoring etc., to derive optimum networks.
Yang and Burn4 applied entropy based approach to design stream gauge network for
Pembina river basin in southern Manitoba, Canada. They have adopted a directional informational
transfer index to identify the most priority station amongst seven stations in the network. Ozkul et
al5 applied the entropy technique for the assessment of water quality monitoring networks for
Mississippi River in Louisiana. They concluded that the concept of entropy is a promising method
as it quantitatively measures the information produced by network, which will improve the
efficiency and cost-effectiveness of current monitoring programs. Markus et al6 applied entropy and
least square methods to evaluate the stream gauging network in the State of Illinois through an
assessment of the transferring of information (transinformation) among gauging records for low,
average, and high flow conditions. They expressed that the hybrid combination of the entropy and
GLS measures of regional value of stations would certainly provide more insight in assessment of
stream gauging program and the station rankings based on the combined method can preserve
correlation with rankings using both entropy and GLS.
Sarlak and Sorman7 applied entropy theory to evaluate the streamflow network for
transinformation index using normal, log-normal and gamma distributions. They also suggested
that the ranking of log-normal distribution could be considered for selection of stream gauge
network for Kizihrmak basin. Yoo et al8 compared the applications of mixed and continuous
distributions in entropy theory to study about the rainfall variability and rainfall intermittency using
transinformation index. Their study showed that the mixed distribution is suitable for evaluation of
rain gauge network for Choongju basin, Korea. Jordan and Jason9 analyzed the application of a
novel, process-oriented stream gauging method for generating rating curves to establish a stream
gauging network in the Whitewater River basin in south central Kansas. They described that the
model was developed for the type of channels typically found in this watershed and designed to
handle deep, narrow geomorphically stable channels with irregular platforms, and can model
overbank flow over a vegetated floodplain. Ridolfi et al10 applied entropy theory to the high density
raingauge network of the urban area of Rome for evaluation of maximum information content
achievable by a rainfall network for different sampling time intervals. In this paper, N2 and LN2
distributions are used for computation of entropy values for the raingauge stations under
consideration. The methodology adopted in computation of entropy measures given by N2 and LN2
for evaluation of RGN of upper Bhima basin is briefly described in the ensuring sections.
METHODOLOGY
The main objective of evaluating a data collection network is to identify the stations that are
producing redundant or repeated information, which can be measured quantitatively by computing
transinformation or the redundancy produced by each station in the network.
Concept of Entropy
A quantitative measure of the uncertainty associated with a probability distribution or the
information content of the distributions termed Shannon entropy11 can be mathematically expressed
as:
) ln(p p k
H(X) ∑ i i … (1)
where H(X) is the entropy corresponding to the random variable X; k is a constant that has value
equal to one, when natural logarithm is taken; and pi represents the probability of ith event of
random variable X.
Marginal Entropy
N
1
i i i
X p ln X p
H(X) … (2)
where p(Xi )is the probability of occurrence of Xi, computed by N2 and LN2 distributions, and N is
the number of observations12. The marginal entropy H(X) indicates the amount of information or
uncertainty that X has. If the variables X and Y are considered as independent, then the joint
entropy [H(X, Y)] is equal to the sum of their marginal entropies defined by:
H(X, Y) = H(X) + H(Y) … (3)
If the variables are stochastically dependent, then the joint entropy is less than its total entropy.
Conditional Entropy
Conditional entropy measures the entropy of a random variable Y, if one has already
learned completely about the random variable X. For given X, the conditional entropy of Y is
defined as:
YX
H
X,Y
H
XH … (4)
Conditional entropy value becomes zero, if the value of one variable is completely determined by
the value of other variable. If the variables are independent then H
YX
H
Y .Transinformation Index
Transinformation index measures the redundant or mutual information between variables,
and is computed from marginal and conditional entropy indices to derive an optimum network.
Transinformation represents the amount of information, which is common to two stochastically
dependent variables X and Y. The transinformation between X and Y is defined as:
T(X, Y) = H(X) + H(Y) - H(X, Y) = H(Y) - H (Y|X) … (5)
For independent X and Y, T(X, Y) = 0. The value of T(X, Y) is also known as transinformation
index13.
Steps Involved in Computation of Entropy Measures
In practice, the existing sampling sites of a RGN can be arranged in the order of information
content. In the ordered list thus obtained, the first station is the one, where the highest uncertainty
about the variable occurs, and the subsequent stations serve to reduce the uncertainty further. The
i) Let the data collection network under review, consists of M monitoring stations. The data
series of the variable of interest at each station (X1,X2,…,XM) is represented by Xij , where
‘i’ denotes the station identification number (i=1, 2,…, M) and ‘j’ is for time period
(j=1,2,…,N). The data length at all stations is assumed to be equal to N. The best fitted
multivariate joint probability density function for the subset (X1, X2,…,XM) of M
monitoring stations is selected.
ii) The marginal entropy of the variable H(Xi) (i=1,2,…,M) for each station is calculated. The
station with the highest marginal entropy is denoted as the first priority station Pr(Xz1).
This is the location, where the highest uncertainty occurs about the variable, and hence
information-gain will be highest from the observations recorded at this site.
iii) This station Pr(Xz1) is coupled with every other (M-1) stations in the network to compute
transinformation T(Xi, Pr(Xz1)) with Xi ≠ Pr(Xz1), i=1, 2,…M; and to select that pair,
which gives the least transinformation. The station that fulfils this condition is marked as
the second priority location Pr (Xz2).
iv) The pair (Pr(Xz1), Pr(Xz2)) is coupled with every other (M-2) station in the network to
select a triplet with the least transinformation T(Xi; Pr(Xz1), Pr(Xz2)). The same procedure
is continued by successively considering combinations of three and more stations, and
selecting the combination that produces the least transinformation. Finally, all M monitoring
stations (X1,X2,…,XM) can be ranked in priority order to get (Pr(Xz1),Pr(Xz2),…,Pr(XzM)).
v) It is possible to terminate the above process early, before carrying out for all M stations by
selecting a particular threshold transinformation value as the amount of redundant
information to be permitted in the network, such that sampling of the variable may be
stopped at the stations that exceed the threshold to get optimum number of stations, which is
less than M.
In the above procedure, the benefits for each combination of sampling sites are measured in terms
of least transinformation or the highest conditional entropy produced by that combination. The
above procedure helps to assess network configurations with respect to the existing stations. If new
stations are to be added to the system, their locations may be selected again on the basis of the
correlation coefficient of each monitoring station can be computed by using Eq. (6) based on
transinformation index.
Transinformation ln
1 R2
21 ) T
( … (6)
Where R represents the multiple correlation coefficient of Xi on Pr(Xz1), Pr(Xz2),…, Pr(XzM).
A
PPLICATION
The methodology detailed above has been applied to evaluate the RGN for upper Bhima
basin upto Ujjani reservoir. The basin is located in the western part of Maharashtra between 18o 03'
N to 19o 24' N latitude and 70o 20' E to 75o 18' E longitude. The geographical area of the basin is
14,712 km2. Of the total geographical area under study, 25 % is hilly and/or highly dissected, 55
% plateau and 20 % is remaining plain area14. From scrutiny of historical rainfall data, it is noted
that twenty-five raingauge stations have concurrent data for the period 1971-2007; and considered
in deriving the optimum RGN for the basin under study.
RESULTS AND DISCUSSIONS
By applying the procedure detailed above, a computer program was developed and used to
compute the transinformation index from marginal and conditional entropy values. The program
identifies the first priority station based on marginal entropy given by N2 and LN2 distributions;
computes the conditional entropy with reference to first priority station; and arranges the raingauge
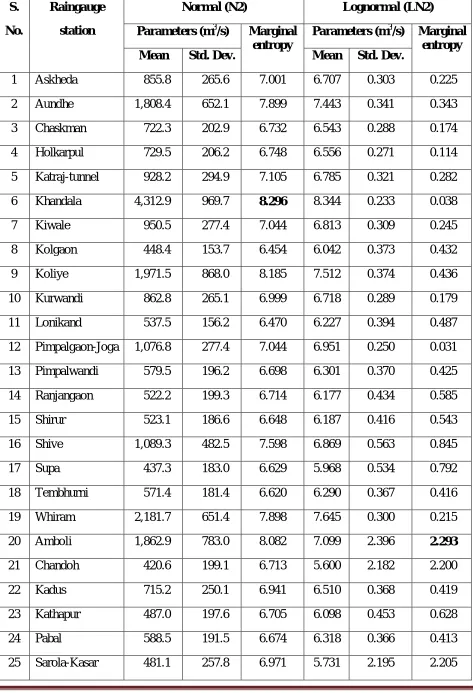
stations in order of priority based on transinformation index. Table 1 gives the model parameters
and marginal entropy values given by N2 and LN2 distributions for twenty-five raingauge stations
considered in the study.
From Table 1, it may be noted that the Khandala station is the first priority station based on
marginal entropy value given by N2 distribution. Also, from Table 1, it may be noted that the
Amboli station is the first priority station based on marginal entropy value, when LN2 is used. The
priority station is coupled with other twenty-four raingauge stations individually to identify the next
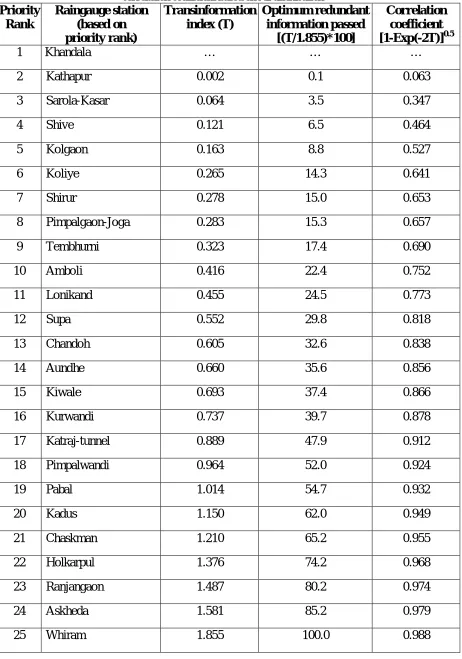
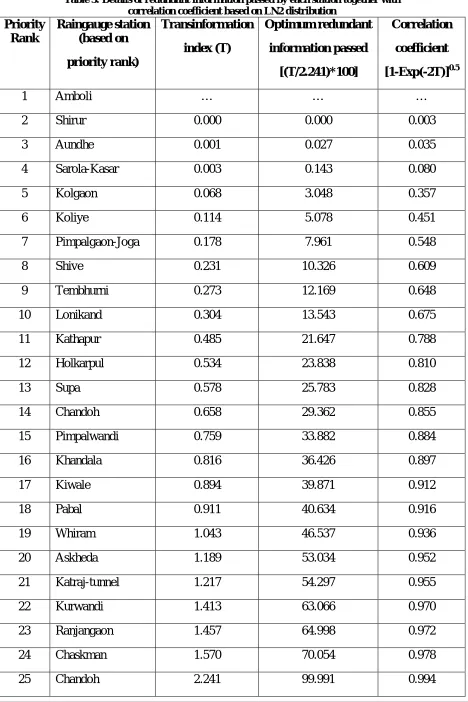
priority station in order and to compute the transinformation index. Tables 2 and 3 give the details
on redundant information passed by each station based on transinformation index and its
Table 1: Parameters and marginal entropy values of raingauge stations given by N2 and LN2 distributions
S.
No.
Raingauge
station
Normal (N2) Lognormal (LN2)
Parameters (m3/s) Marginal entropy
Parameters (m3/s) Marginal entropy
Mean Std. Dev. Mean Std. Dev.
1 Askheda 855.8 265.6 7.001 6.707 0.303 0.225
2 Aundhe 1,808.4 652.1 7.899 7.443 0.341 0.343
3 Chaskman 722.3 202.9 6.732 6.543 0.288 0.174
4 Holkarpul 729.5 206.2 6.748 6.556 0.271 0.114
5 Katraj-tunnel 928.2 294.9 7.105 6.785 0.321 0.282
6 Khandala 4,312.9 969.7 8.296 8.344 0.233 0.038
7 Kiwale 950.5 277.4 7.044 6.813 0.309 0.245
8 Kolgaon 448.4 153.7 6.454 6.042 0.373 0.432
9 Koliye 1,971.5 868.0 8.185 7.512 0.374 0.436
10 Kurwandi 862.8 265.1 6.999 6.718 0.289 0.179
11 Lonikand 537.5 156.2 6.470 6.227 0.394 0.487
12 Pimpalgaon-Joga 1,076.8 277.4 7.044 6.951 0.250 0.031
13 Pimpalwandi 579.5 196.2 6.698 6.301 0.370 0.425
14 Ranjangaon 522.2 199.3 6.714 6.177 0.434 0.585
15 Shirur 523.1 186.6 6.648 6.187 0.416 0.543
16 Shive 1,089.3 482.5 7.598 6.869 0.563 0.845
17 Supa 437.3 183.0 6.629 5.968 0.534 0.792
18 Tembhurni 571.4 181.4 6.620 6.290 0.367 0.416
19 Whiram 2,181.7 651.4 7.898 7.645 0.300 0.215
20 Amboli 1,862.9 783.0 8.082 7.099 2.396 2.293
21 Chandoh 420.6 199.1 6.713 5.600 2.182 2.200
22 Kadus 715.2 250.1 6.941 6.510 0.368 0.419
23 Kathapur 487.0 197.6 6.705 6.098 0.453 0.628
24 Pabal 588.5 191.5 6.674 6.318 0.366 0.413
Table 2: Details of redundant information passed by each station together with correlation coefficient based on N2 distribution
Priority Rank
Raingauge station (based on priority rank)
Transinformation index (T)
Optimum redundant information passed
[(T/1.855)*100]
Correlation coefficient [1-Exp(-2T)]0.5
1 Khandala … … …
2 Kathapur 0.002 0.1 0.063
3 Sarola-Kasar 0.064 3.5 0.347
4 Shive 0.121 6.5 0.464
5 Kolgaon 0.163 8.8 0.527
6 Koliye 0.265 14.3 0.641
7 Shirur 0.278 15.0 0.653
8 Pimpalgaon-Joga 0.283 15.3 0.657
9 Tembhurni 0.323 17.4 0.690
10 Amboli 0.416 22.4 0.752
11 Lonikand 0.455 24.5 0.773
12 Supa 0.552 29.8 0.818
13 Chandoh 0.605 32.6 0.838
14 Aundhe 0.660 35.6 0.856
15 Kiwale 0.693 37.4 0.866
16 Kurwandi 0.737 39.7 0.878
17 Katraj-tunnel 0.889 47.9 0.912
18 Pimpalwandi 0.964 52.0 0.924
19 Pabal 1.014 54.7 0.932
20 Kadus 1.150 62.0 0.949
21 Chaskman 1.210 65.2 0.955
22 Holkarpul 1.376 74.2 0.968
23 Ranjangaon 1.487 80.2 0.974
24 Askheda 1.581 85.2 0.979
Table 3: Details of redundant information passed by each station together with correlation coefficient based on LN2 distribution
Priority Rank
Raingauge station (based on
priority rank)
Transinformation
index (T)
Optimum redundant
information passed
[(T/2.241)*100]
Correlation
coefficient
[1-Exp(-2T)]0.5
1 Amboli … … …
2 Shirur 0.000 0.000 0.003
3 Aundhe 0.001 0.027 0.035
4 Sarola-Kasar 0.003 0.143 0.080
5 Kolgaon 0.068 3.048 0.357
6 Koliye 0.114 5.078 0.451
7 Pimpalgaon-Joga 0.178 7.961 0.548
8 Shive 0.231 10.326 0.609
9 Tembhurni 0.273 12.169 0.648
10 Lonikand 0.304 13.543 0.675
11 Kathapur 0.485 21.647 0.788
12 Holkarpul 0.534 23.838 0.810
13 Supa 0.578 25.783 0.828
14 Chandoh 0.658 29.362 0.855
15 Pimpalwandi 0.759 33.882 0.884
16 Khandala 0.816 36.426 0.897
17 Kiwale 0.894 39.871 0.912
18 Pabal 0.911 40.634 0.916
19 Whiram 1.043 46.537 0.936
20 Askheda 1.189 53.034 0.952
21 Katraj-tunnel 1.217 54.297 0.955
22 Kurwandi 1.413 63.066 0.970
23 Ranjangaon 1.457 64.998 0.972
24 Chaskman 1.570 70.054 0.978
From Tables 2 and 3, it may be noted that Whiram and Chandoh stations provide about
100% redundant information based on transinformation index given by N2 and LN2 respectively;
and considered as the reference station for computation of redundant information for other stations.
Also, from Table 2, it may be noted that Kadus, Chaskman, Holkarpul, Ranjangaon and Askheda
raingauge stations are providing more than 60% redundant information in addition to Whiram.
From Table 3, it may be noted that Kurwandi, Ranjangaon and Chaskman raingauge stations are
providing more than 60% redundant information in addition to Chandoh.
Based on MIMR criterion, it is identified that the raingauge stations such as Askheda,
Chandoh, Chaskman, Kadus, Kurwandi, Holkarpul, Ranjangaon and Whiram are providing more
than 60% redundancy, indicating possible discontinuation from the existing RGN in the basin. The
study showed that the derived network consists of seventeen raingauge stations with 865 km2 per
gauging station are considered as the optimum RGN for the basin, which satisfies the WMO15
recommended value of 600-900 km2 per station for minimum density of raingauge network. The
results are expected to be of assistance to stakeholders for decision making as regards RGN
optimisation in the Upper Bhima basin.
CONCLUSIONS
This paper presented an of entropy theory-based criterion of MIMR for evaluation of RGN
of upper Bhima basin consisting of twenty-five raingauge stations. The study described that N2 and
LN2 distributions are used to represent the data and then to compute the marginal and conditional
entropy indices and the transinformation index. The results showed that Khandala and Amboli
stations are the first priority stations with highest marginal entropy for upper Bhima basin, when
N2 and LN2 are used. The results also showed that Whiram and Chandoh stations provided about
100% redundant information and hence considered as the reference station for computation of
redundant information passed by other stations. From the results of transinformation index given by
N2 and LN2 distributions, it may be noted that the amount of redundant information given by
Askheda, Chandoh, Chaskman, Kadus, Kurwandi, Holkarpul, Ranjangaon and Whiram raingauge
stations are more than 60%, proposed for possible discontinuation of the stations from the core
network while optimizing RGN of upper Bhima basin upto Ujjani reservoir. Thus, the derived
optimum network for Upper Bhima basin consists of seventeen stations with network density of
865 km2 per gauging station satisfying the WMO recommended value of 600-900 km2 per station.
The results are expected to be of assistance to stakeholders for decision making as regards network
ACKNOWLEDGEMENTS
The authors are grateful to Dr. I.D. Gupta, Director, Central Water and Power Research
Station, Pune, for his continuous encouragement and giving permission to publish this paper. Kind
co-operation extended by Shri S. Govindan, Additional Director, is gratefully acknowledged. The
authors are thankful to the Executive Engineer, Hydrometeorological Data Processing Division,
Nashik, for making available the rainfall data of Upper Bhima basin.
REFERENCES
1) Richard SP. Review and analysis of stream gauge network for the Ontario stream gauge
rehabilitation project. 2004; WSC Report No. 01-2004; 96.
2) Mogheir Y and Singh VP. Application of information theory to groundwater quality
monitoring networks. Water Resources Management. 2002; 16(1):37-49
3) Maruyama T, Kawachi T and Singh VP. Entropy-based assessment and clustering of potential
water resources availability. Journal of Hydrology. 2005; 309 (1-4):104-113.
4) Yang Y and Burn DH. An entropy approach to data collection network design. Journal of
Hydrology. 1994; 157(4): 307-324.
5) Ozkul S, Harmanucioglu NB and Singh VP. Entropy based assessment of water quality
monitoring networks. Journal of Hydrologic Engineering. 2000; 5(1):90-99.
6) Markus M, Knapp HV and Tasker GD. Entropy and generalized lease square methods in
assessment of the regional value of stream gauges. Journal of Hydrology. 2003; 1(2):107-121.
7) Sarlak N and Sorman UA. Evaluation and selection of stream flow network stations using
entropy methods. Turkey Journal of Engineering and Environmental Science. 2006; 30
(2):91-100.
8) Yoo C, Jung K and Lee J. Evaluation of rain gauge network using entropy theory:
Comparison of mixed and continuous distribution function applications. ASCE Journal of
Hydrologic Engineering. 2008; 13(4):226-235.
9) Jordan AC and Jason WK. Establishing a multi-scale stream gauging network in the
Whitewater river basin, Kansas, USA. Water Resources Management. 2010; 13:3641-3664.
10) Ridolfi E, Montesarchio V, Russo F and Napolitano F. An entropy approach for evaluating
the maximum information content achievable by an urban rainfall network. Natural Hazards
and Earth System Sciences. 2011; 11(7):2075–2083.
11) Shannon CE. A mathematical theory of communication. The Bell System Technical Journal.
south-western region of Saudi Arabia. Journal of Hydrology. 1998; 205 (3-4):205-216.
13) Chao Li, Singh VP and Mishra AK. Entropy theory-based criterion for hydrometric network
evaluation and design: Maximum information minimum redundancy. Water Resources
Research. doi:10.1029/2011WR011251. 2012; 48: 15.
14) Government of Maharashtra. Report of the Maharashtra water and irrigation commission,
1999; 5.
15) World Meteorological Organization (WMO). Guide to Hydrological Practices. Geneva Report
No. 168, 1994.