IJEDR1702286 International Journal of Engineering Development and Research (www.ijedr.org) 1824
Modeling of Spatial and Temporal Variation in
Nitrate-Nitrogen Concentration of Upper Lake Bhopal Using
Best Subset Procedure
1
Shubham Agarwal and
2Harsangeet Kaur
1P.G. Research Scholar, 2Associate Professor
1,2Department of civ il engineering
1,2 Maulana Azad National Institute of Technology, Bhopal
Abstract- Upper B hopal Lake, the l argest water lake in M.P., India is loc ate d in the he art of Bhopal town . A number of water channels enter the lake from the human settleme nts around the l ake and discharge pollute d water in the lake bringing several chemic al as well as sedi ments load in the l ake. Eutrophication is one of the major pr oble ms in some par t of the lake. Water quality may bec ome so degrade d that t he lake’s original use are lost. Nitr ogen is the limi ting nutrients responsible for eutrophic ation of the lake. The physico-che mic al status of Upper Lake (Bhopal, Indi a) has been i nvestigate d during the ye ar 2011-2015. Nitrate is the impor tant nutrient in the l ake loadi ng through point and non -point pollution sources such as agricultural ac ti vities, domestic raw se wage, atmospheric preci pitati on and r unoff.This nutrient support the fast growth of the aquatic plants as a result these pl ants lead to gr adual shrinking of we tland are a along wi th other complic ations like low light pe netr ati on, re duces oxygen c oncentration, cl ogging of water c hannels and l owers enter tainme nt value of lake.
In the present study, Best subset pr oce dure based on R2 and F val ues is us ed i n model for pre dicting the Nitrate
concentration.Regression model are de vel ope d in e xpl aining variation in nitr ate c oncentration using routinel y me asure d par ameters. The pre dic te d value of nitrate is compare d with obser ve d values and re asonably good matc hing is obtaine d. Further , efficiency of the de vel ope d model was teste d by error esti mation using correlati on statistics, standar d error , t-testand ANOVA test. The de vel ope d model may be used for pre diction of missing obser ve d val ues of Nitr ate concentr ati on.
Keywords- Water quality parameters, Regression, Best subset, Nitrate modeling , Upper Bhopal Lake
I. INTRODUCTION
Nitrate and phosphate are twoimportant constituents that immensely help inthe growth of the plants where they present. Ifthey are present in la ke and ponds they areexcessively pro mote the growth of aquaticweeds and polluting our aquatic resources.International studies on the nitrates in the surface waters of variousbodies of water have expres sed their concernand drawn the attention of scientists around theglobe. This constituent is immensely helpin the growth of the macrophytes like waterhyacinth (Eichhornia crassipes ) which is themost troublesome aquatic weed in the wo rld.The ma jor sources of nitrate in la kes and pondsare fro m the catchment area by rainfall, sewageeffluents, suspended organicmatter and agriculture runoff. When algae and other suspended microorganis msdie and settle down to the bottom; they carry nit rogen withthem, during decomposition. This n itrogen isreleased and becomes available fo r subsequentgrowth of aquatic biota (Singh, 1987).
Both modeling and monitoring are useful in attempting to ascertain a lake’s response to Nitrogen loading fro m develo pment. Monitoring provide present condition but is e xpensive, time consuming as lakes e xh ibit high variability in terms of alga l response and nutrients concentration on both an annual and seasonal basis. Therefore there is a need to provide a cost effective alternative which can help to protect the water quality of la kes. Modeling provides such an alternative to interpretate data with prediction for the future. Statistical models a re developed for estimat ion of concentration of diffe rent water quality constituents using routinely -mo nitored water quality para mete rs. The best subset modeling procedure enables co mparison between full mode ls to subset models. Best subset procedure based on R2 and F values can be used in model format ion.
Sharma and Ja in (2008) developed statistical models to estimate Phosphate concentration in upper la ke of Bhopal c ity. Best subset procedure based on R2 and F values was used in model formu lation. It was found that potassium, fluoride, Secchi depth, pH, BOD and magnesiu m could be used as surrogate parameters fo r the predict ion of phosphate and these parameters successfully e xp la ined 7 7.8 % variation in Phosphate concentration.
Phosphorous concentration = 0.088 + 0.040K - 0.512F - 0.033SD - 0.011Mg + 0.024pH + 0.007BOD
IJEDR1702286 International Journal of Engineering Development and Research (www.ijedr.org) 1825 Pathak et a l. (2012)studied about the impact of e xcess nutrients status in lake water ecosystem, they analyzed water sample for 26 water quality para meters fro m six sampling stations of sagar lake o f sagar city (M.P.); regression ana lysis and mult iple linear regression for total data point we re carried out using SPSS 11.0 software, M LR method was used to evaluate relationship betwe en dissolved oxygen & a mong other water quality para meters (Turb idity, BOD, p H, PO4, NO3, F, Fe , A mmN) which have sig nificant and separate effect on the dependent variable. Result have shown that the sagar lake contain high concentration of nitrate an d phosphate, which led to quic k growth of algae and as well as death plants.
Salee m et al. (2012)developed a regression model for physic-chemica l quality of ground water of Gu lbarga-India; they tested water quality para meters for 150 bore we ll water samp le & developed a regression for nitrate by using SPSS software as ana lytic to o l; they revealed that 70% variat ion in nit rate by Na+ & Ca ++.
In the present investigation, an attempt has been made to develop statistical model to predict Nitrate concentration using ro utinely monitored water quality para meters of upper lake, Bhopal (India ) by the analytical tool SPSS (statistical package fo r the social science).
II. MATERIALS AND METHODS
The Upper Lake Bhopal has been selectedfor present investigation. This lake is an east westerly e longated shallow lake with irregular margins.Catchment area o f the upper Lake Bhopal is about 372 km2. Upper La ke is 10.6 km wh ile the width comes out to be 3.25 Km and the depth varies fro m 4 to 8 Meters. In order to develop the models detailed information is required on water qua lity parameters of upper La ke of Bhopal.The physico chemica l ana lysis data of water samp les collected in a month of years 2011-2015 fro m va rious locations of upper Lake Bhopal. State research laboratory-Bhopal analy zed various water quality para meters of upper lake like Te mpe rature, turbidity, total solid (TS), dissolved solid (DS), suspended solid (SS), sulphate (SO4), chloride (Cl), dissolved oxygen(DO), biochemica l o xygen de mand(BOD), che mical o xygen de mand(COD), p H, Alka lin ity (A), total hardness (TH), Ca-hardness, Mg Ca-hardness, potassium (K), magnesium (Mg), sodium (Na) and total colifo rm at various location of upper la ke name ly Yatch club, ka mla park, Ka rbala, Ba iragarh and Khanugaon. These secondary collected data was used for the statistical analysis. The best subset analysis was carried out for full data sets. SPSS 22.0 was used for carrying out the analysis.
For mul ation of regression model
The general representation of statistical models is given by
Yi=∑kj=0βjxij+e
With xi0= 1;
Where xij is the independent variable for theith observation (various water quality constituents), Yi is the dependent variable fo r the ith observation, βj are the unknown coefficients to be estimated, k+1 are nu mber o f coeffic ients to be estimated in the model and e is the error in the determination of Yi wh ich is generally assumed as having zero mean and constant standard deviation.
Before ca rry ing out a statistical regression of the data set, preliminary analysis of data was done. This consists of initial filt ration of data, partial visual inspection of data files and the creation of the scatters plots. Once the indentified input errors were re moved, a general regression analysis between independent variables and dependent variable is formed. Re lation between any t wo variable is e xpla ined by coefficient, co mmonly known as correlation coefficient (r), wh ich describe the re lation between the t wo va riables. Square of correlat ion coeffic ient (R2) indicate the contribution of independent parameter in e xp la ining the variation in the dependent variables.Model is useful for the predictive purpose if it include many independent variables, so that reliable fitted value can be determined. We obviously want R2 to be la rge, since R2 g ives the proportion of variation in the dependent variables; that is e xplained by the fitted regression model. On the other hand, because of the effort involved in the monitoring of a large number of independ ent variables, there is interest in include few independent variables. There is no unique statistical procedure for doing this (D ra per and smith 1981). Ho wever many worker has suggested diffe rent statistical approach, such as all possible regression, backwa rd elimination, forward e limination in stepwise regression, principa l co mponent regression and stage wise regression which may h elp in optimu m model formu lation (Draper and s mith 1981; We isberg, 1980). In the present case the best subset regression approach has been used to select the best set of independent variables.
Best subset regression
IJEDR1702286 International Journal of Engineering Development and Research (www.ijedr.org) 1826 For formu lation of mode l first we need to work on statistical analysis on water quality para meters. This statistical analysis has been performed using SPSS 22.0 version software package of IBM was used for e xecuting both correlation and regression analysis in order to investigate and study relationship between two or more para meters, by calculating corre lation coefficients between differe nt p airs of para meters.
The correlation coeffic ient (r) measures the degree of association that exists between two variables, one taken as dependent variable and other is taken as independent variable. The greater the value o f regression coefficient, the better is the fit and more u seful the regression variables. Corre lation is the mutual re lationship between two variables. Direct correla t ion e xists when increase or decrease in the value of one parameter is associated with a corresponding increase or decrease in the value of other parame ter (K. Jothivenkatachalam, 2010).
III. RES ULT AND DISCUSS ION
Correlation analysis for Nitrate-Nitroge n
Regression analysis was conducted to investigate the individual relat ionship between Nitrate -Nitrogen and other physico-chemica l properties. SPSS ana lytical tool used to carried out the corre lation studies for Nitrate – Nitrogen, in which Nitrate-Nitrogen considered as dependent variable and other water quality para meters na me ly Turb idity, Total solid, pH, Dissolved solid (DS), suspended solid (SS), Dissolved oxygen (DO), Bio-che mica l o xygen de mand(BOD), potassium (K), sodiu m (Na ), magnesium (Mg), alkalin ity (A), calciu m (Ca) and phosphate (PO4) considered as independent variables. Total 124 observations (from April 2011 to March 2016) were used in this analysis.
Table 1: Indi vi dual c ontri buti ons of vari ous inde pende nt che mical vari ables to pre dic t Nitrate -Nitr ogen
De pendent
vari able
Inde pe ndent
vari able
Coe fficient of c orrelati on
(r)
Coe fficient of vari ation (R2) Vari ance
ratio(F)
NO3-N turbidity 0.109 0.012 1.218
NO3-N pH 0.064 0.004 0.501
NO3-N TS .433 .188 28.225
NO3-N DS .434 .188 28.269
NO3-N SS .116 .013 1.66
NO3-N PO4 .173 .03 2.574
NO3-N AmmN .143 .020 1.587
NO3-N NO2-N .226 .051 6.305
NO3-N DO .119 .014 1.643
NO3-N BOD .072 .005 0.602
NO3-N K 0.031 .001 .088
NO3-N Na .185 .034 .034
NO3-N Ca .347 .121 16.202
NO3-N Mg .261 .068 8.650
Selection of inde pende nt variables
IJEDR1702286 International Journal of Engineering Development and Research (www.ijedr.org) 1827 value. There is a co mpro mise between the two criteria. The decision can be made on the basis of the value o f F statistics as explained by Weisberg (1980).
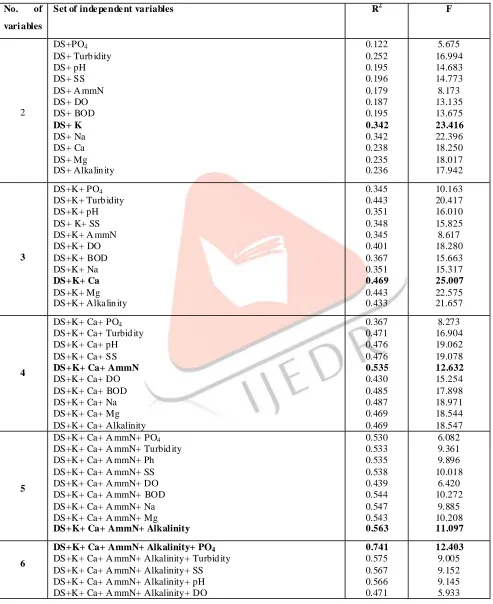
Table 2: various c ombinati on of model wi th their statistics
No. of
vari ables
Set of inde pe nde nt variables R2 F
2
DS+PO4 DS+ Turb idity DS+ pH DS+ SS DS+ A mmN DS+ DO DS+ BOD DS+ K DS+ Na DS+ Ca DS+ Mg DS+ Alka lin ity
0.122 0.252 0.195 0.196 0.179 0.187 0.195 0.342 0.342 0.238 0.235 0.236 5.675 16.994 14.683 14.773 8.173 13.135 13.675 23.416 22.396 18.250 18.017 17.942 3 DS+K+ PO4 DS+K+ Turb idity DS+K+ pH DS+ K+ SS DS+K+ A mmN DS+K+ DO DS+K+ BOD DS+K+ Na DS+K+ Ca DS+K+ Mg DS+K+ Alka lin ity
0.345 0.443 0.351 0.348 0.345 0.401 0.367 0.351 0.469 0.443 0.433 10.163 20.417 16.010 15.825 8.617 18.280 15.663 15.317 25.007 22.575 21.657 4
DS+K+ Ca+ PO4 DS+K+ Ca+ Turbid ity DS+K+ Ca+ pH DS+K+ Ca+ SS DS+K+ Ca+ AmmN DS+K+ Ca+ DO DS+K+ Ca+ BOD DS+K+ Ca+ Na DS+K+ Ca+ Mg DS+K+ Ca+ Alkalinity
0.367 0.471 0.476 0.476 0.535 0.430 0.485 0.487 0.469 0.469 8.273 16.904 19.062 19.078 12.632 15.254 17.898 18.971 18.544 18.547 5
DS+K+ Ca+ A mmN+ PO4 DS+K+ Ca+ A mmN+ Turbid ity DS+K+ Ca+ A mmN+ Ph DS+K+ Ca+ A mmN+ SS DS+K+ Ca+ A mmN+ DO DS+K+ Ca+ A mmN+ BOD DS+K+ Ca+ A mmN+ Na DS+K+ Ca+ A mmN+ Mg DS+K+ Ca+ AmmN+ Alkalinity
0.530 0.533 0.535 0.538 0.439 0.544 0.547 0.543 0.563 6.082 9.361 9.896 10.018 6.420 10.272 9.885 10.208 11.097 6
DS+K+ Ca+ AmmN+ Alkalinity+ PO4
DS+K+ Ca+ A mmN+ Alkalinity+ Turbid ity DS+K+ Ca+ A mmN+ Alkalinity+ SS DS+K+ Ca+ A mmN+ Alkalinity+ pH DS+K+ Ca+ A mmN+ Alkalinity+ DO
IJEDR1702286 International Journal of Engineering Development and Research (www.ijedr.org) 1828 DS+K+ Ca+ A mmN+ Alkalinity+ BOD
DS+K+ Ca+ A mmN+ Alkalinity+ Na DS+K+ Ca+ A mmN+ Alkalinity+ Mg
0.569 0.565 0.582
9.240 8.603 9.765
7
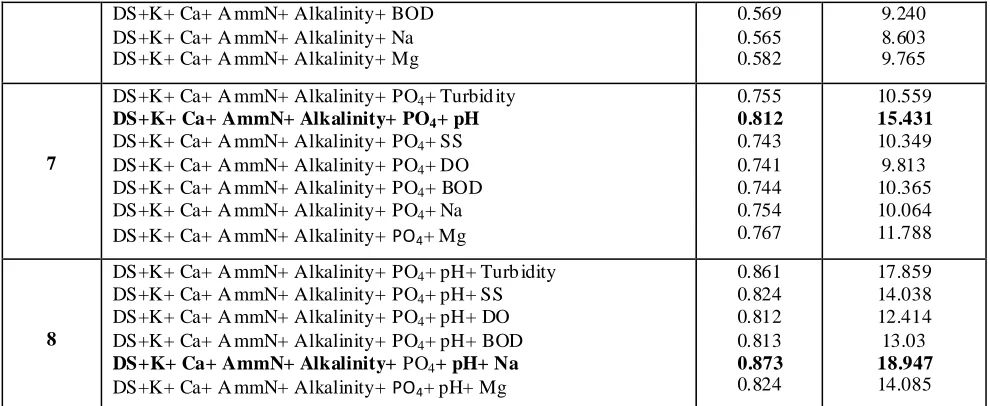
DS+K+ Ca+ A mmN+ Alkalinity+ PO4+ Turbid ity
DS+K+ Ca+ AmmN+ Alkalinity+ PO4+ pH
DS+K+ Ca+ A mmN+ Alkalinity+ PO4+ SS DS+K+ Ca+ A mmN+ Alkalinity+ PO4+ DO DS+K+ Ca+ A mmN+ Alkalinity+ PO4+ BOD DS+K+ Ca+ A mmN+ Alkalinity+ PO4+ Na DS+K+ Ca+ A mmN+ Alkalinity+ PO4+ Mg
0.755 0.812 0.743 0.741 0.744 0.754 0.767
10.559 15.431 10.349
9.813 10.365 10.064 11.788
8
DS+K+ Ca+ A mmN+ Alkalinity+ PO4+ pH+ Turb idity DS+K+ Ca+ A mmN+ Alkalinity+ PO4+ pH+ SS DS+K+ Ca+ A mmN+ Alkalinity+ PO4+ pH+ DO DS+K+ Ca+ A mmN+ Alkalinity+ PO4+ pH+ BOD
DS+K+ Ca+ AmmN+ Alkalinity+ PO4+ pH+ Na
DS+K+ Ca+ A mmN+ Alkalinity+ PO4+ pH+ Mg
0.861 0.824 0.812 0.813 0.873 0.824
17.859 14.038 12.414 13.03 18.947 14.085
Table 3: selecte d subset of inde pe nde nt variables for possible model de velopme nt
No. of Vari able
Set of Inde pendent Variable n R2 F
8 DS+K+ Ca+ A mmN+ Alkalinity+ PO4+ pH+ Na 124 0.873 18.947
7 DS+K+ Ca+ A mmN+ Alkalinity+ PO4+ pH 124 0.812 15.431
6 DS+K+ Ca+ A mmN+ Alkalinity+ PO4 124 0.741 12.403
5 DS+K+ Ca+ A mmN+ Alkalinity 124 0.563 11.097
4 DS+K+ Ca+ A mmN 124 0.535 12.632
3 DS+K+ Ca 124 0.469 25.007
2 DS+K 124 0.342 23.416
1 DS 124 0.188 28.269
Model Result
As the regression analysis applied on the values entered in SPSS software and result are shown in table 5. We developed linear model for Nitrate-N using mult iple linear regression with the value of R2 is 87.3 % (87.3 percent variation in Nitrate-N concentration is e xpla ined by selected independent variables) as shown in Table 4. Tab le shows the result of M LR for Nit rate-N, in which Coe fficient part of the output gives us the values that we need in order to write the regression equation. So model eq uation of predictive model for Nitrate-N is given below-
NO3-N = -34.543 + 0.024 DS – 0.054K + 0.124 Ca- 2.976 AmmN + 0.044 Alkalinity + 2.386 PO4+ 2.730 pH + 0.011 Na Eq. (1)
Water qualities para meters a re of great significance to e xp la ining the variation in concentration of Nitrate-N.variation in Nitrate concentration is exp lained by the DS, K, Ca, A mmN, Alkalinity, PO4, pH and Na wh ile other 12.3 % is influenced by other factorsThree parameters Dissolved solid (DS), Potassium (K) and Ca lciu m (Ca) e xpla in the nearly 47% variation in Nitrate concentration.
Table 4: Model summary for Ni trate-N linear model wi th ANOVA result
R-S quare d Adj. R-S quare d F Significance
0.873 0.827 18.647 0.000
IJEDR1702286 International Journal of Engineering Development and Research (www.ijedr.org) 1829 Table 5: Result of statistics for model par ameters
Model Par ame ters Coe fficient Standar d error t-stat p-value
Constant -34.543 5.949 -5.723 .000
DS 0.024 .004 6.629 .000
K -0.054 0.038 -1.424 .048
Ca .124 .031 4.022 .001
AmmN -2.976 .484 -6.144 .000
Alka lin ity .044 .006 6.849 .000
PO4 2.386 .510 4.676 .000
pH 2.730 .600 4.552 .000
Na .011 .039 .275 .036
Model Perfor mance
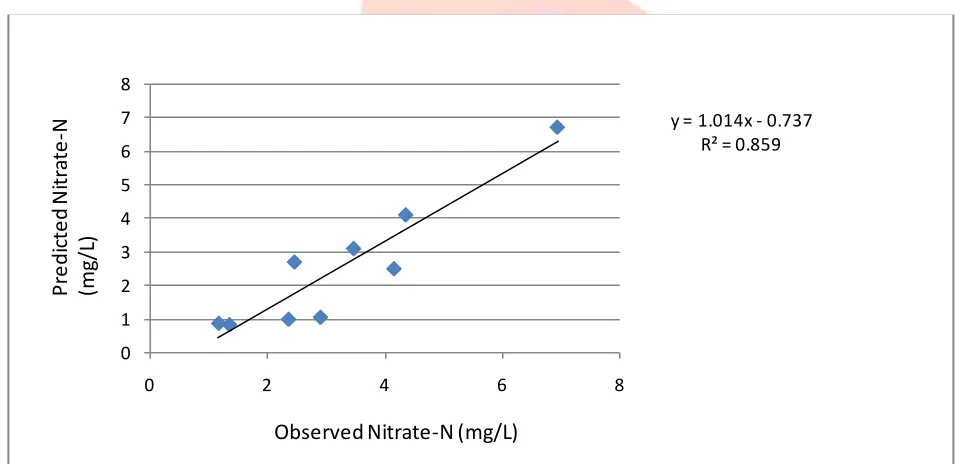
The performance of the model has been tested using standard error, corre lation coeffic ient, ANOVA test and T -test. For this first we need to determine the predictive values of Nitrate-N by using the model equation given in equation (1). For validation of the above model, the physico-chemical data of the month ofOctober 2016 was used. It can be seen that the statistical models developed in this study perform we ll in co mputing the Nitrate-N concentration for the lake. The Nitrate-Nitrogen (NO3-N) value obtained by the developed regression model indicates statistically significant regression.Scatter plot between actual Nitrate-N and Pred icted Nitrate-N is shown in Fig.1 with the R2 va lue of 0.859 which suggest good agreement in observed and predicted Nit rate -N concentration for the lake .
Fig. 1: scatter plot be twee n actual (obser ve d) NO3-N with pre dic te d NO3-N c oncentration for l ake
Standard error has been determined using the follo wing equation N
SE= [∑ (KP-KM)2 ]
i=1 N
Where N is the numbe r of observation and KP and KM are the pred icted and measured values. The SE va lue was found to be very lo w 0.83 for the year 2016. Low value of standard error indicates that the data points tend to be close to the mean or deviation o f residual value is not too much fro m each other. Residual is the diffe rence between the observed value and the estimated value.
y = 1.014x - 0.737 R² = 0.859
0 1 2 3 4 5 6 7 8
0 2 4 6 8
Observed Nitrate-N (mg/L)
P
re
d
ic
te
d
N
itr
ate
-N
(mg
/L
IJEDR1702286 International Journal of Engineering Development and Research (www.ijedr.org) 1830 IV. CONCLUS ION
The statistical model developed in this study is successfully e xp lain ing the 87.8 % variation in Nitrate -Nit rogen concentration. R- square value obtained for the developed linear predict ion model for Nitrate is 87.3 %; this shows that of the variation in Nitrate concentration is e xp la ined by the variation in DS, K, Ca , A mmN, A lka linity, PO4, pH and Na wh ile other 12.3 % is influenced by other factors. Potassium is present in plant materia l and is lost fro m agriculture soil by c rop harvesting i n the surrounding area of the la ke, both K and Phosphorous used in NPK fertilizer with ratio of 16:4:8 which re moval and le aching resulting Eutrophication of lake . Ca used in fertilizer as macro nutrient so it also influences the amount of nitrogen by made organic compound Ca (NO2). Ammoniu m based fertilizer used in agriculture fie ld which also resulting into Eutrophication. Alkalinity comes fro m a lkali wh ich re fers to ionic co mpounds (salts) containing alka li meta l or alka line ea rth metal ele ments (Na or K), these alkali meta l made compound with Nitrate after co mbination that is sodium Nit rate (Na NO3) and Potassium Nitrate (KNO3). As the lake becomes enriched in anthropogenic CO2, the resulting decrease in pH could lead to decreasing rates of nitrification (A mmoniu m compound converted into Nitrate). The performance of the model was tested by standard error test which is found very low and correlation coeffic ient analysis which is describes good correlation between actual and predicted value of nitrate concentrat ion. The developed model may be used for the prediction of missing observed value of Nitrate -Nitrogen concentration in upper Lake Bhopal.
ACKNOWLEDGEMENT
We highly indebted to my pra iseworthy supervisor Prof. Ha rsangeet Kaur (Associate Professor) Depart ment of Civ il Engineering MANIIT Bhopal for her prec ious guidance, intellectual stimulation continuing and sustained encouragement, untirin g help and his unflinching interest with great love and affection throughout the present paper.
REFERENCES
Draper, N. R. and Smith, H. (1981), Applied regression analysis, Second edition, John Wiley and Sons, New York
Jothi ve nkatachal am, K., Nithya, A., and Chandra Mohan, S. (2010). ―Correlation analysis of drin king water quality in and around
Perur b lock of Coimbatore District, Ta mil Nadu, India‖ Rasayan Journal Che mistry, 3(4), pp 649654.
Muniz, K., Cruzado, A. and De Villa, C.R., (2001). Statistical analysis of nutrient data quality (nitrate and phosphate), applied to
useful predictor models in the northwestern Mediterranean Sea. BOLETIN-INSTITUTO ESPA NOL DEOCEA NOGRAFIA, 17(3/ 4), pp.221-232
Official we bsite of statistics solution available on http://www.statisticssolutions.com
Pathak, H., (2012). Evaluation of ground water quality using mult iple linear regression and mathemat ical equation modeling, Annals
of the University of Oradea—Geography Series, 2, pp.304-307
Saleem, A., Dandigi, M.N. and Ku ma r, K.V. (2012). Co rre lation -regression model for Physico-chemical quality of groundwater in
the South Indian city of Gulbarga, African Journal of Environ mental Science and Technology, 6(9), pp.353-364
Shar ma, M.K., Choubey, V.K. and Dwivedi, V.K., (2007). Phosphorous Modeling of Upper Bhopal La ke Using Best Subset
Procedure in Proceedings of Taal2007: The 12th World La ke Conference (Vol. 851, p. 856)
Singh R. and Mahajan I. (1987) : Phytoplankton & water che mistry of Ra walsar & Renuka lake . H.P. India. J. Ecol. 14(2): 273 -277.