DOI: https://doi.org/10.30880/ijie.2018.10.04.003
Effect of Computerized Maintenance Management System on
a Cement Production Plant
Olayide R Adetunji
1, Samuel M Owolabi
1, Olanrewaju M Adesusi
1*, Olawale U
Dairo
2, Samuel O Ipadeola
1and Stella O Taiwo
31Mechanical Engineering Department, Federal University of Agriculture, Abeokuta, Nigeria.
2Agricultural and Bio-resources Engineering Department, Federal University of Agriculture, Abeokuta, Nigeria. 3
Mechanical Engineering Department, Yaba College of Technology, Yaba, Lagos, Nigeria.
Received 1 February 2018; accepted 9 July 2018, available online 5 August 2018
1. Introduction
The cost of raw materials and energy are generally consistent within a given area or region and the only key differentiator among competitors is the ability to control costs while making high-quality products [1]. An improvement in the effectiveness of maintenance management process serves as a role player in cost control in this regard.
Ensuring that best practices for maintenance management are employed, the company’s Cement division has been upgrading its enterprise asset management (EAM) software solution for 15 years and is expanding adoption to 126 plants in 47 countries [1]. Through EAM software, it shares and supports best practices in 126 plants.
Maintenance expenditures make up about 15 to 60 percentage of production costs, depending on the specific industry [2]. The impact of maintenance functions on asset availability is achievable by minimizing downtime associated with maintenance [3]. High productivity in modern cement plant is extremely dependent on effective maintenance manufacturing system and companies have tried to use standard production methods to control maintenance, which has proved impossible [4].
Therefore, improving maintenance effectiveness is a potential source for making financial savings [5].
Maintenance is a business function which serves and supports the primary process in an organization [6]. Shafeek [4] researched on maintenance practices in Cement industries where he mentioned that high productivity at the modern cement plant is highly dependent on regular, scheduled maintenance. In a bid to optimize maintenance decision making process, some authors [7], [8] have implemented multi-criteria decision techniques. Amin et al. [9] introduced optimized maintenance management system which led to maintenance cost reduction in a cement manufacturing plant. The use of CMMS has attracted so much attention owning to the fact that enormous amount of maintenance data need to be analyzed fast and efficiently in order that decisions are reached [10]. Šlaichová and Maršíková [11] reported on the effect of implementing a Computerized Maintenance Management System (CMMS) on the efficiency of production facilities. It was discovered that great improvement was achieved in the facilities Key Performance Indices (KPI) by the implementation. Organizations use KPI to reveal how successful they are in accomplishing long lasting financial and non-financial goals [12]. Ogbo et al. [13] correlated CMMS adoption in
Abstract: Computerized Maintenance Management System (CMMS) is a tool tailored to support maintenance business functions of production systems. Market available CMMS software programs seldom meet the needs of each organization’s peculiar maintenance functions. Therefore, this work investigated the effects of CMMS on a cement production plant. The materials used included a Computer and Networking system and maintenance software. Preliminary study via interview among the relevant maintenance staff members of the plant was conducted to identify critical plant assets. Critical assets considered under this study are Limestone Crusher (LC), Cement Mill (CM) and Kiln (KI) among others identified. Key Performance Indicators (KPIs) such as Plant Reliability Factor (RF), Number of Stoppages for Incidents (NSI) and Production Losses (PL) were used as basis for the evaluation which covered period from year 2013 to 2015. The result obtained from this implementation showed that RF for LC, CM and KI were 46, 76, 86; 51, 79, 88; 59, 88, 92 in 2013, 2014 and 2015 respectively. The corresponding NSI for the three plant assets were 824, 472, 82; 788, 462, 56; 431, 420, 46 in 2013, 2014 and 2015 respectively. The Production Losses for the plant were $22.54m, $21.587m and $19.365m in 2013, 2014 and 2015 respectively. KPIs showed improvement in the maintenance performance function in years 2014 and 2015 relative to year 2013 when CMMS was not deployed in the plant.
Appr. or Post Appr. Status? Pri 6? 20-PLN 32-MOD 34-DEF
EXIT W F Yes Yes
No
No NoNo
Is Router a Planner W O is Priority 6,
Send E-Mail to Foreman
Yes Yes
Yes
Yes YesYes Pri 6? W ork Request
Entered/
W ork Flow Started
Can Approve? Maximo Direct Issue Check 62-W MA Approved 50-APR No No Cancel 90-CAN Defer 34-DEF Priority =5 Planning 20-PLN 32-MOD Screening 10-IDT No No Yes Yes Manager Review 30-W AP Cancel 90-CAN Defer 34-Def
Parts, Services & Tools Required?
No No
Parts, Services & Tools Available? Yes
Yes
6-W MA NoNo Priority >3
No No Yes Yes 63-W SC In Progress 70-INP Yes Yes 64-RDY 85-CLO
80-COM 88-EDHHistory Edited
W ork Complete W ork Complete Financial Close of W ork Order Financial Close of W ork Order Emergency W ork
Priority 5 Emergency W ork Priority 5
No No
W ork Flow Process
Indicates Typical Flow Manual Process L
E Steps to Execution Automated Decision G Process
E Bypass/Re-Router Loop Flow
N Automated Process D Indicates an Exit of W F,
Unapproved, End of Cycle
selected manufacturing companies to machines efficiencies and found a significant relationship. Suleiman et al. [14] developed a CMMS system otherwise named maintenance management information system (MMIS) for managing maintenance resources, maintenance schedule and personnel decision. CMMS is a type of software which performs functions in support of maintenance management systems [15] and tracks O&M activities [16], [17]. Despite the huge benefits associated with CMMS as a tool in maintenance management, success rate in its implementation has been adjudged rather poor [18]. Therefore, this work evaluated the effects of a deployed CMMS software program on three of the critical plant assets in a cement production plant using KPIs.
2.
Materials and Method
The study involved collection of data on performance of key equipment between 2013 and 2015. The cement plant is a world conglomerate located in Nigeria. The major equipment under consideration included Limestone Crusher (LC), Cement Mill (CM) and Kiln (KI). Interviews were conducted among maintenance personnel to determine the plant critical assets.
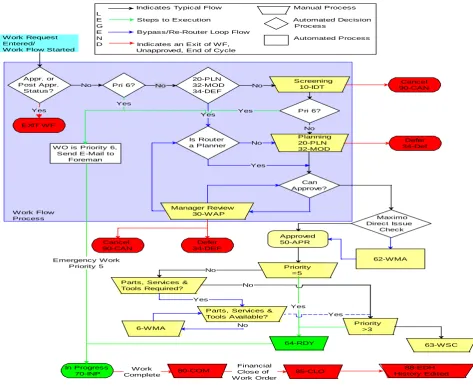
Fig. 1 Maintenance work order and flow cycle
CMMS software implementation was done to determine the plant asset reliability impact and the plant KPIs. The software deployed is Maximo 7.0 software. The implementation involved provision of desk top computers to maintenance personnel, inspectors, planners and executioners. The software was installed on the computers and networked to the server. When an inspector observed a fault or malfunctioning of a machine, a work order was raised, approved by Methods Engineer and sent to respective executioner. When the fault is rectified, it was reported back and approved by Mechanical Manager. The overall plant reporting was done through plants key performance indices calculation. Reliability Factor (RF), Utilization Factor (UF),
Performance Factor (PF), Number of Stoppages for Incidents (NSI), Inspection Compliance (IC), Planning
3.
Results
The Key Performance Indices (KPI) obtained based on Equations 1 – 3, of the studied plant assets are contained in Tables 1 to 5. The production losses for the period under study are $22.54m, $21.587m and $19.365m in 2013, 2014 and 2015 respectively.
100
IH
RH
RH
RF
(1)
100
T H
RH
UF
(2)
100
RT PH
AT PH
PF
(3)
Where
RF = Plant Reliability Factor; RH=Run Hours; TH=Total Hours; IH= Incident Hours; UF = Utilization Factor; PF = Performance Factor; ATPH= Actual Total Productive Hour; RTPH= Rated Total Productive Hour; NSI = Number of Stoppages for Incidents
Table 1a: KPI for LC, CM and KI in 3013 (CMMS not deployed)
UFLC RFLC PFLC UFCM RFCM
Jan 30.10 70.20 91.42 0.00 100.00 Feb 35.10 84.41 87.94 0.38 100.00 Mar 2.29 100.00 77.75 0.00 100.00 Apr 29.49 51.61 80.72 2.56 91.46 May 31.14 41.02 79.09 5.48 100.00 Jun 29.01 37.35 85.66 11.92 100.00 Jul 39.36 53.22 92.64 7.75 100.00 Aug 34.43 61.43 93.60 0.00 100.00 Sep 22.96 40.71 90.93 0.00 100.00 Oct 28.29 36.01 83.80 0.00 100.00 Nov 13.54 28.31 77.87 0.00 100.00 Dec 26.63 30.28 85.30 0.00 100.00
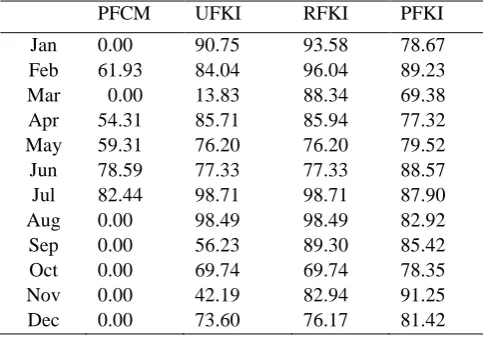
Table 1b: KPI for LC, CM and KI in 3013 (CMMS not deployed)
PFCM UFKI RFKI PFKI
Jan 0.00 90.75 93.58 78.67 Feb 61.93 84.04 96.04 89.23 Mar 0.00 13.83 88.34 69.38 Apr 54.31 85.71 85.94 77.32 May 59.31 76.20 76.20 79.52 Jun 78.59 77.33 77.33 88.57 Jul 82.44 98.71 98.71 87.90 Aug 0.00 98.49 98.49 82.92 Sep 0.00 56.23 89.30 85.42 Oct 0.00 69.74 69.74 78.35 Nov 0.00 42.19 82.94 91.25 Dec 0.00 73.60 76.17 81.42
Table 2a: KPI for LC, CM and KI in 2014 (CMMS deployed)
UFLC RFLC PFLC UFCM RFCM
Jan 36.10 49.32 97.31 0.92 100.00 Feb 31.11 51.41 104.22 2.15 100.00 Mar 36.29 55.32 100.28 7.88 100.00 Apr 24.98 61.03 97.70 0.00 100.00 May 20.31 46.45 83.76 0.00 100.00 Jun 22.66 46.02 82.49 4.91 100.00 Jul 30.02 42.13 91.92 0.67 100.00 Aug 23.57 36.31 90.04 0.00 100.00 Sep 38.18 56.77 69.47 8.98 100.00 Oct 35.17 58.80 80.78 0.95 100.00 Nov 41.08 50.09 70.89 0.55 100.00 Dec 43.59 66.77 61.50 0.47 100.00
Table 2b: KPI for LC, CM and KI in 2014 (CMMS deployed)
PFCM UFKI RFKI PFKI
Jan 81.61 83.68 83.68 94.00
Feb 39.95 88.65 89.06 87.47
Mar 86.25 97.84 97.84 85.50
Apr 0.00 76.33 76.33 84.29
May 0.00 55.35 99.52 88.45
Jun 56.88 72.06 87.22 94.98
Jul 46.63 99.33 99.33 82.61
Aug 0.00 78.12 78.12 80.29
Sep 79.54 80.28 82.45 71.55
Oct 96.07 91.16 93.19 85.04
Nov 84.09 93.63 93.92 89.56
Dec 58.41 78.92 78.92 97.64
Table 3a: KPI for LC, CM and KI in 2015 (CMMS deployed).
UFLC RFLC PFLC UFCM RFCM
Table 3b: KPI for LC, CM and KI in 2015 (CMMS deployed).
PFCM UFKI RFKI PFKI
Jan 0.00 60.82 63.38 98.47
Feb 68.73 89.66 94.30 97.52
Mar 95.07 60.46 60.46 99.73
Apr 82.90 73.66 73.86 97.40
May 97.78 85.31 85.78 97.68
Jun 0.00 97.67 97.67 95.40
Jul 0.00 78.82 91.29 86.31
Aug 0.00 83.03 83.63 97.88
Sep 0.00 79.89 79.89 96.81
Oct 0.00 79.89 79.89 96.81
Nov 0.00 80.89 79.89 96.81
Dec 0.00 81.89 79.89 96.81
Table 4: NSI for Studied Plants from 2013 to 2015.
Year LC CM KI
Dec-13 824 34 82
Dec-14 788 26 56
Dec-15 431 11 46
NSI = Number of stoppages for incidents
Table 5: RF for Studied Plants from 2013 to 2015.
Year LC CM KI
Dec-13 46 86 76 Dec-14 51 88 79 Dec-15 59 92 88
4.
Discussion
The implementation of the CMMS showed improvements in utilization, plant reliability and performance factors for the plant critical assets considered in years 2014 and 2015 relative to year 2013. These led to increase in cement production output, labour productivity and plant availability. More than 90% of the plant’s operational decisions are made considering equipment reliability and availability. Hence, increase in utilization and reliability factors favoured better operational decision making. Consequently, maintenance cost associated with more frequent plant stoppages in 2013 reduced appreciably in the subsequent years. This also translated into improvements in the day-to-day maintenance workflow, information and data management and overall organization’s business performance as disclosed in the work of Weinker et al.
[18]. The production loss reduced by $0.953m and $3.175m for the years 2014 and 2015 respectively, compared to loss incurred in 2013. These savings are consequences of lower production and maintenance costs, plant downtime and material wastage as explained by an earlier research work [18]. Based on these metrics, the statement by Šlaichová and Maršíková [6] that providing support via a maintenance information system helps the enterprise to reach a better level of Overall Equipment Effectiveness (OEE) is valid as shown in this study.
5.
Conclusions
The evaluation of CMMS effects on a cement production plant located in Nigeria has been performed and found to positively affect maintenance cost and management as a whole. Based on the results obtained from this study, the following conclusions are reached:
Plant utilization factors increased for Limestone Crusher and Kiln in the periods of CMMS implemented in plant.
Number of Stoppages for Incidents for the plant assets considered reduced significantly during CMMS implementation.
The reliability of the considered plants assets increased when CMMS was deployed in the plant.
The production losses incurred in 2014 and 2015 were reduced resulting from CMMS implementation.
CMMS implementation in the plant aided better and effective maintenance management decision making which led to the improvement in the KPIs for the plant assets considered.
References
[1] Ralph, R. Effective maintenance management helps lafarge cement grow to become global market leader.
ARC View, (2013), pp. 1-7.
[2] Mobley, R. K. An Introduction to Predictive Maintenance, 2nd Edition. Butterworth-Heinemann, USA, (2002), pp 438.
[3] Weber, A. and Thomas, R. Key Performance Indicators: Measuring and Managing the Maintenance Function. Ivara Corporation, Ontario, (2005), pp. 16.
[4] Shafeek, H. Maintenance practices in cement industry. Asian Transactions on Engineering, Volume 1, (2012), pp. 10-20.
[5] Eti, M. C., Ogaji, S. O. T., and Probert, S. D. Reducing the cost of preventive maintenance (pm) through adopting a proactive reliability-focused culture. Applied Energy, Volume 83, (2006), pp. 1235-1248.
[6] Branska, L., Pecinova, Z., Patak, M., Stankonova, M. and Kholova, P. Maintenance management systems in the Czech enterprises of chemical and food industries. Trends Economics and Management, Volume 27, (2016), pp. 20-39.
[7] Emovon, I. and Mgbemena, C.O. Machinery/Service system scheduled replacement time determination: a combine weighted aggregated sum product assessment, additive ratio assessment and age replacement model approach. International Journal of Integrated Engineering, Volume 10, (2018), pp. 169-175.
[8] Emovon, I. and Samuel, O.D. Prioritising alternative solutions to power generation problems using MCDM techniques: Nigeria as case study.
[9] Amin, M.A., Gupta, H.S., Tarannum, R. and Ahasan, R. An approach to develop green environment in cement industry by proper material handling and maintenance management system-a case study.
Global Journal of Research in Engineering (G), Volume 17, (2017), pp. 9-16.
[10]Zare, A., Feylizadeh, M.R., Mahmoudi, A. and Liu, S. Suitable computerized maintenance management system selection using grey group TOPSIS and fuzzy group VIKOR: a case study. Decision Science Letter,
Volume 7, (2018), pp. 341-358.
[11]Šlaichová, E. and Maršíková, K. The effect of implementing a maintenance information system on the efficiency of production facilities. Journal of Competitiveness, Volume 5, (2013), pp. 60-75. [12]Velimirović, D., Velimirović, M., and Stanković, R.
Role and importance of key performance indicators measurement. Serbian Journal of Management, Volume 6, (2011), pp. 63–72.
[13]Ogbo, A.I., Eneh, N.C.J., Mbah, C.N. and Isijola, D.O. Effects of computerized maintenance management systems on performance of selected manufacturing companies in Enugu State, Nigeria.
Science & Technology, Volume 4, (2018), pp. 38-51.
[14]Suleiman, A., Saleh, U.A. and Onuigbo, F.I. Application of information and communication technology in engineering for effective maintenance management. International Journal of Engineering and Applied Sciences, Volume 4, (2017), pp. 10-13. [15]Lopes, I., Senra, P., Vilariho, S., Sa, V., Teixeira, C.,
Lopes, J., Alves, A., Oliveira, J.A. and Figueiredo, M. Requirement specification of a computerized maintenance management system-a case study.
Procedia CIRP, Volume 52, (2016), pp. 268-273. [16]Oxstrand, J. H. Functional Requirements for an
Electronic Work Packaging System. National Laboratory U.S Department of Energy, Idaho, (2016), pp. 37.
[17]Ayika, A. Evaluation of Maintenance Management Function at Derba MIDROC Cement Production Factory Unpublished Master’s Thesis. Indira Gandhi National Open University, MaidanGarhi, New Delhi, (2013), pp. 107.