Published online March 20, 2014 (http://www.sciencepublishinggroup.com/j/ajce) doi: 10.11648/j.ajce.20140202.12
Performance of damage detection methods used in bridge
structures through dynamic tests in steel beams
Rolando Salgado
1, *, Paulo J. S. Cruz
2, Gustavo Ayala
3, Sergio A. Zamora
11
Faculty of Engineering, University of Veracruz, Veracruz, Mexico 2
Autonomous School of Architecture, University of Minho, Guimarães, Portugal 3
Institute of Engineering, National Autonomous University of Mexico, Mexico
Email address:
[email protected] (R. Salgado), [email protected] (P. J. S. Cruz), [email protected] (G. Ayala), [email protected] (S. A. Zamora)
To cite this article:
Rolando Salgado, Gustavo Ayala, Paulo J. S. Cruz, Sergio A. Zamora. Performance of Damage Detection Methods used in Bridge Structures through Dynamic Tests in Steel Beams. American Journal of Civil Engineering. Vol. 2, No. 2, 2014, pp. 18-26. doi: 10.11648/j.ajce.20140202.12
Abstract:
In this document, the performance of damage detection methods used for the evaluation of bridge structures was determined. To do that, these methods were applied to the experimental dynamic parameters obtained from cracked steel I beams. Different damage scenarios were simulated in the steel I beams through saw-cuts perpendicular to the longitudinal axis of the beams. The damage detection methods were evaluated under different damage scenarios tried to represent fatigue damage in bridge structures. Ambient vibration tests, before and after damage, were performed on analyzed beams and the obtained dynamic parameters were used for the damage detection procedure. For all the evaluated scenarios, only the first three mode shapes were taken into account. Results indicated high possibility of damage detection when the severity of damage increase, damage is close to a measuring point and far away from an inflexion point and/or the boundary conditions. It was found that Level I methods (just detection) are not confidence to detect damage. On the other hand, level II methods (location) had good performance for the most severe damage scenarios. It was found out that Wavelet based methods are the best choice for their application to bridge structures.Keywords:
Damage Detection, Experimental Modal Analysis, Structural Evaluation1. Introduction
The evaluation of the selected damage detection methods requires information of the dynamic parameters from different structural conditions of the bridge. Unfortunately, only few campaigns of dynamic tests in real scaled bridges before and after deliberate or unintentional damage have been so far performed (e.g., [1], [2], and [3]). As alternative, simpler structures like beams have been experimentally tested, to acquire their dynamic response and obtain their characteristics before and after damage, e.g., Maeck [4] carried out several experiments on concrete beams tested to failure in order to validate the direct stiffness calculation method. Guilling and Praisach [5] carried out several experiments on steel beams with various damage scenarios and boundary conditions in order to validate an enhanced frequency change method. Salgado and Cruz [6] applied Wavelet Analysis methods to obtain the modal parameters from steel I beams tested with different crack patterns. Other
experiments made on laboratory specimens and a review of the most important vibration-based damage detection methods may be consulted in [7] and [8]. This work evaluates the performance of the selected methods when applied to experimentally dynamic responses. The selected damage detection methods were evaluated on vibration parameters acquired in several damage scenarios introduced to beam specimens. Simply supported steel beams were damaged and their modal parameters were determined. Damage was introduced in these steel I beams through saw cuts transversal to the longitudinal axis of the beams. This damage was tried to be detected using the damage detection methods applied to their vibration parameters. These cases try to represent typical damage found in bridges.
2. Method of Study
next procedure is recommended:
a) Selection of the beam specimens. The lengths and position of the strong direction of the beams were chosen to give their first natural frequencies into to the range of those found for bridges of short and medium span, i.e., 2-12 Hz [4].
b) Induced damage on the beams. Damage scenarios tried to represent open vertical cracks caused by fatigue. The introduction of fatigue cracks in steel I beams of such dimensions would need the application of many load cycles during several weeks of testing. For simplicity, this damage was inflicted on the beams by saw cuts (notches). This inflicted damage may cause different variation of the natural frequencies compared with those caused by cracks of the same depth [9].
c) Damage detection procedure. It was selected the most promising damage detection methods to be applied in bridges [7]. Furthermore, It was determined the variables and parameters required for the damage analyses.
d) Dynamic tests. Traditional dynamic tests required knowledge of force excitation. This leads to apply expensive exciters on the bridge and in many cases to close the bridge. A solution of this drawback is to use, as the force excitation, vibrations caused by cars passing in the bridge, people walking around the structures and other different sources can be taken into account. This technique of performing dynamic tests is known as Ambient Vibration Tests (AVTs) and is considered as the most suitable technique to be used in bridge structures.
e) Modal identification. For this purpose, modal parameters were obtained using Operational Modal Analysis (OMA) methods that do not require, for their application, information about the input force.
h) Damage detection. For the damage detection procedure, Level I and II methods were used [10]. Namely, the changes of frequencies between undamaged and damaged specimens and the Normalized Modal Difference (NMD) for the comparison of mode shapes, were used as level I methods. Eight vibration-based damage detection methods were used as level II methods. Four methods were based on Wavelet Analysis, namely the Continuous Wavelet Transform (CWT), the Discrete Wavelet Analysis (DWA), the Wavelet Packet Signature (WPS) and the Damage Index (DI) applied to the CWT of the mode shapes (CWT-DI). The curvature method (CRV), the Damage Index (DI), the change of stiffness (CHS) and flexibility methods (CHF) completed the methods used. The CWT, the DWA and the Curvature methods can locate damage along the structures only with vibration parameters determined from the damaged cases. The remaining methods compare the vibration parameters obtained before and after damage. The WPS is the only method that uses energy shapes. A comprehensive explanation of the involved damage detection methods may be found in [7].
The described procedure is exemplified in the steel I beams as indicated in the next.
2.1. Description of the Beam Specimens
The beams considered for the damage detection analyses were made from steel and their geometric properties were: Young’s Modulus, E=210 MPa, mass density, ρ=7.85 ton/m3, with area, A=1.03×10⁻³ m2 and second moments of area, I2=1.59×10⁻⁷ m4 and I3=1.71×10⁻⁶ m4 in the weak (2)
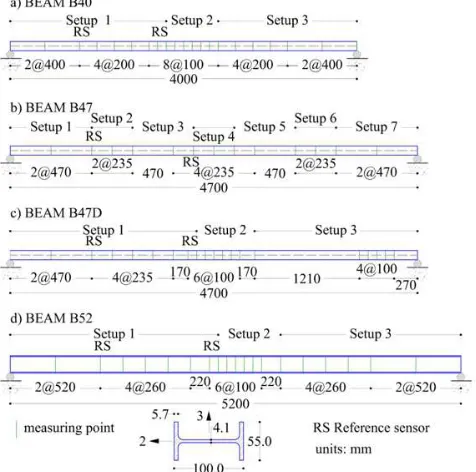
and strong direction (3), respectively. Considering that all the beams were simply supported, three geometrical cases were considered. For the first two cases, beams with 4.0 and 4.7 m span lengths were located with their weak axis (2) in the horizontal direction. In the third case, the beam with 5.2m long span was located with its strong axis (3) in the horizontal direction. These beams were referred as B40 B47 and B52 according to their span lengths. In the case of the beam B47, dynamic tests were performed with two different sensor layouts and damage distribution along the beam. As a result, different modal parameters for the same case study were obtained. Therefore, it was defined an additional case referred as B47D. The geometry of the described beams used for the experimental dynamic tests is shown in Fig. 1.
2.2. Induced Damage on the Beams
Different damage scenarios were evaluated in the steel I beams. According to their position, notches were located in the mid-span zone of the beams. Only the beam B47D presented three additional notches near its right support. Notches were separately 100 mm. Only 200 mm separation was used for the beam B47 case C. Depths, locations and separations of notches in the beams for the considered damage scenarios are shown in Fig. 2.
Figure 2. Damage scenarios.
The baseline condition of the beams was the case without damage. Only in the beam B47D, the baseline condition was the damage scenario D of the beam B47 with the additional masses taken into account.
In Fig. 2, letters A to F indicate the sequence that notches appeared on the beams. For instance, for beam B40 damage pattern A is a double-edge notch 24 mm deep located in the middle length of the beam.
Damage pattern B is three notches. 24 mm deep separated 100 mm each one which involve the damage pattern A and the two notches defined as B. The same criterion above described was followed for the damage scenarios of the other beams. Damage scenarios in beam B40 represented severe damage caused by double-edge cracks. Regarding beam B47, damage scenarios A to C evaluated moderate damage caused by single-edge cracks. Damage scenario D is a severe damage caused by double-edge cracks. In damage scenarios E and F, the ability of the damage detection methods to detect damage caused by double-edge cracks near the right support was evaluated. In beam B52, the first damage scenario A represented a light damage caused by a single-edge crack. Damage scenarios B and C represented severe damage caused by single-edge cracks.
2.3. Damage Detection Procedure
Before starting the process of damage location, the mode shapes from the different damage scenarios were mass normalized. For that purpose, the mass matrices of the specimens were determined along the Degrees Of Freedom (DOFs) were the sensors were located. Later, the normalized mode shapes and Wavelet Packet Signature (WPS) energy shapes were interpolated. The last procedure is recommended because the involved damage detection methods have a better performance when more measuring points are taken into account.
For the damage detection analyses, curvatures of the mode shapes were calculated using the smoothing procedure proposed by [4]. For the case of Wavelet Analysis methods (DWA, CWT and WPS) a mother wavelet needed to be specified. Comparison of several studies carried out with different mother wavelets (see [11] and [12]) showed that good results were found for the Gauss 4 mother wavelet for the CWT method in the scale 2.
Daubechies 4 mother wavelet was chosen for the DWA method in the detail 1. In the WPS method, the acceleration response was decomposed to the 9th level using the Daubechies 4 as the mother wavelet. In the next step with the WPS method, the five functions with the highest entropy energy were chosen for the damage detection procedure. An explanation of the Wavelet theory may be found in [13].
2.4. Dynamic Tests
The equipment used for the dynamic tests consisted of 9 piezoelectric accelerometers (model PCB 393B12) with an average sensitivity of 10 V/g, and a Data Acquisition System, DAQ (model CDAQ from National Instruments), where acquired data was converted and transferred to a portable computer to be stored and processed. In these dynamic tests, only accelerations in the vertical direction were recorded. The acceleration responses were acquired on the beams without damage and after each damage scenario. The dynamic tests were performed with a sampling frequency of 500 Hz and 300 s of recorded time for the beam B40. A sampling frequency of 400 Hz and 420 s of recorded time were used for the beam B47. In the case of the beam B52, a sampling frequency of 100 Hz and a recorded time of 180 s were used.
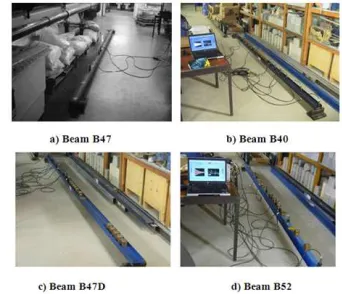
In the dynamic tests, 21 measuring points were located in the beams as shown in Fig. 1. To cover the total number of points with seven roving accelerometers and two reference sensors for each beam (referred to as RS in Fig. 1), three sensor setups were required. The use of seven roving accelerometers in the beams may alter the total mass of the beam and subsequently its modal parameters. To avoid that, 12 wood cubes with the same mass than the accelerometers (253 grams) were located, for each setup, in the measuring points free of sensors. Exception was the beam B47 where the acceleration response was acquired with only three accelerometers requiring seven sensor setups to cover the 15 measuring points. In beam B47 the mass of the three accelerometers did not represent an important part of the total mass of the beam; therefore, the additional masses were not necessary. The procedure used for performing the dynamic tests is shown in Fig. 3.
2.5. Modal Identification
The modal identifications performed for the different damage scenarios of the beams were calculated using ARTEMIS computer program [14]. In particular, the Stochastic Subspace Identification (SSI) method weighted with the Canonical Variate Analysis (CVA) algorithm was used.
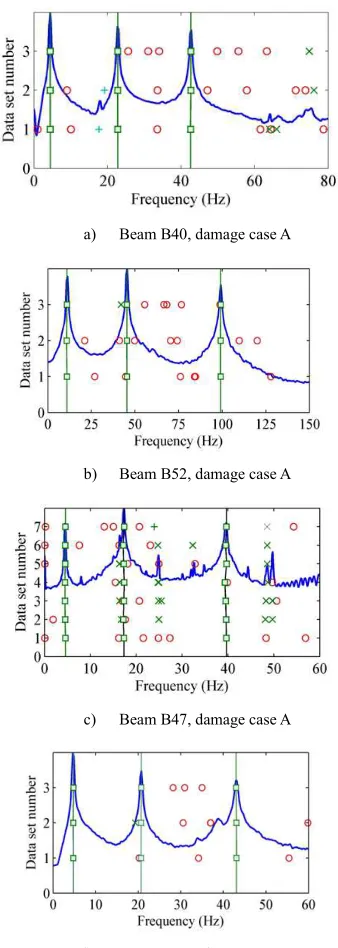
In total, fourteen modal identifications were done. The maximum state space in all modal identifications was set to 120. Models were estimated with state space dimensions from 0 to 60. The first three natural frequencies and their corresponding mode shapes and damping ratios were identified for each damage scenario as shown in the selection mode graphs of Fig. 4.
a) Beam B40, damage case A
b) Beam B52, damage case A
c) Beam B47, damage case A
d) Beam B47D, damage case F
Keys: selected mode; + unstable mode; noise mode; x stable mode
Figure 4. Typical example of the selection mode graphs.
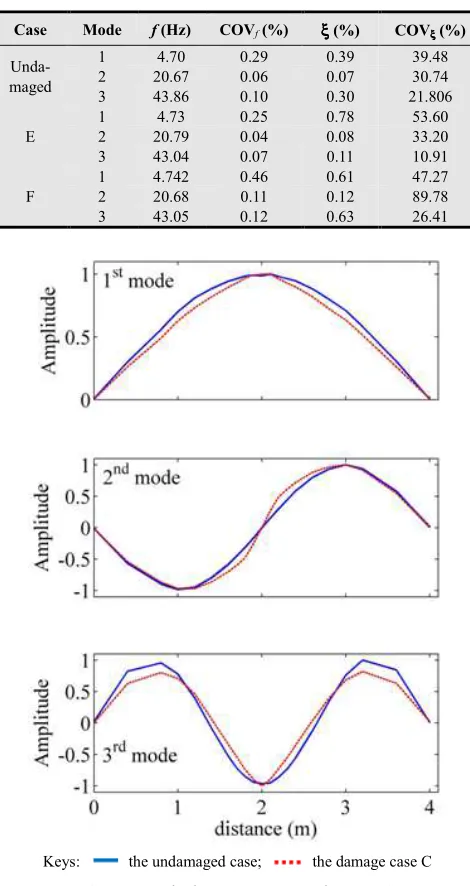
Modal parameters determined from the selected graphs are given in Tables 1 to 4 for beams B40, B52, B47 and B47D, respectively. They indicated that the natural frequencies (f) from all the evaluated cases were determined with high confidence, i.e., low covariance values (COV) with an average of 1.13 0.20, 0.62 and 0.17 % for the beams B40, B52, B47 and B47D, respectively. In contrast, damping ratios ξ were calculated with a high variability, resulted in an average of the covariance values of 43.67, 40.30, 44.92 and 39.24 % for the beams B40, B52, B47 and B47D, respectively. Example of the obtained mode shapes of the beams, before and after damage, is shown in Fig. 5.
2.6. Damage Detection Level I Methods
Firstly, the detection of damage in the steel I beams was done using level I methods, namely the frequency change method and the Normalized Modal Difference (NMD) method. The damping comparison was not done here. High variability of the damping, with covariance values around 40%, did not allow any confidence comparison with this parameter.
Successful damage detection was defined when the frequency change (rate of undamaged f0 and damaged
frequencies fD; (∆f =
(
f0− fD)
f0) is larger than 5%. In fact,ambient factors, errors during data acquisition and precision of the instrumentation can give variability of the frequencies around 5%, [15]. The frequency change comparison between the undamaged and damaged cases for the considered steel I beams is shown in Fig. 6.
Table 1.Modal parameters for the beam B40.
Case Mode f (Hz) COVf (%) ξ ξ ξ ξ (%) COVξξξξ (%)
Unda- maged
1 5.61 0.65 0.39 60.69 2 22.82 0.09 0.17 27.54 3 50.50 0.31 0.23 53.37
A
1 4.418 0.13 0.42 41.06 2 22.79 0.02 0.12 30.44 3 42.65 0.12 0.10 34.51
B
1 3.26 7.71 2.71 59.47 2 20.93 0.05 0.08 35.16 3 39.75 1.05 0.41 50.78
Table 2.Modal parameters for the beam B52.
Case Mode f (Hz) COVf(%) ξ ξ ξ ξ (%) COVξ ξ ξ ξ (%)
Unda- maged
1 11.19 0.10 0.25 43.13 2 45.30 0.10 0.34 56.27 3 100.49 0.04 0.23 24.88
A
1 10.89 0.73 0.15 72.70 2 45.32 0.05 0.16 24.11 3 99.10 0.05 0.19 27.64
B
1 9.65 0.88 0.41 51.10 2 46.08 0.07 0.15 11.29 3 89.38 0.06 0.14 31.21
C
Table 3.Modal parameters for the beam B47.
Case Mode f (Hz) COVf(%) ξ ξ ξ ξ (%) COVξ ξ ξ ξ (%) Unda-
maged
1 4.44 0.62 0.25 66.01 2 17.35 0.45 0.071 36.30 3 39.01 0.25 0.11 19.76
A
1 4.51 0.89 0.45 95.58 2 17.29 0.43 0.10 52.00 3 39.56 0.32 0.13 31.55
B
1 4.44 1.09 0.60 69.13 2 17.28 0.47 0.13 51.93 3 39.06 0.32 0.25 23.88
C
1 4.313 1.49 0.32 28.55 2 17.25 0.54 0.10 21.76 3 38.13 1.26 0.29 50.21
D
1 4.09 0.47 0.24 29.66 2 17.17 0.44 0.13 49.76 3 37.26 0.32 0.17 47.65
Table 4.Modal parameters for the beam B47D.
Case Mode f (Hz) COVf (%) ξ ξ ξ ξ (%) COVξξξξ (%)
Unda- maged
1 4.70 0.29 0.39 39.48 2 20.67 0.06 0.07 30.74 3 43.86 0.10 0.30 21.806
E
1 4.73 0.25 0.78 53.60 2 20.79 0.04 0.08 33.20 3 43.04 0.07 0.11 10.91
F
1 4.742 0.46 0.61 47.27 2 20.68 0.11 0.12 89.78 3 43.05 0.12 0.63 26.41
Keys: the undamaged case; the damage case C
Figure 5.Mode shape comparison in beams B52.
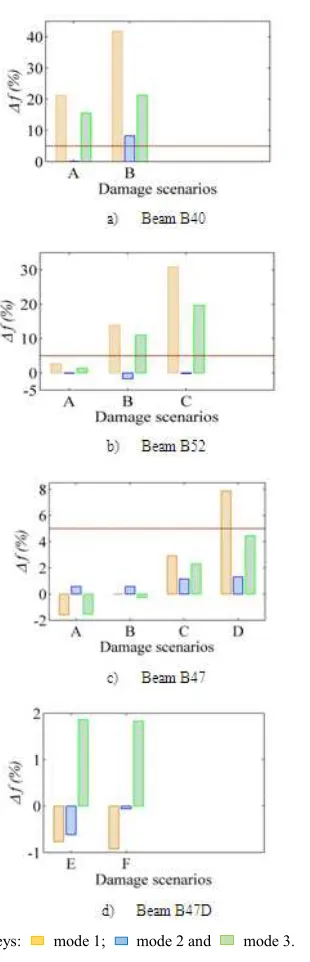
As it was expected, the frequency change was larger than 5% for the severe damage introduced to beams B40 and B52.
Except the damage case A for the beam 52 which represented a light damage. In the case of the beam B47, it can be pointed out that the frequency change was larger than 5% only for the damage case D of the first mode shape. Damage introduced in the zone near the support of the beam B47D did not alter significantly the frequency change of the damage case D (taken as baseline for beam B47D).
Regarding the mode shape comparison, the NMD method gives more rational scale when the differences between two modes are small compared with Modal Assurance Criterion (MAC) method. For instance, NMD values of 20, 15 and 8 % correspond to MAC values of 0.9615, 0.9780 and 0.9936, respectively. For damage detection purposes, a MAC value less than 0.80, equivalent to a NMD larger than 50%, would indicate the existence of damage in the structure. This criterion try to rule out mode shape differences caused by ambient factors, like gradient of temperature and humidity, noise present in the dynamic response and inaccuracies during the modal identification process. The application of the NMD method to the mode shapes obtained from the different damage scenarios in the steel I beams is shown in Fig. 7.
In the mode shape comparison of Fig. 7 no successful damage detection was found for any damage case (any damage scenario had NMD larger than 50 %). In fact, the MAC and the NMD method average the differences between the coordinates of the two compared mode shapes. Even when big differences happen in some particular points of the modes, the resulted NMD value does not change in the same rate. As it was expected, the NMD values were larger for the most severe damage cases (beam B40 all cases and B52 cases B and C). It was also noticed that the third mode was the most sensitive to damage in all the damage cases.
2.7. Level II Methods
Before starting the process of damage location, the normalized mode shapes and the WPS energy shapes were interpolated from the original 21 points (or 15 points for the beam B47) to 101 points using spline interpolation.
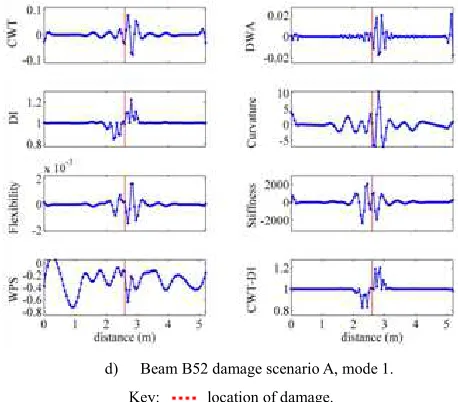
Successful damage detection was considered when a sharp peak and/or disturbance zone with coefficient values clearly above those of its neighborhood was found in the graph. Exceptions are the zones near the ends where high disturbance caused by the singularities of the supports is always present. Results of applying the damage detection methods to the most sensitive mode shapes and energy shapes are shown in Fig. 8.
Keys: mode 1; mode 2 and mode 3.
Figure 6. Frequency change comparison.
∆
f
=
(
f
0−
f
D)
f
0In Tables 5 to 7, V refers to clear detection of damage, i.e., the graph of the applied method presents a clear disturbance in the location of damage as shown in Fig. 8; G
refers to clearer disturbance present in the damage zone. In this case, the graph of the applied method presents several peaks outside the damage zone with smaller amplitudes than those located within the damage zone. When damage was not detected at all, i.e., no clear disturbance is located in the damage zone (see Fig. 10 for the CWT-DI method), the evaluated methods were classified as no damage identification (-). For beam 47D cases E and F, damage detection was evaluated for damage present in the mid-span region as well as near the right support (see Fig. 8).
Keys: mode 1; mode 2 and mode 3.
Figure 7.Modal comparison using NMD method.
d) Beam B52 damage scenario A, mode 1.
Key: location of damage.
Figure 8. Examples of the evaluation of damage detection methods.
3. Discussion and Results
Results showed that level I methods could detect severe damage by frequency change method, when damage was located far away of inflexion points and of boundary conditions of the beam. On the other hand, NMD did not give any positive damage detection, therefore, this method cannot be considered as a reliable one for damage detection procedure. It was also noticed that the first mode was the most sensitive to frequency change, the third mode had the biggest mode shape differences (NMD method) and the second mode was the least sensitive to damage. The damage introduced in the beams coincided with an inflexion point of the second mode, which did not allow big changes in its amplitudes.
Table 5. Evaluation of damage detection methods, 1st mode shape.
B40 B47 B47D B52
Method A B A B C D E F A B C
CWT V V V G V V V/G V/V V V V
DWA G V G G G G V/G V/G V V V
DI V V G - V V V/V V/V G V V
CRV V V G G G V V/V V/V V V V
CHF G V - G V V V/V V/V V V V
CHS V V - G - G G/V V/V V V V
WPS V V - - - - -/- -/- - G V
CWT-DI V G - - V V V/G V/V G V V
Table 6. Evaluation of damage detection methods, 2nd mode shape.
B40 B47 B47D B52
Method A B A B C D E F A B C
CWT - V - - G G V/- V/V - G G
DWA - V - - G G V/G V/V - G G
DI - V - - - - V/V V/V - - -
CRV - - - - - - V/V V/V - - -
CHF G V - G V V V/V V/V V V V
CHS V V - G - G V/V V/V V V V
WPS G V - - - - -/- -/- - G V
Table 7. Evaluation of damage detection methods, 3rd mode shape.
B40 B47 B47D B52
Method A B A B C D E F A B C
CWT V V G G G V V/V V/V V V V
DWA V V G G G V V/V V/V V V V
DI V V G G V G V/V V/V G V V
CRV V V G G G G V/V V/V V V V
CHF V V - G V V V/V V/V V V V
CHS V V - G G V V/V V/V V V V
WPS G V - - - - -/- -/- G G V
CWT-DI V V - V G G V/V V/V V V V
Regarding the application of the level II methods to the dynamic parameters of the steel I beams, successful damage detection was obtained in most of the cases. Methods presented difficulties to locate damage for the less severe damage cases and for the detection of damage with the second mode. The WPS method presented the worst performance among the evaluated methods. The noise present in the acceleration histories diminished considerably the performance of this method. On the other hand, the CWT and the DWA methods presented, in general, the best performance. In the case when damage is close to an inflexion point, the Flexibility and Stiffness methods are the best choice.
4. Conclusions
The application of the selected damage detection methods to the data obtained from experimental dynamic tests showed that damage can be detected and located using the analyzed damage detection methods. Severe damage could be detected for all the methods. Exception was the NMD method.
It is important to highlight that the effects caused by damage in the mode shapes and acceleration responses were concentrated at the close vicinity of the damage zones. Thus, it is recommended to locate a denser grid of sensors at the probable location of damage. Nevertheless, in the structural evaluation of a real case, location of damage is not known a priori and an optimal location of sensors is compulsory. To do that, it is suggested to update a numerical model of the structure with the experimental dynamic parameters considering the influence of possible damage in the structure. In a subsequent step, the sensor layout used for the dynamic tests would be upgraded according to the simulated damage. If two experimental modal identifications performed on the structure lead to significant differences in the evaluated dynamic parameters, the detection and location of damage procedures should be done. The procedure used here for the damage detection and location on these beams can also be applied to more complex structures using an iterative procedure.
In summary, the process of damage location with the current development of sensor instrumentation for AVTs and the evaluated vibration-based damage detection methods needs an iterative procedure between experimental dynamic tests and updated numerical model.
References
[1] Salgado, R. and Cruz, P.J.S., Modal identification and damage detection of Övik bridge between deliberated damage tests. Sustainable Bridges – Assessment for Future Traffic Demands and Longer Lives, internal report, 2007. [2] Maas, S., Zürbes, A., Waldmann, D., Waltering M., Bungard,
V., and De Roeck, G., Damage assessment of concrete structures through dynamic testing methods. Part 2: Bridge tests. Engineering Structures, vol. 34, 2012, pp. 483-494. [3] Dilena, M. and Morassi A., Dynamic testing of a damaged
bridge. Mechanical System and Signal Processing, vol. 25, 2011, pp. 1485-1507.
[4] Maeck, J., Damage assessment of civil engineering structures by vibration monitoring, PhD dissertation, Catholic University of Leuven, Leuven, Belgium, 2003.
[5] Gillich, G.R. and Praisach, Z.I., Modal identification and damage detection in beam-like structures using the power spectrum and time-frequency analysis, Signal Processing, vol. 96, 2014, pp. 29-44.
[6] Salgado, R. and Cruz, P.J.S., Detecting damage in structures using wavelet analysis. In Proc. of the 5th international workshop on structural health monitoring, Stanford, CA, USA, 2005, pp. 1809-1816.
[7] Salgado, R., Damage detection in bridges through vibration monitoring: evaluation and application, Ph.D. Dissertation, University of Minho, Guimarães, Portugal, 2008.
[8] Jassim, Z.A., Ali, N.N., Mustapha, F. and Abdul Jalil, N.A., A review on the vibration analysis for a damage occurrence of a cantilever beam, Engineering Failure Analysis, vol. 31, 2013, pp. 442-461.
[9] Silva, J.M.M. and Gómez, A.J.M.A., Experimental dynamic analysis of cracked free-free beams, Experimental Mechanics, vol. 30, 1990, pp. 20-25.
[10] Rytter, A., Vibration based inspection of civil engineering structures. Ph. D. Dissertation, Department of Building Technology and Structural Engineering, Aalborg University, Denmark, 1993.
[12] Hong, J-C., Kim Y.Y., Lee, H.C. and Lee Y.W., Damage detection using the Lipschitz exponent estimated by the wavelet transform: applications to vibration modes of a beam.
International Journal of Solids and Structures, vol. 39, 2002, pp. 1803–1816.
[13] Mallat, S., A wavelet tour of signal processing. Academic Press, Second Edition, New York, 1999.
[14] SVS, ARTEMIS Extractor Pro, release 3.43, modal analysis program, Structural Vibration Solutions A/S, Aalborg, Denmark, 2004.