I.1
Tables
Table 1. Crystal data and structure refinement for JEM1.
Empirical formula C14H16N4O4S
Formula weight 336.37
Data Collection
Type of diffractometer CCD area detector
Wavelength 0.71073 Å MoKα
Data Collection Temperature 293 K
θ range for reflections used
in lattice determination 2.10 to 23.34°
Unit cell dimensions a = 7.3650(15) Å
b = 17.578(4) Å β= 98.48(3)°
c = 11.727(2) Å
Volume 1501.7(5) Å3
Z 4
Crystal system Monoclinic
Space group P21/c
Density (calculated) 1.488 Mg/m3
F(000) 704
θ range for data collection 2.10 to 23.34°
Completeness to θ = 23.34° 99.1 %
Index ranges -8 ≤ h ≤ 8, -18 ≤ k ≤ 19, -11 ≤ l ≤ 13
Data collection scan type ω scans at 3 φ settings
Reflections collected 6820
Independent reflections 2168 [Rint= 0.0805]
Absorption coefficient 0.243 mm-1
Table 1 (cont.)
Structure solution and Refinement
Structure solution program SHELXS-97 (Sheldrick, 1990)
Primary solution method Direct methods
Secondary solution method Difference Fourier map
Hydrogen placement Geometric positions
Structure refinement program SHELXL-97 (Sheldrick, 1997)
Refinement method Full matrix least-squares on F2
Data / restraints / parameters 2168 / 0 / 209
Treatment of hydrogen atoms Riding
Goodness-of-fit on F2 3.704
Final R indices [I>2σ(I)] R1 = 0.1101, wR2 = 0.1841
R indices (all data) R1 = 0.1350, wR2 = 0.1858
Type of weighting scheme used Sigma
Weighting scheme used w=1/σ2(Fo2)
Max shift/error 0.000
Average shift/error 0.000
Largest diff. peak and hole 1.188 and -0.381 e.Å-3
Special Refinement Details
These crystals of N-phenylsalicylidene sulfonic acid guanidinium are twinned. It was not possible
to obtain satisfactory refinement results when applying the twinning algorithms. Therefore the twinning
was ignored. The overall structure is correct but is not of sufficient quality to publish.
Refinement of F2 is against ALL reflections. The weighted R-factor (wR) and goodness of fit (S)
are based on F2, conventional R-factors (R) are based on F, with F set to zero for negative F2. The threshold
expression of F2 > 2σ( F2) is used only for calculating R-factors(gt) etc. and is not relevant to the choice of
reflections for refinement. R-factors based on F2 are statistically about twice as large as those based on F,
and R-factors based on ALL data will be even larger.
All esds (except the esd in the dihedral angle between two l.s. planes) are estimated using the full
covariance matrix. The cell esds are taken into account individually in the estimation of esds in distances,
angles and torsion angles; correlations between esds in cell parameters are only used when they are defined
by crystal symmetry. An approximate (isotropic) treatment of cell esds is used for estimating esds
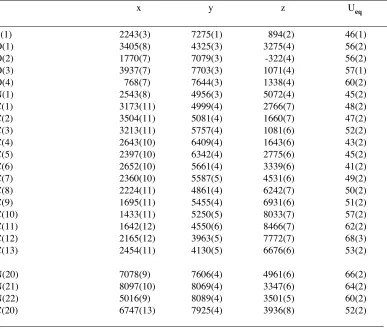
Table 2. Atomic coordinates ( x 10
4) and equivalent isotropic displacement
parameters (Å
2x 10
3) for JEM1. U(eq) is defined as the trace of the orthogonalized
U
ijtensor.
________________________________________________________________________________
x y z Ueq
________________________________________________________________________________
S(1) 2243(3) 7275(1) 894(2) 46(1)
O(1) 3405(8) 4325(3) 3275(4) 56(2)
O(2) 1770(7) 7079(3) -322(4) 56(2)
O(3) 3937(7) 7703(3) 1071(4) 57(1)
O(4) 768(7) 7644(3) 1338(4) 60(2)
N(1) 2543(8) 4956(3) 5072(4) 45(2)
C(1) 3173(11) 4999(4) 2766(7) 48(2)
C(2) 3504(11) 5081(4) 1660(7) 47(2)
C(3) 3213(11) 5757(4) 1081(6) 52(2)
C(4) 2643(10) 6409(4) 1643(6) 43(2)
C(5) 2397(10) 6342(4) 2775(6) 45(2)
C(6) 2652(10) 5661(4) 3339(6) 41(2)
C(7) 2360(10) 5587(5) 4531(6) 49(2)
C(8) 2224(11) 4861(4) 6242(7) 50(2)
C(9) 1695(11) 5455(4) 6931(6) 51(2)
C(10) 1433(11) 5250(5) 8033(7) 57(2)
C(11) 1642(12) 4550(6) 8466(7) 62(2)
C(12) 2165(12) 3963(5) 7772(7) 68(3)
C(13) 2454(11) 4130(5) 6676(6) 53(2)
N(20) 7078(9) 7606(4) 4961(6) 66(2)
N(21) 8097(10) 8069(4) 3347(6) 64(2)
N(22) 5016(9) 8089(4) 3501(5) 60(2)
C(20) 6747(13) 7925(4) 3936(8) 52(2)
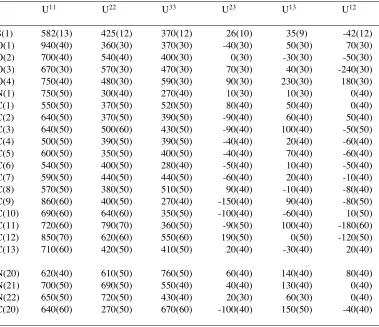
Table 4. Anisotropic displacement parameters (Å
2x 10
4 ) for JEM1. TheS(1) 582(13) 425(12) 370(12) 26(10) 35(9) -42(12)
O(1) 940(40) 360(30) 370(30) -40(30) 50(30) 70(30)
O(2) 700(40) 540(40) 400(30) 0(30) -30(30) -50(30)
O(3) 670(30) 570(30) 470(30) 70(30) 40(30) -240(30)
O(4) 750(40) 480(30) 590(30) 90(30) 230(30) 180(30)
N(1) 750(50) 300(40) 270(40) 10(30) 10(30) 0(40)
C(1) 550(50) 370(50) 520(50) 80(40) 50(40) 0(40)
C(2) 640(50) 370(50) 390(50) -90(40) 60(40) 50(40)
C(3) 640(50) 500(60) 430(50) -90(40) 100(40) -50(50)
C(4) 500(50) 390(50) 390(50) -40(40) 20(40) -60(40)
C(5) 600(50) 350(50) 400(50) -40(40) 70(40) -60(40)
C(6) 540(50) 400(50) 280(40) -50(40) 10(40) -50(40)
C(7) 590(50) 440(50) 440(50) -60(40) 20(40) -10(40)
C(8) 570(50) 380(50) 510(50) 90(40) -10(40) -80(40)
C(9) 860(60) 400(50) 270(40) -150(40) 90(40) -80(50)
C(10) 690(60) 640(60) 350(50) -100(40) -60(40) 10(50)
C(11) 720(60) 790(70) 360(50) -90(50) 100(40) -180(60)
C(12) 850(70) 620(60) 550(60) 190(50) 0(50) -120(50)
C(13) 710(60) 420(50) 410(50) 20(40) -30(40) 20(40)
N(20) 620(40) 610(50) 760(50) 60(40) 140(40) 80(40)
N(21) 700(50) 690(50) 550(40) 40(40) 130(40) 0(40)
N(22) 650(50) 720(50) 430(40) 20(30) 60(30) 0(40)
C(20) 640(60) 270(50) 670(60) -100(40) 150(50) -40(40)
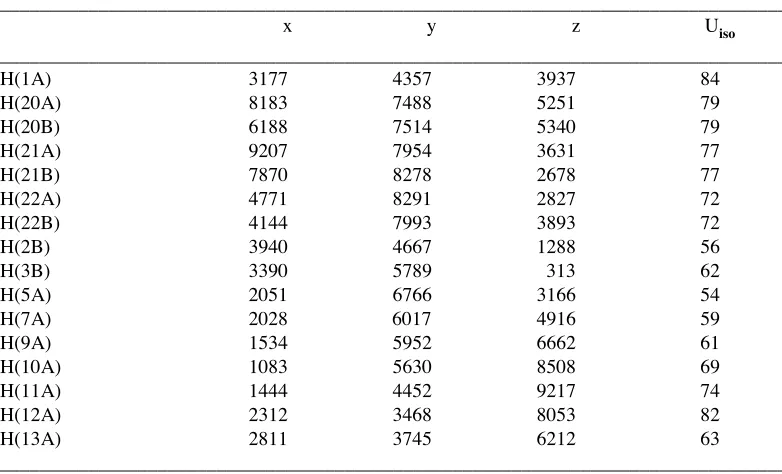
Table 5. Hydrogen coordinates ( x 10
4) and isotropic displacement parameters
(Å
2x 10
3) for JEM1.
________________________________________________________________________________
x y z Uiso
________________________________________________________________________________
H(1A) 3177 4357 3937 84
H(20A) 8183 7488 5251 79
H(20B) 6188 7514 5340 79
H(21A) 9207 7954 3631 77
H(21B) 7870 8278 2678 77
H(22A) 4771 8291 2827 72
H(22B) 4144 7993 3893 72
H(2B) 3940 4667 1288 56
H(3B) 3390 5789 313 62
H(5A) 2051 6766 3166 54
H(7A) 2028 6017 4916 59
H(9A) 1534 5952 6662 61
H(10A) 1083 5630 8508 69
H(11A) 1444 4452 9217 74
H(12A) 2312 3468 8053 82
H(13A) 2811 3745 6212 63
Table 6. Hydrogen bonds for JEM1 [Å and °].
____________________________________________________________________________
D-H...A d(D-H) d(H...A) d(D...A) <(DHA)
____________________________________________________________________________
O(1)-H(1A)...N(1) 0.82 1.81 2.543(7) 147.9
N(20)-H(20A)...O(4)#1 0.86 2.14 2.983(9) 165.5
N(20)-H(20B)...O(3)#2 0.86 2.01 2.868(8) 174.1
N(21)-H(21A)...O(2)#1 0.86 2.10 2.928(8) 162.9
N(21)-H(21B)...O(1)#3 0.86 2.28 3.017(8) 143.3
N(22)-H(22A)...O(3) 0.86 2.31 2.923(7) 128.8
N(22)-H(22B)...O(2)#2 0.86 2.10 2.947(8) 169.6
____________________________________________________________________________ Symmetry transformations used to generate equivalent atoms:
![Table 3. Bond lengths [Å] and angles [°] for JEM1._______________________________________________________________________________](https://thumb-us.123doks.com/thumbv2/123dok_us/789435.1092037/5.612.108.492.110.700/table-bond-lengths-a-and-angles-jem.webp)
![Table 6. Hydrogen bonds for JEM1 [Å and °].____________________________________________________________________________](https://thumb-us.123doks.com/thumbv2/123dok_us/789435.1092037/8.612.109.485.110.232/table-hydrogen-bonds-jem-a-and.webp)


