Development of Polarization Interferometer Based on Fourier
Transform Spectroscopy for Thomson Scattering Diagnostics
T. HATAE, J. HOWARD
1), Y. HIRANO
2), O. NAITO, M. NAKATSUKA
3)and H. YOSHIDA
3)Fusion Research and Development Directorate, Japan Atomic Energy Agency, Naka 311-0193, Japan
1)Plasma Research Laboratory, The Australian National University, Canberra ACT 0200 Australia 2)National Institute of Advanced Industrial Science and Technology, Tsukuba 305-8568, Japan
3)Institute of Laser Engineering, Osaka University, Suita 565-0871, Japan
(Received 11 December 2006/Accepted 24 April 2007)
A high-throughput polarization interferometer is being developed to demonstrate for the first time the utility of Fourier transform spectroscopy for Thomson scattering diagnostics of high temperature plasma. Target Teand
neranges for the prototype polarization interferometer are<1 keV and>5×10¹⁸m−3, respectively. This paper
describes the design of the polarization interferometer and the results of initial tests.
c
2007 The Japan Society of Plasma Science and Nuclear Fusion Research
Keywords: Thomson scattering, Fourier transform spectroscopy, polarization interferometer, JT-60U, TPE-RX DOI: 10.1585/pfr.2.S1026
1. Introduction
Incoherent Thomson scattering [1] that can measure electron temperature Te and density ne profiles simulta-neously is a standard diagnostic in magnetic confinement experiments. Usually grating spectrometers or interference filter polychromators have been used to analyze the scat-tered spectrum. Though these are established methods, the throughput decreases when there are many wavelength channels, while the relative calibration between wave-length channels is necessary.
It is well known that Fourier transform spectrome-ters [2] offer some potential advantages over dispersive systems. Fourier transform spectroscopy is a measurement technique whereby spectra are collected based on mea-surements of the temporal coherence of a radiative source, using time-domain measurements of the electromagnetic radiation or other type of radiation. In general, the main advantages of the Fourier spectroscopy are as follows. (1) The Fourier transform spectrometer (i.e. interferome-ter to measure the temporal coherence) can use the opti-cal system of the high throughput (Jacquinot advantage), (2) Since the Fourier transform spectrometer observe the whole wavelength area at the same time, the S/N ratio is improved (Fellgett advantage). More importantly, for this application, the method can be implemented in a simple and compact, high-throughput system. Optical coherence techniques have been applied successfully for plasma spec-troscopy. In particular, high-throughput, wide field-of view polarization interferometers have been used for Doppler imaging of ion temperature in the H-1 heliac [3–5]. These modulated or static coherence imaging systems monitor the complex coherence (fringe visibility and phase) of an author’s e-mail: [email protected]
isolated spectral line at one or more optical delays. A method based on measurement of the optical coherence of scattered radiation at a fixed optical delay has also been proposed for incoherent Thomson scattering [6]. However, this method has not been demonstrated to date.
To demonstrate this method, we are developing a Fourier filter for Thomson scattering based on a fixed delay polarization interferometer. Proof-of-principle tests will be carried out in TPE-RX reversed-field pinch (RFP) machine (Major radius 1.72 m, Minor radius 0.45 m, Plasma current 0.5 MA, Te (0)∼1 keV, pulse duration 100 ms) [7], using the existing single channel YAG laser Thomson scattering system.
This paper describes the design of a prototype polar-ization interferometer and results of initial tests.
2. Polarization Interferometer
Based on Fourier Transform
Spectroscopy
The polarization interferometer is composed of a bire-fringent plate of fixed optical delay sandwiched between polarizers. When the light is observed through this inter-ferometer, interference fringes appear at infinity due to Fresnel-Arago law. Thomson scattered radiation that tra-verses the first polarizer is incident on a birefringent plate whose fast axis is oriented at 45◦ to the polarization di-rection. The plate splits the incident scattered scalar wave component, relatively delaying nominally equal amplitude components by timeτbefore they recombine at a final po-larizer and are focused on to a detector. The orthogonally polarized outputs at the final polarizing splitter form com-plementary, or antiphase interferometric images of the in-put radiation. By suitably choosing the optical delay, these
c
2007 The Japan Society of Plasma
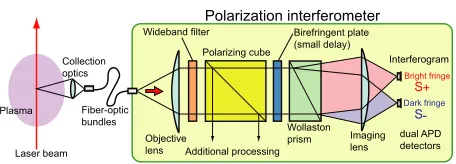
Fig. 1 Schematic of a polarization interferometer for Thomson scattering diagnostics.
independent outputs provide sufficient information to de-termine both the electron temperature and density.
A schematic of the polarization interferometer for Thomson scattering diagnostics is shown in Fig. 1. Scat-tered light is collected and introduced to the polarization interferometer through a fiber-optic bundle. This polariza-tion interferometer consists an objective lens as the fiber coupling optics, a band pass filter, a polarizer, a bire-fringent plate which gives optical path delay, a Wollaston prism, an imaging optics to detector, and dual APD (sili-con avalanche photodiode) detectors. Generally, the polar-ization interferometer is simple and low cost compared to the conventional polychromator.
The intensity of the transmitted light is proportional to S±(τ)= I0
2
1± γ˜(τ), (1)
where I0 is the spectrally integrated irradiance, and ˜γis
the complex coherence. In general, the complex temporal coherence is related to the spectral distribution of the irra-diance I(ν) through the Wiener-Khinchine theorem
˜
γ(τ)= 1 I0
∞
−∞I(ν) exp(i2πντ)dν (2)
Here, I0is the spectrally integrated light intensity. The
interferometric phase delay can be approximated by
φ=2πντ(ν)≈φ0+κφ0ξ (3)
where we have substituted ν = ν0(1+ξ), where ξ =
(ν−ν0)/ν0 is a normalized frequency difference
coordi-nate,φ0 = 2πν0τ0: interferometric phase delay, whereτ0
is the center-frequency time delay,
κ=1+ν0
τ0
∂τ
∂νν0 (4)
accounts for any optical frequency dispersion of the time delay. The interferogram is expressed following equation using Eq. (3) [6].
S±(φ0)=
I0
2
1± γ˜( ˆφ0) exp(iφ0) , (5)
where the optical coherence is given by ˜
γ( ˆφ)= 1 I0
∞
−∞I(ξ) exp(i ˆφξ)dξ (6)
and it is convenient to introduce the group phase delay ˆ
φ0 =κφ0. We can evaluate the poralization interferometer
response analytically in the low temperature case where the scattered spectrum is approximately Gaussian. For electron temperatures less than 1 keV, the spectral dependence of the scattered radiation is well approximated by
IT(ξ; Te)=I0(πξ2th)−
1/2exp(−ξ2/ξ2
th) (7) with
ξth≡2sin(θ/2)vth, (8)
and whereθis the angle between the incident and scattered wavevectors, Teis the electron temperature and vth is the electron thermal speed normalized to the speed of light. Because the spectrum is a function only a single parameter, measurement of the coherence at a single fixed delay offset
φ0is sufficient to obtain Te.
The normal-incidence time delay introduced by a bire-fringent crystal plate of thickness L and birefringence B is
τ0 = LB/c. For radiation of centre frequencyν0, the
in-terferometer signal at either of the final polarizer ports is given by
S±=I0
2(1±ζcosφ0) (9)
whereφ0 =2πν0τ0 =2πN is monochromatic birefringent
phase delay and N is the order of interference. The fringe visibility (fringe amplitude normalized to mean intensity)
ζ=ζIζT includes an instrumental componentζIdue to the average of the birefringent plate delay over the angular ex-tent of the source (analogous to familiar slit function for grating spectrometers) as well as the degradationζT due to the finite source spectral width. The instrument function is determined via a suitable calibration procedure as dis-cussed in section 4.
For a thermal distribution of Te < 1 keV, the fringe visibility associated with the Thomson scattered light takes the simple from
ζT(φ0)=exp[−
φ2
0sin 2(θ/2)v2
th]=exp(−Te/TC) (10) where TCis a ‘characteristic temperature’ set by the wave-plate delay and the scattering angle
kTC= 1 2mec
2/[φ
0sin(θ/2)]2. (11)
Optimum sensitivity to temperature variation is obtained when the optical delay is chosen such that
Te ∼TC, or∆ν/ν0 ∼1/N, where∆ν/ν0is the
Thom-son spectral bandwidth [4].
For low temperatures, the variation of fringe visibility with temperature is best measured by settingφ0/2π=M/2
Fig. 2 Left: Thomson scattered spectra for temperatures in the range of 0.2-1.0 keV. Right: The calculated interfero-grams S+.
this design. The interferogram calculations take into ac-count the wavelength-dependence of quartz birefringence and, for now, assume the spectrum to be ideally passed by the wideband filter. At a zero crossing, the scattered signals at the complementary output ports are
S±= I0
2[1±ζT], (12)
whereζT(φ0) is the Thomson spectrum fringe visibility at
delayφ0 =Mπ. The signals derived from both the
orthog-onally polarized light components produced by the final Wollaston prism are then sufficient to determine the total scattered power and the visibility degradation due to the Doppler broadening:
ζT =
S+−S−
S++S−. (13)
3. Design of Polarization
Interferome-ter for Proof-of-Principle Tests
Proof-of-principle tests will be carried out in TPE-RX using the existing YAG laser Thomson scattering system [7]. Therefore, parameters for design of a prototype polar-ization interferometer are fixed as follows: Te ≤ 1 keV, ne ≥5×10¹⁹m−3, scattering angle 90◦, YAG laser
wave-length 1064 nm. Thomson spectra and their associated in-terferograms for Te=0.2, 0.4, 0.6, 0.8, 1.0 keV are shown in Fig. 2. To reject stray light by the YAG laser and reduce plasma background light, the wideband filter is placed at the entrance of the polarization interferometer. Wavelength range of the wideband filter will be 880-1060 nm, with blocking ratio 10−6. Variations of fringe visibilityζ
T with electron temperature for the quartz plate thickness=0.545, 0.550, 0.555 mm are shown in Fig. 3. Based on these cal-culations, a thickness of 0.555 mm will deliver a sensitive variation of fringe visibility with electron temperature as shown in Fig. 3.
4. Calibration Methods
The interferogram depends on both the nature of the scattered spectrum I(ν) as well as the overall system com-plex spectral response R(ν) which includes the angular de-pendence of the time delay (generally a small effect) as
Fig. 3 Variations of fringe visibility ζT with temperature for
three quartz plate thicknesses (0.545, 0.550, 0.555 mm).
Fig. 4 Schematic of spectral transmissivity measurement.
well as the spectral response of the collection and process-ing optics and detection system. In this case we write the normalized fringe amplitude asζ =( ˜γ) and complex co-herence as
˜
γ= 1
I0
∞
0
R(ν)I(ν)dλ. (14)
One means to determine the unknown response R(ν) would be measure the variation of the normalized fringe ampli-tudeζBB =( ˜γBB) for blackbody radiation as a function of the source temperature. For a given temperature Tj, Eq. (8) can be discretized in term of the unknown spectral re-sponse coefficients Ri≡R(vi) as
ζBB(Tj)=
i
(IBB)jiRi, (15)
for calibration. Generally, spectral sensitivity of the APD is used data provided by the maker. For the absolute den-sity calibration, we consider Rayleigh scattering or Raman scattering calibration employing N2gas [8].
5. Initial Test using a Blackbody
Ra-diation Source
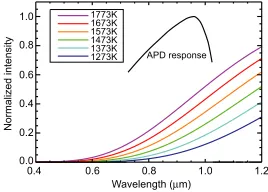
When the temperature of the blackbody is changed from 1273 K to 1773 K (1000-1500◦C), the spectrum changes as shown in Fig. 5. LAND R1500T as the black-body radiation source is used for this test. The fringe visi-bility for the blackbody temperatures in this range, and in the bandpass 750 nm-1000 nm, is calculated and plotted in Fig. 6 (solid line). To obtain a sensitive variation with tem-perature we used two crossed quartz waveplates having a measured effective thickness of 0.1293 mm. Fringe visibil-ities for blackbody temperature in the range 1273-1773 K produced by the polarization interferometer are measured using two APD detectors, and the value ofζis calculated using equation (7). The error bars are calculated taking into account the estimated 1mV uncertainty on the voltage lev-els. To fit ideal curve with experimental values, an arbi-trary offset of value 0.11 in the visibility is required to be added to experimental values as shown in Fig. 6. The ef-fective centre wavelength has to shift to the blue to account for this additional offset. Because most of the power from the blackbody radiation source is in the near infrared, the effective wavelength of the light in the APD passband is sensitive to the details of the APD responsivity. Moreover,
Fig. 5 Spectra of blackbody radiation source for temperatures in the range of 1273-1773 K.
Fig. 6 Variations of fringe visibility ζ with temperature for a quartz plate thickness (0.1293 mm). The calculated fringe visibility (solid curve) is compared to experimental values (triangle).
the interferometer instrumental fringe visibility degrades near 1000 nm due to the inefficiency of the first film polar-izer. This will give rise to a blue bias, though we have not attempted to account for this numerically. The important point is that the magnitude of the change in fringe visibil-ity agrees with the numerical calculation. This result con-firms that, following suitable calibration, we will be able to sense visibility changes due to changes in the electron temperature.
6. Discussion and Future Plan
Based on results obtained using the prototype system, a high-throughput polarization interferometer has been de-signed for proof-of-principle tests. Target Teand neranges of the prototype polarization interferometer are< 1 keV and>5×10¹⁸m−3, respectively.
There are two remaining issues. The first issue is er-ror analysis for Te and ne. The second issue is an effect of background radiation (i.e. plasma light). These will be considered in a later paper.
Regarding future plans, proof-of-principle tests will be carry out in TPE-RX reversed-field pinch (RFP) ma-chine in 2007. Incorporating improvements based on the results at TPE-RX, a new polarization interferometer will be designed for the JT-60U Thomson scattering system [9–11]. For this system we will consider (1) wider range of Te (Te < 40 keV), (2) an imaging polarization inter-ferometer for multi-spatial channel measurement (Maxi-mum 20 spatial points), (3) using YAG laser (50 Hz, 7.46 J, 1064 nm) [11] or ruby laser (0.5 Hz, 10 Hz, 694.3 nm) [12]. In the case of ruby laser, a high sensitivity CCD camera is available. After tests in TPE-RX and JT-60U, this diag-nostic technique will be proposed for ITER and JT-60SA Thomson scattering system.
In this diagnostic technique, Teand necan be directly determined from fringe visibilityζT measurement without iterative calculations. Since Teand necan be measured at high speed, this technique is can be applied to real time monitor. When this technique for monitor of real time feed back control is used, an application to real time profiles control for Teand neis possible.
Acknowledgments
The Authors are grateful to Mark Gwynneth for his technical assistance in initial test at ANU. This work is supported in part by Grant-in-Aid for Scientific Re-searches on Priority Area “Advanced diagnostics for burn-ing plasma” from Ministry of Education, Culture, Sports, Science and Technology (No. 18035016).
[1] J. Sheffield, Plasma Scattering of Electromagnetic Radia-tion (Academic press, New York, 1975) p.191.
[2] K.D. M¨oller, Optics (University Science Books, Mill Val-ley, 1988) p.311.
Instrum. 72, 888 (2001).
[4] J. Howard, Appl. Otp. 41, 197 (2002).
[5] J. Howard, C. Michael, F. Glass and A. Danielsson, Plasma Phys. Control. Fusion 45, 1143 (2003).
[6] J. Howard, Plasma Phys. Control. Fusion 48, 777 (2006). [7] H. Koguchi, Y. Hirano, H. Sakakita et al., preprint of 21st
IAEA Fusion Energy Conference, IAEA-CN-149/EX/P3-8 (2006).
[8] J. Howard, B. James and W. Smith, J. Phys. D: Appl. Phys.,
1435 (1979).
[9] T. Hatae, A. Nagashima, T. Kondoh et al., Rev. Sci. In-strum. 70, 772 (1999).
[10] T. Hatae, M. Nakatsuka and H. Yoshida, J. Plasma Fusion Res. 80, 870 (2004).
[11] T. Hatae, O. Naito, M. Nakatsuka and H. Yoshida, Rev. Sci. Instrum. 77, 10E508 (2006).

![Crystal structures of an imidazo[1,5 a]pyridinium based ligand and its (C13H12N3)2[CdI4] hybrid salt](data:image/gif;base64,R0lGODlhAQABAIAAAP///wAAACH5BAEAAAAALAAAAAABAAEAAAICRAEAOw==)