VALIDATION OF THE PHYSICAL WORKING CAPACITY
AT THE FATIGUE THRESHOLD TREADMILL TEST
Clayton L. Camic, Chelsea J. Hahn, Benjamin C. Hendrickson, and Andrew R. Jagim
Human Performance Laboratory, Exercise and Sport Science,
University of Wisconsin-La Crosse, La Crosse, USA
Original scientific paper UDC: 796.422:519.2
Abstract:
The purposes of the present study were twofold: 1) to determine the physical working capacity at the fatigue threshold (PWCFT) during an incremental treadmill test, and 2) to examine the validity of this fatigue threshold through constant-velocity runs to exhaustion at 90, 100, and 110% of the estimated PWCFT.Twelve aerobically-trained males (mean age±SD=24.6±5.4 years, running volume=69.9±46.0 km·wk-1, n=9) and females (22.3±2.3 years, 45.6±4.6 km·wk-1, n=3) volunteered to perform a treadmill test to exhaustion with electromyographic (EMG) signals recorded from the m. vastus lateralis on four separate visits. The first visit required each subject to complete an incremental treadmill test to exhaustion for determination of their PWCFT. During the second, third, and fourth visit, the subjects completed a treadmill run to exhaustion at a constant velocity that corresponded to 90, 100, or 110% of their PWCFT in random order. The linear regression analyses indicated there were no significant (p>.05) changes in muscle activation (i.e. EMG amplitude) across time to exhaustion during the constant velocity runs at 90% (60.00±0.00 min) and 100% (48.86±14.59 min) PWCFT, but significant (p<.05) increases occurred at 110% PWCFT (19.44±10.26 min). Thus, the findings of the present study indicated that the PWCFT treadmill test was able to accurately estimate the fastest running velocity that could be maintained for an extended period of time without evidence of neuromuscular fatigue.
Key words: muscle activation, EMG amplitude, running, PWCFT
Introduction
Theoretically, the physical working capacity at the fatigue threshold (PWCFT) treadmill test estimates the fastest running velocity that can be maintained for an extended period of time without evidence of neuromuscular fatigue (Camic, Kovacs, Enquist, VanDusseldorp, & Hill, 2014). Derived from the original PWCFT model of deVries et al. (1990) used for cycle ergometry, the PWCFT tread-mill test is based on within-stage increases in
elec-tromyographic (EMG) amplitude that reflect
fatigue-induced increases in muscle activation required to
maintain the desired running velocity. Specifically,
this protocol involves recording six 10-second EMG epochs (10-20, 30-40, 50-60, 70-80, 90-100, and 110-120 seconds) during each two-minute stage of a treadmill test to exhaustion that incrementally increases in velocity with the grade remaining constant (1%). The EMG amplitude values associ-ated with these 10-second epochs are then plotted across time for each stage (i.e. running velocity)
and the slope coefficient of this relationship is tested for significance. The PWCFT is then defined as the average of the highest running velocity that results
in a non-significant (p>.05) slope coefficient and the lowest running velocity that results in a significant
(p<.05) positive slope coefficient.
The onset of neuromuscular fatigue determined by the PWCFT treadmill test has been demonstrated to occur at the same running velocity (14.0±2.3
km∙hr-1) and to be significantly correlated (r=0.70) with the respiratory compensation point (14.0±1.8
km∙hr-1) in aerobically-trained subjects (n=15)
(Camic, et al., 2014). These findings (Camic, et al.,
2014) suggested that the PWCFT treadmill test, like the respiratory compensation point, can be used to identify the boundary between the heavy and severe domains of exercise intensity which repre-sents the maximal exercise intensity that can be maintained with oxygen uptake and lactate still reaching a steady state (Gaesser & Poole, 1996). For example, the respiratory compensation point
defined by Beaver, Wasserman, and Whipp (1986)
1988; Poole, Ward, & Whipp, 1990) that constant intensity exercise above this threshold (i.e. within the severe domain) is only sustainable for up to 20 minutes (mean±SD time: pre-training=17.7±1.2 min; post-training=17.1±1.3 min). Ribeiro et al. (1986), however, illustrated that constant intensity exercise at this threshold (i.e. the border between heavy and severe) can be maintained for at least 40
minutes. Although these findings (Beaver, et al.,
1986; Camic, et al., 2014; Gaesser & Poole, 1996; Poole, et al., 1988, 1990; Ribeiro, et al., 1986) provide a physiological basis for the PWCFT model as a fatigue threshold to identify sustainable exer-cise intensities during treadmill running, this test has yet to be validated through constant-velocity runs to exhaustion below, at, and above the esti-mated PWCFT. If valid, potential uses for the PWCFT treadmill test include both the athletic perfor-mance and rehabilitative applications as during cycle ergometry (Camic, et al., 2010b; deVries, et al., 1989; Emerson, et al., 2014; Jenkins, et al., 2014; Stout, et al., 2007a, 2007b, 2015; Zak, et al.,
2015) that includes assessing physical fitness,
evalu-ating the effectiveness of conditioning programs and nutritional supplements, prescribing exercise training intensities, and examining factors related
to neuromuscular function in the elderly. Based
on these practical applications and popularity of running, an examination into the validity of the PWCFT treadmill test is warranted. Therefore,
using the validation method of Briscoe, Forgach,
Trifan, and Malek (2014) for the PWCFT during cycle ergometry, the purposes of the present study were twofold: 1) to determine the PWCFT during an incremental treadmill test, and 2) to examine the validity of this fatigue threshold through constant-velocity runs to exhaustion at 90, 100, and 110% of the estimated PWCFT. We hypothesized that: 1) the constant velocity runs to exhaustion at 90 and 100% PWCFT would result in no significant changes in muscle activation across time to exhaustion (TTE)
(i.e., a non-significant slope coefficient for the EMG
amplitude versus TTE relationship), whereas there
would be significant fatigue-induced increases in
muscle activation at 110% PWCFT (i.e., a positive
slope coefficient for the EMG amplitude versus TTE
relationship); and 2) the TTE values for 90, 100, 110% PWCFT would be approximately ≥60, 40-60,
and ≤30 minutes, respectively.
Methods
Subjects
Twelve aerobically-trained males (mean age±SD=24.6±5.4 years, body mass=77.5±10.0 kg, body height=181.7±8.3 cm, running volume=69.9±46.0 km·wk-1, n=9) and females (22.3±2.3 years, 59.9±11.9 kg, 170.3±11.8 cm, 45.6±4.6 km·wk-1, n=3) volunteered to participate
in this investigation. These subjects were selected based on their diverse running backgrounds that included regular participation in recreational races (i.e. 5K, 10K) (n=3), marathons (n=5), ultramara-thons (n=2), and triathlons (n=2). Each subject visited the laboratory on four occasions (separated by at least 48 hours), had prior familiarization with treadmill running, and was instructed to: 1) main-tain normal dietary habits and sleep patterns during the course of the study, and 2) avoid exercise for 48 hours, caffeine and alcohol for 24 hours, and food intake for three hours prior to each visit. The study was approved by the University Institutional
Review Board for Human Subjects and all subjects
completed a health history questionnaire and signed a written informed consent prior to testing. Incremental Treadmill Test (Visit 1)
During the first laboratory visit, each subject
performed an incremental treadmill (Fitnex Fitness Equipment, Inc., Dallas, TX) test to exhaustion for determination of their PWCFT. This test involved a
warm-up of walking at 6.4 km∙h-1 for five minutes.
Subjects were also provided five minutes to perform
3-4 short strides at a self-selected intensity. Imme-diately following the warm-up, the test began at 9.0
km∙hr-1 and increased 1.0 km∙hr-1 every two minutes until volitional cessation. This stage increment of
1.0 km∙hr-1 was modified from 1.6 km∙hr-1 of the original protocol (Camic, et al., 2014) to increase the precision of estimating PWCFT in the current sample. The grade remained constant at 1.0% during the test and was selected to represent the energy cost that is typically experienced by running outdoors (Jones & Doust, 1996). The subjects were strongly encouraged during the test to achieve the longest exercise time possible. Each subject was
also fitted with a Polar Heart Watch system (Polar
Electro Inc., Lake Success, NY) to monitor heart rate throughout the test. The maximal test was deemed valid if all three of the following criteria were attained: 1) 90% of age-predicted maximal heart rate, 2) rating of perceived exertion (RPE)
≥18, and 3) volitional cessation due to fatigue. The
highest heart rate value achieved during this test
was defined as peak heart rate (HRpeak) for the study.
Determination of PWCFT
The PWCFT values were determined using
the model of deVries et al. (1990). Specifically,
during each two-minute stage of the incremental treadmill test, six 10-second EMG samples were selected from the signal (10-20, 30-40, 50-60, 70-80, 90-100, 110-120 seconds). The EMG ampli-tude (microvolts root mean square, µVrms) values were calculated for each of the 10-second epochs
(MATLAB, Mathworks) and plotted across time
PWCFT was then determined by averaging the highest running velocity that resulted in a
non-significant (p>.05, single-tailed
t-test) slope coefficient for the
EMG amplitude versus time relationship, with the lowest running velocity that resulted
in a significant (p<.05) positive slope coefficient (Table 1).
Runs to exhaustion at 90, 100, and 110% PWCFT
(Visits 2-4)
During the second, third, and fourth laboratory visits, each subject ran on the
tread-mill to volitional fatigue at a constant velocity that corresponded to 90, 100, or 110% of their PWCFT in random order. The constant velocity runs began
with a warm-up that involved walking at 6.4 km∙hr-1
and 1.0% grade for five minutes, followed by a
5-minute jog that corresponded to 50% of their PWCFT. Subjects were also provided five minutes to perform 3-4 short strides at a self-selected inten-sity. After the warm-up, the subjects ran on the treadmill at the constant velocity that corresponded to 90, 100, or 110% of their PWCFT with the grade remaining at 1.0%. The subjects were encouraged to maintain this running velocity for as long as possible or until they could no longer safely main-tain their stride. The time duration of 40-60 minutes
was defined a priori as an extended period of time based on the time limits of constant intensity exer-cise at the upper limit of the heavy exerexer-cise inten-sity domain (Gaesser & Poole, 1996; Ribiero, et al., 1986). If the 60-minute time point was reached prior to volitional fatigue, the test was terminated at this point. Verbal encouragement was provided to the subjects throughout each test. During the runs to exhaustion, 60-second EMG samples were selected from the signal (0-60, 60-120, 120-180, … seconds) for the duration of the test. The EMG amplitude values were calculated for each of these 60-second epochs and separately plotted across the total time duration of each test.
EMG measurements and signal processing
During all laboratory visits, a bipolar (10 mm center-to-center) wireless surface electrode sensor (Tringo Wireless EMG, Delsys Inc., Natick, MA) was placed on the right thigh over the vastus later-alis muscle according to the recommendations of the SENIAM Project (Hermens, et al., 1999) and secured with multipurpose prewrap tape (Mwrap®, Mueller Sports Medicine, Inc., Prairie du Sac, WI). Prior to electrode placement, the skin at the
elec-trode site was shaved, carefully abraded with gauze, and cleaned with alcohol. The EMG signals were
amplified (gain: x1000) (Tringo Wireless EMG,
Delsys Inc., Natick, MA,bandwidth=20-450 Hz), sampled at 2000 Hz, recorded continuously throughout each test, and stored in a personal computer (Latitude E6540, Dell, Inc., Round Rock, TX) for subsequent analyses. All signal processing was performed using custom programs, which were
written with MATLAB programming software
(version 8.2, Mathworks, Natick, MA). The EMG
signals were digitally bandpass filtered (fourth-order Butterworth) at 20-450 Hz.
Statistical analyses
The EMG amplitude values for each subject were normalized to the highest value attained during each of the constant velocity runs. In addi-tion, the TTE for each subject during each constant velocity run was normalized to the total time dura-tion of the test. The reladura-tionships for normalized EMG amplitude versus normalized TTE for each subject and velocity were examined using linear regression (SPSS software program, Chicago, IL). Four separate one-way repeated-measures ANOVAs were used to determine whether there were
signi-ficant mean differences in running velocity, TTE, final-minute RPE, and final-minute %HRpeak at 90, 100, and 110% PWCFT. When appropriate, follow-up analyses included paired t-tests with Bonfer -roni correction (0.05/3=0.0167). An alpha of p<.05
was considered statistically significant for the linear
regression and ANOVA analyses.
Results
Mean±SD values were calculated for the PWCFT, RPE, and HRpeak values attained during the incre-mental test to exhaustion as well as the running
velocity, TTE, final-minute RPE, and final-minute
%HRpeak values achieved during the constant veloci-ties runs to exhaustion at 90, 100, and 110% PWCFT
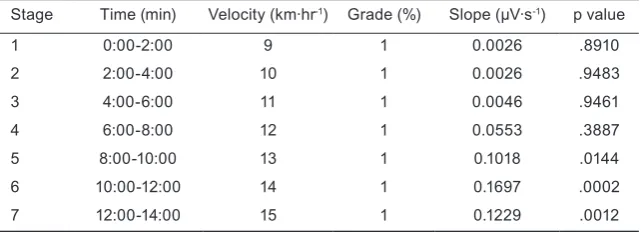
Table 1. Example of the method used for the determination of the physical working capacity at the fatigue threshold (PWCFT) treadmill test
Stage Time (min) Velocity (km∙hr-1) Grade (%) Slope (µV∙s-1) p value
1 0:00-2:00 9 1 0.0026 .8910
2 2:00-4:00 10 1 0.0026 .9483
3 4:00-6:00 11 1 0.0046 .9461
4 6:00-8:00 12 1 0.0553 .3887
5 8:00-10:00 13 1 0.1018 .0144
6 10:00-12:00 14 1 0.1697 .0002
7 12:00-14:00 15 1 0.1229 .0012
Note. The PWCFT (12.5 km·hr-1) in this example was determined by averaging the highest
running velocity (12 km·hr-1) that resulted in a non-significant (p>.05) slope coefficient for
the EMG amplitude versus time relationship, with the lowest running velocity (13 km·hr-1)
(Table 2). The results indicated there were signifi -cant mean differences among the running velocities associated with 90, 100, and 110% PWCFT (Table 2).
In addition, TTE was significantly shorter during
the 110% PWCFT run to exhaustion compared to 90 and 100% (Table 2). Individually, ten of the 12 subjects (83.3%) were able to maintain the running velocity associated with 100% PWCFT for at least 40 minutes, whereas only one of the subjects (8.33%) was able to maintain 110% PWCFT for more than 30 minutes. All subjects maintained 90% PWCFT for 60 minutes. Final-minute RPE and %HRpeak values
were significantly lower during the 90% PWCFT run to exhaustion compared to 100 and 110% (Table 2). For the nine individuals that were able to main-tain 100% PWCFT for ≥40 minutes or 110% PWCFT
for ≤30 minutes, the normalized EMG amplitude
versus normalized TTE relationships resulted in
non-significant slope coefficients during the runs
to exhaustion at 90 and 100% PWCFT, but a
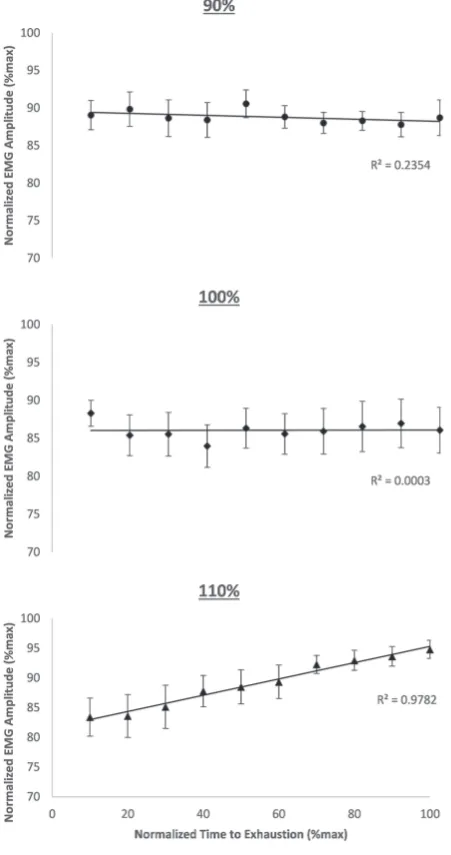
signif-icant slope coefficient at 110% PWCFT (Figure 1).
Discussion and conclusions
The main finding of the present study indicated
that the PWCFT treadmill test was a valid model for estimating the fastest running velocity that could be maintained without evidence of neuromus-cular fatigue in the majority (75%) of our subjects.
Specifically, 10 of the 12 subjects (83%) were able
to maintain the running velocity associated with 100% PWCFT for at least 40 minutes, whereas 11 of the 12 subjects (92%) were not able to maintain 110% PWCFT for more than 30 minutes (Table 2). All 12 subjects were able to maintain 90% PWCFT for 60 minutes (Table 2). In addition, the composite
data (i.e. slope coefficients) for the normalized EMG
amplitude versus normalized TTE relationships
were non-significant at 90 and 100% PWCFT, but
significant at 110% PWCFT (Figure 1). These find -ings suggested that the constant velocity runs to exhaustion at 90 and 100% PWCFT resulted in a no
significant change in muscle activation across time,
Figure 1. The composite data (mean±SE) for the normalized EMG amplitude across normalized time to exhaustion at 90, 100, and 110% of the PWCFT. The slope coefficients for
the normalized EMG amplitude versus normalized time to exhaustion relationships were not significantly (p>.05) greater than zero at 90 and 100% PWCFT, but were significantly
(p<.05) greater than zero at 110% PWCFT.
Table 2. Running velocities, heart rate, rating of perceived exertion, and time to exhaustion values during the PWCFT
treadmill test (Visit 1) and constant velocity runs to exhaustion (Visits 2-4)
Variables Mean±SD
Visit 1
Maximal running velocity (km·hr-1) 16.0±1.8
Peak heart rate (beats·min-1) 186.4±9.5
Maximal RPE (6-20) 19.3±1.0
Visits 2-4 90% PWCFT
Running velocity (km·hr-1) 11.6±1.5
Time to exhaustion (min) 60.00±0.00
Final heart rate (%HRpeak) 91.2±3.8†
Final RPE (6-20) 14.3±2.6†
100% PWCFT
Running velocity (km·hr-1) 13.0±1.6
Time to exhaustion (min) 48.86±14.59
Final heart rate (%HRpeak) 95.6±4.6
Final RPE (6-20) 17.8±2.3
110% PWCFT
Running velocity (km·hr-1) 14.3±1.8
Time to exhaustion (min) 19.44±10.26*
Final heart rate (%HRpeak) 98.7±3.8
Final RPE (6-20) 19.1±1.1
*Significantly (p<.05) different from 90% and 100% PWCFT
whereas there were significant fatigue-induced
increases in muscle activation at 110%. Therefore, the PWCFT treadmill test was able to accurately identify the fastest non-fatiguing running velocity (i.e. 100% PWCFT) that could be maintained for an extended period of time in nine (75%) subjects, but overestimated this threshold in two (17%) subjects and underestimated in one subject (8%).
For the two subjects that were not able to main-tain 100% PWCFT for at least 40 minutes (18.63 and
25.08 minutes), their final-minute %HRpeak values were 95% at the 60-minute time point during their constant velocity runs at 90% PWCFT. In addition, one subject that was able to maintain 110% PWCFT for more than 30 minutes (44.50 min) exhibited a
final-minute %HRpeak of 97% during their constant velocity run at this intensity. Thus, the PWCFT tread-mill test over- or underestimated the fastest running velocity that could be maintained by approximately 10% in these three subjects. The reason for this 10% error remains unclear, but may be attributable to
differences in training regimens. Specifically, two
of the three subjects were triathletes whose aerobic capacities and neuromuscular strategies have been developed using additional forms of training other than running alone (i.e. cycling and swimming). It is possible that these factors partially contributed to the 10% error found in these subjects and that the PWCFT treadmill test may exhibit approximately ±10% error for estimating the running velocity associated with neuromuscular fatigue in triath-letes. Future studies should further examine the validity of the PWCFT model for predicting fatiguing versus non-fatiguing running velocities in aerobi-cally-trained individuals that include multiple forms of exercise into their training regimen.
Based on the findings of previous investiga -tions (Camic, et al., 2014; Poole, et al., 1988, 1990; Ribeiro, et al., 1986), we hypothesized that the running velocities associated with 90, 100, and 110% PWCFT could be maintained for
approxi-mately ≥60, 40-60, and ≤30 minutes, respectively.
In the present study, the running velocity at 100% PWCFT was sustained for 48.86±14.59 minutes
with the final-minute %HRpeak and RPE values of 95.6±4.6% and 17.8±2.3, respectively (Table 2). Ribeiro et al. (1986) has shown that constant intensity exercise at the border between the heavy and severe domains is maintainable for at least 40 minutes and results in %HRpeak values that exceed 90%. Thus, these TTE, RPE, and %HRpeak values suggested that the subjects in the present study were at the upper limit of the heavy domain of exercise intensity during the 100% PWCFT constant velocity run to exhaustion and were at or near their maximal
level of exertion at completion. These findings were
also consistent with those of Camic et al. (2014) that indicated the PWCFT during treadmill running occurs at the respiratory compensation point that
demarcates the boundary between the heavy and severe domains of exercise intensity.
Previous investigations (Poole, et al., 1988, 1990; Ribeiro, et al., 1986) have shown that contin-uous exercise within the severe domain results in both oxygen uptake and blood lactate values failing to stabilize and subsequently reaching maximal levels, thereby leading to volitional fatigue within 20 minutes. For example, Poole et al. (1988, 1990) illustrated that constant intensity exercise within the severe domain results in TTE values of approxi-mately 17-18 minutes, independent of training status. In the present investigation, the TTE (19.44±10.26
min), final-minute RPE (19.1±1.1), and final-minute
%HRpeak (98.7±3.8%) values during the constant velocity run to exhaustion at 110% PWCFT suggested this intensity was within the severe domain (Table 2). Furthermore, the increase in running velocity from 100 to 110% PWCFT resulted in an average decrease in TTE by -29.42±10.20 minutes and indicated that the intensity associated with 110% PWCFT surpassed the threshold for a sustainable level of muscle activation. The constant velocity run to exhaustion at 90% PWCFT, however, resulted
in the TTE, final-minute RPE, and final-minute
%HRpeak values of 60.00±0.00 minutes, 14.3±2.6, and 91.2±3.8%, respectively. These values during the 90% PWCFT constant velocity run to exhaus-tion at the 60-minute time point suggested that this intensity was within (or below) the heavy domain, resulted in a constant level of muscle activation,
and could have been maintained for significantly
longer, depending on training level.
Recently, Briscoe et al. (2014) examined
the validity of the PWCFT test as a neuromus-cular fatigue threshold for identifying the highest sustainable non-fatiguing power output during
cycle ergometry. This validation method (Briscoe,
et al., 2014) involved determination of the PWCFT followed by constant workload rides to exhaus-tion at 70, 100, and 130% of the estimated PWCFT.
The authors (Briscoe, et al., 2014) illustrated that
the workouts to exhaustion at 70 and 100% of the PWCFT resulted in no significant (p>.05) increases in EMG amplitude (i.e. muscle activation) across TTE (mean±SD=60.0±0.0 min and 47.2±4.1 min,
respectively), whereas a significant (p<.05) EMG
vali-dation method of Briscoe et al. (2014), but modi
-fied the exercise intensities below and above the
estimated PWCFT from 70 and 130% to 90 and 110%. This adjustment was completed to increase the precision in validation because it is unlikely that using running velocities associated with 70 and 130% of the PWCFT would provide a suitable range for comparison. In fact, running veloci-ties associated with 70 and 130% of the estimated PWCFT (100%=13.0±1.6 km·hr-1) would have yielded values of 9.1±1.1 and 16.8±2.1 km·hr-1, respectively, compared to the intensities used in the present study (90%=11.6±1.5 km·hr-1 and 110%=14.3±1.8 km·hr-1).
This modification allowed for running velocities
of approximately ±1.35 km·hr-1 (±10%) from 100% PWCFT versus ±3.85 km·hr-1 (±30%) using 70 and 130%. In addition, it has been demonstrated that the PWCFT during cycle ergometry identifies the boundary between the moderate and heavy domains of exercise intensity (Camic, et al., 2010a), whereas the PWCFT during treadmill running demarcates the heavy from severe domains (Camic, et al., 2014). This difference in exercise intensities associated with the PWCFT may be explained by the aerobi-cally-trained runners participating in the present study and those used by Camic et al. (2014) for the
treadmill test versus previous studies (Briscoe, et
al., 2014; Camic, et al., 2010a) that recruited recrea-tionally-active subjects for the cycle ergometry test, who may not have been accustomed to performing that type of exercise. Collectively, however, the
findings of the present study and those of Briscoe
et al. (2014) demonstrated that the PWCFT serves as a valid tool for estimating the maximal running velocity and power output than can be sustained for an extended period of time without
fatigue-induced increases in muscle activation as indicated by changes in EMG amplitude.
In summary, the PWCFT treadmill test was able to identify the highest non-fatiguing running
velocity by statistically examining the slope coeffi -cients of the EMG amplitude (i.e. muscle activation) versus time relationships in the majority (75%) of
our subjects. Specifically, the constant velocity runs
to exhaustion at 90, 100, and 110% PWCFT resulted
in the TTE, final-minute RPE, and final-minute
%HRpeak values (Table 2) consistent with exercise intensities within the heavy domain (90% PWCFT), at the border between the heavy and severe domain (100% PWCFT), and within the severe domain (110% PWCFT), respectively. In addition, the normalized EMG amplitude versus normalized TTE
relation-ships were significant at 110% PWCFT, but not at 90 or 100% PWCFT (Figure 1). Thus, the constant
velocity runs to exhaustion resulted in significant
increases in muscle activation across time at 110% PWCFT, but remained constant at 90 and 100% PWCFT. These findings indicated that the PWCFT treadmill test serves as a valid tool for accurately estimating the fastest running velocity that can be maintained for an extended period of time (i.e. 40-60 minutes) without evidence of neuromuscular fatigue. From a practical standpoint, the PWCFT treadmill test can potentially be applied to athletic and clinical populations to identify fatiguing from non-fatiguing running (or walking) velocities, prescribe exercise training intensities based on %PWCFT, determine the effectiveness of training programs and nutritional supplements as
ergo-genic aids, and assess the level of physical fitness
and factors related to neuromuscular function and fatigue in the elderly.
References
Beaver, W.L., Wasserman, K., & Whipp, B.J. (1986). A new method for detecting anaerobic threshold by gas exchange. Journal of Applied Physiology, 60(6), 2020-2027.
Briscoe, M.J., Forgach, M.S., Trifan, E., & Malek, M.H. (2014). Validating the EMGFT from a single incremental cycling
test. International Journal of Sports Medicine, 35(7), 566-570.
Camic, C.L., Housh, T.J., Johnson, G.O., Hendrix, C.R., Zuniga, J.M, Mielke, M., et al. (2010a). An EMG frequency-based test for estimating the neuromuscular fatigue threshold during cycle ergometry. European Journal of Applied Physiology, 108(2), 337-345.
Camic, C.L., Housh, T.J., Zuniga, J.M., Hendrix, C.R., Mielke, M., Johnston, G.O., et al. (2010b). Effects of arginine-based supplements on the physical working capacity at the fatigue threshold. Journal of Strength and Conditioning Research, 24(5), 1306-1312.
Camic, C.L., Kovacs, A.J., Enquist, E.A., VanDusseldorp, T.A., & Hill, E.C. (2014). An electromyographic-based test for estimating neuromuscular fatigue during incremental treadmill running. Physiological Measurement, 35(12), 2401-2413.
deVries, H.A., Brodowicz, G.R., Robertson, L.D., Svoboda, M.D., Schendel, J.S., Tichy, A.M., et al. (1989). Estimating
deVries, H.A., Housh, T.J., Johnson, G.O., Evans, S.A., Tharp, G.D., Housh, D.J., et al. (1990). Factors affecting the estimation of physical working capacity at the fatigue threshold. Ergonomics, 33(1), 25-33.
Emerson, N.S., Fukuda, D.H., Stout, J.R., Robinson, E.H., McCormack, W.P., Scanlon, T.C., et al. (2014). Physical working capacity at fatigue threshold (PWCFT) is associated with sarcopenia-related body composition and
measures of functionality in older adults. Archives of Gerontology and Geriatrics, 59(2), 300-304.
Gaesser, G.A., & Poole, D.C. (1996). The slow component of oxygen uptake kinetics in humans. Exercise and Sport Sciences Reviews, 24, 35-71.
Hermens, H.J., Freriks, B., Merletti, R., Stegeman, D., Blok J., Rau, G., et al. (1999). SENIAM European recommendations for surface electromyography: Results of the SENIAM project. Enschede, The Netherlands: Roessingh Research and Development.
Jenkins, N.D., Buckner, S.L., Baker, R.B., Bergstrom, H.C., Cochrane, K.C., Weir, J.P., et al. (2014). Effects of 6 weeks
of aerobic exercise combined with conjugated linoleic acid on the physical working capacity at the fatigue threshold. Journal of Strength and Conditioning Research, 28(8), 2127-2135.
Jones, A.M., & Doust, J.H. (1996). A 1% treadmill grade most accurately reflects the energetic cost of outdoor running.
Journal of Sports Sciences, 14(4), 321-327.
Poole, D.C., Ward, S.A., Gardner, G.W., & Whipp, B.J. (1988). Metabolic and respiratory profile of the upper limit for
prolonged exercise in man. Ergonomics, 31(9), 1265-1279.
Poole, D.C., Ward, S.A., & Whipp, B.J. (1990). The effects of training of the metabolic and respiratory profile of
high-intensity cycle ergometer exercise. European Journal of Applied Physiology, 59(6), 421-429.
Ribeiro, J.P., Hughes, V., Fielding, R.A., Holden, W., Evans, W., & Knuttgen, H.G. (1986). Metabolic and ventilatory responses to steady state exercise relative to lactate thresholds. European Journal of Applied Physiology, 55(2), 215-221.
Stout, J.R., Cramer, J.T., Zoeller, R.F., Torok, D., Costa, P., Hoffman, J.R., et al. (2007a). Effects of β-alanine
supplementation on the onset of neuromuscular fatigue and ventilatory threshold in women. Amino Acids, 32(3), 381-386.
Stout, J.R., Fragala, M.S., Hoffman, J.R., Robinson, E.H., McCormack, W.P., Townsend, J.R., et al. (2015). C-terminal agrin fragment is inversely related to neuromuscular fatigue in older men. Muscle and Nerve, 51(1), 132-133.
Stout, J.R., Graves, S.B., Cramer, J.T., Goldstein, E.R., Costa, P.B., Smith, A.E., et al. (2007b). Effects of creatine
supplementation on the onset of neuromuscular fatigue threshold and muscle strength in elderly men and women (64-86 years). Journal of Nutrition, Health, and Aging, 11(6), 459-464.
Zak, R.B., Camic, C.L., Hill, E.C., Monaghan, M.M., Kovacs, A.J., & Wright, G.A. (2015). Acute effects of an
arginine-based supplement on neuromuscular, ventilatory, and metabolic fatigue thresholds. Applied Physiology, Nutrition, and Metabolism, 40(4), 379-385.
Submitted: April 25, 2017 Accepted: July 1, 2017
Published Online First: September 20, 2017
Correspondence to: Clayton L. Camic, Ph.D. Assistant Professor Exercise and Sport Science 124 Wittich Hall
University of Wisconsin-La Crosse La Crosse, Wisconsin, USA 54601 Phone: (608) 785-6524