3801
IDENTIFICATION METACOGNITIVE FAILURE
BASED ON THE STATISTICAL REASONING
LEVEL
Abd. Rozak, Toto Nusantara, Subanji, I Made Sulandra
Abstract— This paper describes metacognitive failure based on the level of statistical reasoning level. This research is a qualitative study with a case study strategy. Research participants were 69 college students of Mathematics Education Program Study in East Java Indonesia, who had taken a descriptive statistics course. The results showed that metacognitive failure occurs at the transitional level and quantitative level. Metacognitive blindness occurs because students are not able to see the error in calculating statistical measures and errors in combining two statistical measures, while metacognitive mirage occurs because students ignore statistical measures previously thought.
Index Terms— Metacognitive Failure, Metacognitive blindness, Metacognitive mirage, Statistical Reasoning Level.
—————————— ——————————
1 INTRODUCTION
As students who will deal with a variety of data and information are required to be able to manage, analyze, and conclude the data correctly. These abilities can be developed through studying statistics that have been carried out from basic to higher education. The existence of statistical subjects (descriptive statistics and inferential statistics) in the college curriculum is expected to be able to train and develop students' statistical reasoning skills. Statistical reasoning defined as the way people reason with statistical ideas and make sense of statistical information [1]. However, not all students can understand statistics well, this can be seen from several studies of statistical reasoning level showing that most are still at unsatisfactory levels [2], [3]. The level statistical reasoning level, 1) Idiosyncratic; 2) Transitional; 3) Quantitative, and 4) Analytical [4]. Students‘ reasoning on idiosyncratic level is limited, they usually focus on their own experiences and personal beliefs independent of the data. Students on transitional level start to have reasoning in a quantitative way; however, they are inconsistent while using it. Additionally, a student on this level focuses on only one side of a problem situation. Students on the quantitative level can make multiple quantitative comparisons without approaching issues unrelated to the problem. However, he does not gather the related mathematical ideas. Students on the analytical level are able to establish the relationship among different aspects of a problem, they are able to make valid inferences by using the context [3].
Metacognition refers to the awareness individuals have of their own thinking and their evaluation and regulation of their own thinking [6]. Previous research shows that metacognitive has
an important role in supporting the mathematical problem-solving process. Metacognition is a person's activity in monitoring and regulating their understanding and knowledge. Metacognitive activities occur in response to difficulties or errors in solving problems, students must be able to monitor and regulate the problem-solving process, but in some cases, metacognitive activities do not function properly or fail. Metacognitive activities in the problem-solving process individually, they are allowed to monitor and regulate the process, both success and failure. The failure in the process of monitoring and regulating is called metacognitive failure. Research on metacognitive failure on co-collaborative problem-solving in groups [7], [8], [9], [10].
Newman [11], [12] explained several errors that can occur in the stages of the problem-solving process, namely: 1) reading error, which is an error in reading the problem, errors occur in reading words or sentences or symbols contained in the problem. 2) comprehension error, which occurs in the stage of understanding the problem, where someone misunderstands what is needed/known and is asked in the problem. 3) transformation error, occurs if wrong in interpreting and identifying the appropriate mathematical operations. 4) process skill error, occurs in the stage of implementing the procedure where there is an error in implementing the work procedure or in the calculation. 5) encoding error, occurs when students are wrong in writing the final answer. The difficulties or errors in problem-solving, or a warning to pause or step back and immediately take appropriate action called redflag [7], [13]. Redflag is a trigger for metacognitive activity when a person is aware of certain difficulties in solving problems [10]. Three types of metacognitive failures defined as: 1) metacognitive blindness, 2) metacognitive mirage, and 3) metacognitive vandalism. Metacognitive blindness occurs when a person is unaware, see or acknowledge the occurrence of redflag that occurs, monitoring activities and regulation that are carried out do not help bring up the redflag that occurs. A metacognitive mirage occurs when someone takes action based on redflag that actually does not occur. Metacognitive vandalism when a person is aware of the occurrence of redflag, and takes actions that are inappropriate and destructive and keep away from the solution to the problem [7].
————————————————
Abd. Rozak, Lecturer in STKIP PGRI Jombang, Indonesia. E-mail: [email protected]
Toto Nusantara, Lecturer in the Faculty of Mathematics and Natural Sciences, Universitas Negeri Malang, Indonesia. E-mail: [email protected]
Subanji, Lecturer in the Faculty of Mathematics and Natural Sciences, Universitas Negeri Malang, Indonesia. E-mail: [email protected]
3802
Table 1. Classification and Indicators of Metacognitive Failure
No Metacognitive
Failure Indicators
1 Blindness
Not succeeding in seeing an error occurring
Surviving in the wrong strategy Surviving with the wrong calculation
2 Mirage
Abandoning strategies that are actually useful
Changing the actual calculation is not wrong
Reject the correct answer
3 Vandalism
Follow up on strategies which do not work with other strategies that are not appropriate
Follow up with errors or difficulties with other ways that are not appropriate. Follow up on the anomalous results by doing other processes that are not appropriate.
Students in certain level of statistical reasoning are caused due to errors or difficulty in the problem solving process [3]. For example at transitional level, students on this level start to use quantitative information in statistical problems, therefore starting to show quantitative reasoning; however, they do this in a limited, mistaken way. At quantitative level, students use quantitative reasoning more effectively in a consistent way. However, while they are able to make multiple comparisons, they have difficulty establishing connections among them. Errors or difficulty in the problem solving process can trigger someone to monitor and regulate the process of problem solving. Research related to leveling and analysis of on statistical problems has been carried out [2], [3], and so has been linked to metacognitive behaviors [14], but studies have not been linked to metacognitive failure. In this study aims to describe metacognitive failures based on the level of statistical reasoning.
2
METHOD
This Research is a qualitative study with a case study strategy, the researcher carefully investigates a program, event, activity, or process of individuals or group [15]. The research subjects were students of Mathematics Education Program at University in East Java Indonesia, who had taken descriptive statistics, sixty-nine students as research subjects. The instrument is statistical problem adapted from Model Eliciting Activities (MEA) "On-time Arrival" with some adjustments related to the context of the problem to be contextual.
Statistical Problem
Arema FC will match away in the league 1 Gojek-Traveloka against Semenpadang FC. For efficiency, the AREMA management chose to leave near the match time. Departure to Padang is taken in two different flights because there are no direct flights from Juanda to Padang, flights start from Juanda airport to Soekarno-Hatta airport and then to Padang. Management wants the first flight from Soekarno-Hatta airport to Padang. To reach these flights, management identified that flights from Juanda to Soekarno-Hatta airport can be reached using one of five airlines (A, B, L, S, and M Airlines), these flights are important and must not be late to reach on next flight.
The AREMA management obtained data about delays in the last 20 days of flight as in the following table:
Time Delay (in Minutes) Flights From Juanda Airport
Day A B L S M
1 10 16 10 0 10
2 5 10 15 25 5
3 20 5 5 0 0
4 15 10 50 10 9
5 0 10 10 0 30
6 6 0 10 4 0
7 10 0 15 0 5
8 0 10 10 0 25
9 5 15 10 35 20
10 0 15 0 0 30
11 0 10 10 0 15
12 90 0 10 10 0
13 0 0 10 25 0
14 5 10 9 55 20
15 30 25 8 5 10
16 4 5 5 0 5
17 0 20 5 10 0
18 5 15 5 15 20
19 0 10 0 5 10
20 0 17 0 5 0
If you asked by AREMA management to determine which airline will be taken, give recommendations which airline will be taken!
Activity Questionnaire
Metacognitive activity questionnaire is used to obtaine information about student‘s metacognitive activity during problem solving process. This instrument was prepared by adapting a self-monitoring questionnaire developed by Fortunato, Hecht, Tittle and Alvarez [16] and adjusted with cognitive and metacognitive framework of problem solving [18].
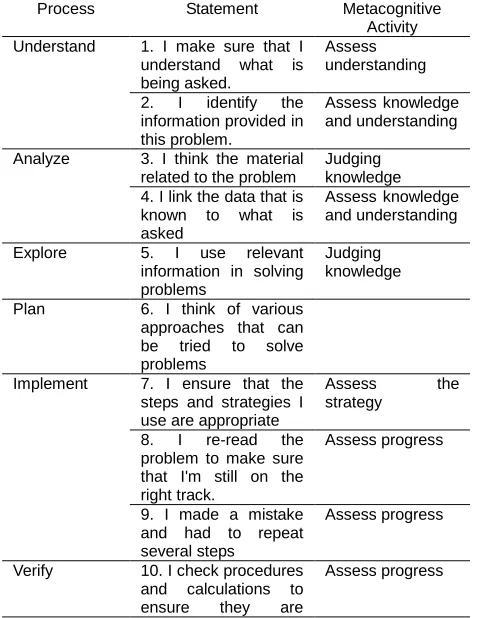
Table 2. Description of Metacognitive Activity Questionnaire
Process Statement Metacognitive Activity Understand 1. I make sure that I
understand what is being asked.
Assess understanding
2. I identify the information provided in this problem.
Assess knowledge and understanding
Analyze 3. I think the material related to the problem
Judging knowledge 4. I link the data that is
known to what is asked
Assess knowledge and understanding
Explore 5. I use relevant information in solving problems
Judging knowledge
Plan 6. I think of various approaches that can be tried to solve problems
Implement 7. I ensure that the steps and strategies I use are appropriate
Assess the strategy
8. I re-read the problem to make sure that I'm still on the right track.
Assess progress
9. I made a mistake and had to repeat several steps
Assess progress
Verify 10. I check procedures and calculations to ensure they are
3803 correct
11. I look back at the method to make sure that I have done what
the problem
requested.
Correcting errors
12. I ask myself whether my answer makes sense.
Assess the accuracy of the results
The subject has given statistical problems and asked to solve it individually. The results analyzed based on the statistical reasoning level [3]. Then difficulties or errors and metacognitive failure in solving problems in each level checked by metacognitive activity questionnaire to decide whether successful or failure metacognitive activities occur. Data analysis techniques used are data reduction, data presentation, and conclusion drawing.
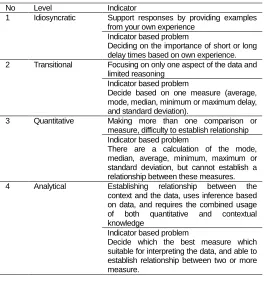
Table 3. Indicator Statistical Reasoning levels
No Level Indicator
1 Idiosyncratic Support responses by providing examples from your own experience
Indicator based problem
Deciding on the importance of short or long delay times based on own experience. 2 Transitional Focusing on only one aspect of the data and
limited reasoning Indicator based problem
Decide based on one measure (average, mode, median, minimum or maximum delay, and standard deviation).
3 Quantitative Making more than one comparison or measure, difficulty to establish relationship Indicator based problem
There are a calculation of the mode, median, average, minimum, maximum or standard deviation, but cannot establish a relationship between these measures. 4 Analytical Establishing relationship between the
context and the data, uses inference based on data, and requires the combined usage of both quantitative and contextual knowledge
Indicator based problem
Decide which the best measure which suitable for interpreting the data, and able to establish relationship between two or more measure.
3 RESULT
The data collection process was carried out by dividing 69 students into three classes, then they were given a statistical problem, answer sheets and metacognitive activity questionnaire.
Based on the analysis of student work, obtained the number of students categorized in each level of as the table below:
Table 4 The Number of Student Accross Levels
No Level Amount (%)
1 Idiosyncratic 0 0
2 Transitional 45 65
3 Quantitative 20 29
4 Analytical 4 6
Total 69 100
Idiosyncratic Level
Based on the data in table 3 above, there were no students with the idiosyncratic level, students mentioned one statistical measure in deciding airlines, for example, using the average time delay, the number of flights on time, or the smallest time delay. The results of this study indicate that students could connect problems with prior knowledge related to descriptive statistics so that decisions taken are based on statistical measures. Also, there was an adjustment to the content of statistical problems to make the problem contextual, so students were familiar with the use of statistical measures in daily life.
Transitional Level
This study was found that students at the transitional level dominated as many as 45 students, most of the students used only one statistical measure in decision making, the average time of delay, or the number of flights on time delay, or the smallest or largest time delay.
Table 4 Measure Used in Transitional Level
No Measure Amount Percentage
1 Average time delay 38 84 2 the number of on time
or delay 6 13
3 the smallest or largest
time delay 1 2
Total 45 100
Based on the table above, as many as 38 students or 84 percent use the average time delay in deciding which airlines use, while only 6 students or 13 percent use the number of flights on time or delay, and one of the students or 2 percent used the smallest or the largest time delay in decision making.
Quantitative Level
At the quantitative level, students use more than one measure in decision making. Twelve students use combination between average time delay and the number of flights on time or delay, seven students use combination between average time delay and the smallest time delay or largest time delay, and only one student use combination among average time delay, the number of flights on time or delay, and the smallest or largest time delay.
Table 5 Measure Used in Quantitative Level
No Measure Combination Amount Percentage 1 Average time delay and
the number of flights on time or delay
12 60
2 Average time delay and the smallest or largest time delay
7 35
3 The number of flights on
3804 smallest or largest time
delay
4 Average time delay, the number of flights on time or delay, and the smallest or largest time delay
1 5
Total 20 100
Analytical Level
At this level students use more than one statistical measure, for example the average time delay and the number of delays, the average delay time and smallest or largest time delay, the number of on time or delay and the smallest or largest time delay and connect the two or more statistical measure in the retrieval decision, here is an example of student work at the analytical level.
Table 6 Measure Used in Analytical level
No Measure combination Amount Percentage 1 Average and the number
of on time or delay 2 50 2 Average and the smallest
or largest time delay 2 50 3 the number of on time or
delay and the smallest or largest time delay
0 0
Total 4 100
Analysis Metacognitive Failure
Metacognitive failure analysis at each level is based on the difficulties and errors in the problem-solving process that cause students to be at that level. Metacognitive failures occur triggered by difficulties or errors in problem-solving, students monitor and regulate it and cannot realize and take not an appropriate action.Development of metacognitive failure indicators at each level of (table 5) using the concept of metacognitive failure [7] and indicator of statistical reasoning level [7]. The potential for difficulties or errors in the problem-solving process occurs at the idiosyncratic level, the transitional level, and the quantitative level [7]. At the analytical level is the highest level, did not find difficulties or mistakes, students can solve problems correctly, so not trigger metacognitive failures.
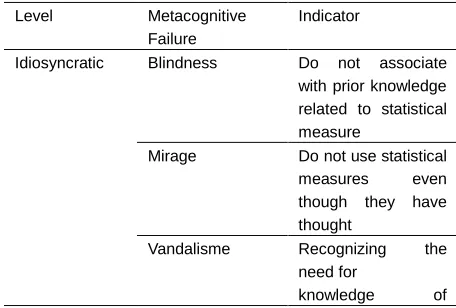
Table 7 Indicator Metacognitive Failure Across Level
Level Metacognitive Failure
Indicator
Idiosyncratic Blindness Do not associate with prior knowledge related to statistical measure
Mirage Do not use statistical measures even though they have thought
Vandalisme Recognizing the need for
knowledge of
statistical measure, but ignoring them. Transitional Blindness Unable to see
calculation error
Mirage Only use one
statistical measure although
understanding other Vandalisme Recognizing the need for knowledge of other statistical measure, but ignoring them Quantitative Blindness Unable to see errors
in calculations and in relationship between two or more statistical measures.
Mirage Do not use
relationship between two or more statistical measures that are actually correct
Vandalisme Aware of errors in establishing relationship between two or more statistical measures, but not correct then continue to the next process.
Analytical - -
Metacognitive failure in Idiosyncratic Level
The idiosyncratic level is the lowest level, the results of this study did not get any students categorized as Idiosyncratic level, so there was no discussion related to the metacognitive failure.
Metacognitive failure in Transitional Level
The transitional level indicated by student decide based on one statistical measure (average, mode, median, minimum or maximum delay, and standard deviation). Potential metacognitive failures can be: unable to see calculation errors, or only use one measure although understanding other statistical measure, and recognizing the need for knowledge of other statistical measure, but ignoring them.
Case Examples in Student 1(S1)
Based on the results of student work, at the transitional level students focus on only one statistical measure of the data, namely the average of time delay (Figure 2), then selected airline based on the smallest average delay and did not combine other statistical measure.
Figure 2. Working sheet S1
3805 Each flight data is added up and got the results, then the
results are divided by 20 and find flight times:
A airline 2 0 5 = 1 0 .2 5 2 0
B airline 2 0 3 = 1 0 .1 5 2 0
L airline 1 9 7 = 9 .8 5 2 0
S airline 2 0 4 = 1 0 .2 0 2 0
M airline 2 1 4 = 1 0 .7 2 0
From the 5 calculations above if I am asked to become a management and the airline that I use is L airline.
The students use a statistical measure in decision making, not a spontaneous activity, but rather involves a metacognitive activity. It is based on the metacognitive activity questionnaire, students stated that "yes, I think the material is related to the problem and yes I use various approaches in solving problems‖. But the metacognitive activity did not help students to use related material. So S1 experienced metacognitive mirage, S1 used only one measure although understanding other statistical measure, S1 realized that he has thought of other statistical measure, but S1 did not use them in solving problems.
Case Examples in Student 2 (S2)
In the case of S2 used average only in making decision (Figure 3) indicating that the level of S2 was at the transitional level.
Figure 3. Working sheet S2
Translated version
A airlines, Average =2 0 5 = 1 0 .2 5 2 0
B airlines, Average =2 0 3 = 1 0 .1 5
2 0
L airlines, Average =1 9 7 = 9 .8 5 2 0
S airlines, Average = 1 9 4 = 9 .7 2 0
M airlines, Average = 2 1 4 = 1 0 .7 2 0
When seen from the average time delay, I choose S
S2 assessed procedure of calculations as metacognitive activity, in questionnaire S2 stating in the verification process that "yes, I check procedures and calculations to ensure they are correct". The error occurred in the process of adding up the time delay on the S airline (Figure 3), it should be 204, not 194. So there has been an error in concluding. However, what has been done is not able to see any errors in the calculation process. Failure to see the calculation error is metacognitive blindness.
Metacognitive failure in Quantitative Level
Metacognitive failure in quantitative level indicated by one of: failure in seeing error or difficulties in make relationship or combine two or more statistical measure (metacognitive blindness), not use relationship between correct statistical measure (metacognitive mirage), and aware of errors in establishing relationship statistical measure, but not correct it then continue to the next process (metacognitive vandalism). The findings of this study indicate the failure of metacognitive relating to making the relationship between the two measures and error calculations errors.
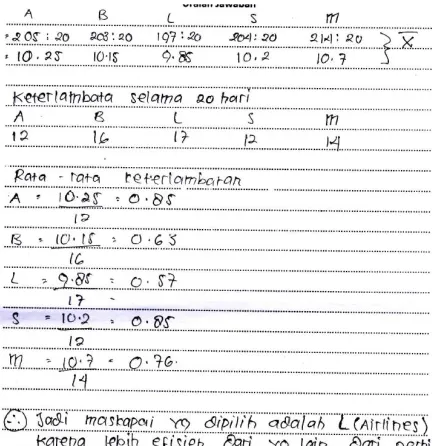
Case Examples in Student 3(S3)
Based on answer sheet S3 (Figure 4), shows that S3 uses the average and the number of delays in each airline and combine it by dividing the average with the number of delays.
Figure 4. Working sheet S3
Translated version Average
A B L S M
205:20 203:20 197:20 204:20 214:20 10.25 10.15 9.85 10.2 10.7 Delay of 20 days
A B L S M
12 16 17 12 14
3806 A = 1 0 .2 5 = 0 .8 5
1 2
B =1 0 .5 = 0 .6 5
1 7
L = 9 .8 5 = 0 .5 7 1 7
S = 1 0 .2 = 0 .8 5 1 2
M = 1 0 .7 = 0 .7 6 1 4
So L airline is chosen because it was more efficient than others, from the above calculation the airline has the smallest average delay.
Conceptually, a combination of average and the number of delays should be made by multiplying it and selecting the smallest result. Metacognitive activities occured when students assess progress to make sure that still on the right track, based on the S3 questionnaire stating "yes, I re-read the problem to make sure that I'm still on the right track‖. But S3 did not able to see an error in combining the average and the amount of time delay, thus S3 experienced metacognitive blindness.
Case Examples in Student 4(S4)
Based on the answer sheet of student 4 (S4), S4 used the number of time delay and the longest time delay for making the decision (Figure 5).
Figure 5. Working sheet S4
Translated version
When seen from the average flight delays in the last 20 days, airline B had the least delay.
So I chose airline B because it had the smallest average time delay and was compared to other airlines. These airline B longest delayed 25 minutes while the A, L, S, and M at the latest 90, 50, 55, and 30 minutes.
S4 did not combined the two statistical measures, so the decision making is not appropriate. Based on the S4 questionnaire stating that " I use various approaches in solving problems" indicates that S4 have assessed the procedure, but did not realize that he had difficulty in combining the two statistical measures. So S4 experienced metacognitive blindness.
4 DISCUSSIONS
The level of student reasoning in statistics is related to understanding statistical concepts. The existence of statistical misconceptions causes students to be at a low level of
statistical reasoning, besides that misconceptions that cause errors or difficulties can trigger metacognition activities in monitoring and managing the problem-solving process [11]. The results of this study indicate that metacognitive activities involved in the problem-solving process, but not all metacognitive activities are successful. Two forms of metacognitive failure were found, namely metacognitive blindness and metacognitive mirage. Metacognitive blindness occurs because metacognitive activities undertaken cannot detect errors. Errors that often occur are calculation errors, errors in applying procedures, and symbol errors [18]. Calculation procedural errors relating to an individual's procedural knowledge about how to do something. At the transitional level, calculation procedural errors occur when determining the average delay, and at the quantitative level, procedural errors occur in combining two statistical measures. Metacognitive blindness occurs in calculation procedure, even though student checked the procedure, but failed to recognize the error [11], or occur when a person does not admit their error calculation process is done [7].
At the transitional level, metacognitive mirage occurs because it ignores other statistical measures that are understood and can be used in decision making. In these conditions, students decided not to use other statistical measures because they feel doubtful or consider it useless and leave it. Metacognitive mirage occurs because it doubts what is understood, caused by not believing in one's own ability to do what is done [19].
5 CONCLUSSION
Level of reasoning statistical shows the level of ability of a person related to statistics. The data analysis and decision-making process require metacognitive activities in the form of monitoring and regulation. In solving the problem of statistics, failure in monitoring and regulation activities (metacognitive failure) has an impact on one's position at the level of statistical reflection. The results of this study indicate that: (1) A person at the transitional level experiences metacognitive mirage due to abandoning other statistical measures that have been previously thought, whereas metacognitive blindness is caused by metacognitive activities performed that cannot see any average calculation errors. (2) At the quantitative level, metacognitive mirage occurs because it requires other statistical measurements that have been determined but do not use them these statistical measures can be used in decision making. Whereas metacognitive blindness is caused by metacognitive activity not being able to detect errors in combining two statistical measures.
ACKNOWLEDGMENT
The authors wish to thank all of participants and partners who have supported this research.
REFERENCES
[1] J. Garfield, ―The challenge of developing statistical reasoning,‖ Journal of Statistics Education, 10(3), 2002.
[2] B.A.P. Martadiputra, ―Kajian Tentang Kemampuan Melek Statistis (statistical Literacy), Penalaran Statistis (statistical Reasoning), Dan Berpikir Statistis (statistical Thinking) Guru Smp, 251, 83, 2010.
3807
levels of pre-service elementary school teachers in the context of a model eliciting activity,‖ International Journal of Research in Education and Science, 3(1), 20-30, 2017.
[4] G.A. Jones, C.W. Langrall, E.S. Mooney, and C.A. Thornton, ―Models of development in statistical reasoning,‖ In D. Ben-Zvi & J. Garfield (Eds.), The challenge of developing statistical literacy, reasoning and thinking (pp. 97-117), Dordrecht: Kluwer Academic Publishers, 2004.
[5] R.C. DelMas, ‗‘Statistical literacy, reasoning, and learning: A commentary,‖ Journal of Statistics Education, 10(3), 2002. [6] L.B. Barbacena and N.R. Sy, ―Metacognitive model in
mathematical problem solving,‖ BU Faculty e-Journal, 12(1), 16-22, 2015.
[7] M. Goos, ―Understanding Metacognitive Failure,‖ Journal of MathematicalBehavior, 21(3), 283–302, 2002.
https://espace.library.uq.edu.au/view/UQ:10303/JMB.Meta.failur e.pdf
[8] K.E.D. Ng, ―Partial Metacognitive Blindness in Collaborative Problem Solving,‖ in L. Sparrow, B. Kissane, & C. Hurst (Eds.), Shaping the future of mathematics education: Proceedings of the 33rd annual conference of the Mathematics Education Research Group of Australasia. Fremantle: MERGA, 2010 . https://eric.ed.gov/?id=ED520954
[9] G. Stillman, ―Applying Metacognitive Knowledge And Strategies In Applications and Modelling Tasks at Secondary Level,‖ In Kaiser, G., Blum, W., Borromeo Ferri, R., & Stillman, G. (Eds.), Trends in teaching and learning of mathematical modelling: ICTMA14 (pp. 37-46), 2011. New York: Springer. http://en.bookfi.net/book/1422558,
[10]G. Stillman, ―Applications and Modelling Research in Secondary Classrooms: What Have We Learnt?,‖ 12th International Congress on Mathematical Education, 8 July – 15 July, 2012,
COEX, Seoul, Korea, 2012.
https://www.acu.edu.au/__data/assets/pdf_file/0006/462948/Glo ria_Stillman_-_ICME_-_Regular_Lecture.pdf.
[11]N. Prakitipong and S. Nakamura, ―Analysis of Mathematics Performance of Gra(de Five Students in Thailand Using Newman Procedure,‖ Journal of International Cooperation in Education, 9(1):111-122, 2006.
[12]P. Singh, A.A. Rahman and T.S. Hoon, ―The Newman Procedure for Analyzing Four Pupils Error on Written Mathematical Task : A Malaysian Perpective,‖ Procedia Social
and Behavioral Science 8, 264-271, 2010.
https://www.researchgate.net/.../241123045
[13]M. Goos, P. Galbraith and P. Renshaw, ―A Money Problem: A Source Of Insight Into Problem Solving Action,‖
International Journal for Mathematics Teaching and Learning, 1-21, 2000. http://www.cimt.plymouth.ac.uk/journal/pgmoney.pdf [14]F.R. Curcio and A. F. Artzt, ―Assessing Students‘ Statistical
Problem-solving Behaviors in a Small-group Setting, 1997. [15]J.W. Creswell, ―Educational Research Design: Planning,
Conducting, and Evaluating Quantitative and Qualitatve Research, Boston: Pearson, 2012.
[16]M. Goos, P. Galbraith and P. Renshaw, ―Socially Mediated Metacognition: Creating, Collaborative Zones of Proximal Development In Small Group Problem Solving,‖ Educational Studies in Mathematics, 49, 193–223, 2012. https://www.researchgate.net.
[17]A.F. Artzt and E. Armour-Thomas, ―Development of a cognitive-metacognitive framework for protocol analysis of mathematical
problem solving in small groups,‖ Cognition and Instruction. 9(2), 137–175, 1992. http://www.jstor.org/stable/3233531
[18]M. Elbrink, ―Analyzing and Addressing Common Mathematical Errors in Secondary Education,‖ B.S Undergraduate
Mathematics Exchange, 5(1), 2008.
http://www.bsu.edu/libraries/beneficencepress/mathexchange/0 5-01/Elbrink.pdf.