Why has COVID-19 mortality been higher in certain countries than others? An 1
ecological analysis of 204 countries 2
3
Chris Kenyon1,2*
4 5
6 7
1HIV/STI Unit, Institute of Tropical Medicine, Antwerp, Belgium; 2Division of Infectious
8
Diseases and HIV Medicine, University of Cape Town, Anzio Road, Observatory 7700,
9
South Africa
10 11
*Corresponding author. HIV/STI Unit, Institute of Tropical Medicine, Antwerp, 2000,
12
Belgium. Tel: +32 3 2480796; Fax: +32 3 2480831; E-mail: [email protected]
13 14 15 16 17 18 19 20 21 22 23 24 25 26 27
Word Count: 28
Abstract: 168
29
Body: 1430
30 31 32
Keywords: SARS-CoV-2; COVID-19 mortality rate; testing intensity; epidemiology;
33
Europe; Asia; obesity; elderly
Abstract 35
36
Background: It is unclear why certain countries have been more severely affected by
37
COVID-19 than other countries.
38
39
Methods: In this ecological study we compared COVID-19 mortality and
40
incidence/100,000 as well as 4 putative explanatory factors by WHO world region.
41
Linear regression was then used to assess the country-level predictors of COVID-19
42
mortality/100,000 and incidence/100,000 in 204 countries with available data.
43
44
Results: COVID-19 incidence and mortality/capita were greater in Europe than other
45
regions. This was despite a higher testing rate in Europe than other regions. Europe
46
had an older population than all other regions and a higher prevalence of obesity than
47
Africa, South East Asia and the Eastern Mediterranean.
48
49
Country level multiple linear regression revealed positive associations between
50
mortality/capita and testing rate, percent of the population 65 years or older, and
51
Europe compared to Western Pacific and South East Asia (all P<0.005). Results for
52
the analyses with cases/100,000 as outcome variable were similar.
53
54
Conclusion: Our results suggest that older populations as well as other undefined
55
regional and national factors, possibly related to efficacy of control efforts, are
56
responsible for differences in national severity COVID-19 epidemics.
57
Background 59
Despite the SARS-CoV-2 virus first emerging and spreading in Asian countries,
60
countries in Europe and elsewhere appear to have experienced more severe
COVID-61
19 epidemics [1-4]. The reasons underpinning these differences in epidemic severity
62
are unknown but of crucial importance in retarding the further spread of this virus [5,
63
6]. A common finding from studies around the world is that the majority of COVID-19
64
deaths occur in those above the age of 65 [7]. An older population structure may thus
65
be an important risk factor [2]. Individual level cohort studies have also found strong
66
associations between COVID-19 and obesity and a number of comorbidities such as
67
diabetes and cardiovascular diseases [7, 8]. Because the prevalence of obesity varies
68
dramatically between countries this could play an important role [9]. Differences in
69
national responses are likely to play a large role but are difficult to quantify [5]. One
70
parameter one can quantify is the number of COVID-19 tests performed per capita [7,
71
10]. Differences in viral virulence or transmissibility are thought to be unlikely to
72
important due to the low rate of genotypic variation in SARS-CoV-2, worldwide [11].
73
Differences in host susceptibility may however play a role [12, 13]. One such possibility
74
is the ACE-1 I/D polymorphism which has been shown to account for around 50% of
75
the variation in ACE-1 expression between individuals [12]. The D-allele has been
76
found to be a risk factor for some of the comorbidities linked to COVID-19 disease
77
severity, such as hypertension, diabetes and cancer [12]. The D-allele has also been
78
shown to be a risk factor for developing acute respiratory distress syndrome (ARDS)
79
from all causes [12, 14]. One study has found an ecological association between
80
COVID-19 mortality rates and the frequency of the D-allele within European countries
81
[15]. Using an ecological study design, we evaluated which of these risk factors was
82
associated with country-level COVID-19 mortality and incidence.
84
Methods 85
86
Variables 87
Age of COVID-19 epidemic. The date the first case of COVID-19 was diagnosed in
88
each country. This data was obtained from the ECDC data repository on 7 May 2020:
89
https://www.ecdc.europa.eu/en/geographical-distribution-2019-ncov-cases
90
91
Cases/capita. The cumulative number of cases of COVID-19 infection per 100 000
92
inhabitants on 7 May 2020 per country. This data was obtained from the World of
93
Meters data repository on 7 May 2020: https://www.worldometers.info/coronavirus/
94
95
Mortality/capita. The COVID-19 attributable mortality per 100 000 inhabitants. This
96
data was obtained from the World of Meters data repository on 7 May 2020:
97
https://www.worldometers.info/coronavirus/
98
99
Tests/capita. Cumulative number of nucleic acid amplification SARS CoV-2 tests
100
conducted per country per 100 000 inhabitants up till 7 May 2020. This data was
101
obtained from the World of Meters data repository:
102
https://www.worldometers.info/coronavirus/
103
104
Percent elderly: The percent of the total population that is 65 years or older in 2018.
105
Data extracted from the World Bank:
106
https://data.worldbank.org/indicator/SP.POP.65UP.TO.ZS 107
Percent obese: The percent of the age standardized adult population with a body mass
109
index of 30 or above in the year 2016. Data was taken from the World Health
110
Organization: https://apps.who.int/gho/data/view.main.CTRY2450A?lang=en 111
112
ACE-1 ID/DD genotype prevalence. This was calculated as the prevalence of the ID
113
plus DD genotypes per country. These figures were taken from a recent publication
114
that provided national estimates for these based on a literature review [16].
115
116
WHO regions. Countries were categorized according to the 6 WHO world regions:
117
Americas, Africa, Europe, Eastern Mediterranean, South East Asia and Western
118
Pacific/East Asia: https://www.who.int/choice/demography/by_country/en/
119
120
Data analysis 121
Simple and multiple linear regression was used to assess the associations between
122
each of the variables and deaths/capita or cases/capita. Log transformation was used
123
for mortality/capita, cases/capita and tests/capita to create more normal distributions
124
for inclusion in the linear regression analyses. All variables with a p-value of <0.01 in
125
the univariate analysis were entered into the multiple regression analyses. The
126
Wilcoxon rank-sum test was used to compare the values of the variables in different
127
world regions. All regions were compared with Europe because mortality/capita and
128
cases/capita were found to be highest here. The most recent data available as of 7
129
May 2020 was used for all the COVID-19 variables - tests/capita, cases/capita,
130
mortality/capita and age of epidemic. A p-value of < 0.01 was considered statistically
131
significant. The analyses were performed in STATA version 16 (Stata Corp, College 132
134
Results 135
As of 7 May 2020, 204 countries reported COVID-19 cases and 174 reported deaths.
136
There was a large variation in the number of deaths per 100,000 inhabitants (mean
137
50, interquartile range [IQR] 20-310) and cases per 100,000 inhabitants (mean 1,985
138
IQR 450-11,185; Table 1).
139
140
COVID-19 incidence and mortality/capita were greater in Europe than other regions
141
(Fig. 1, Table 1). This was despite a higher testing rate in Europe than other regions.
142
Europe had an older population than all other regions and a higher prevalence of
143
obesity than Africa, South East Asia and the Eastern Mediterranean (Fig 1.)
144
145
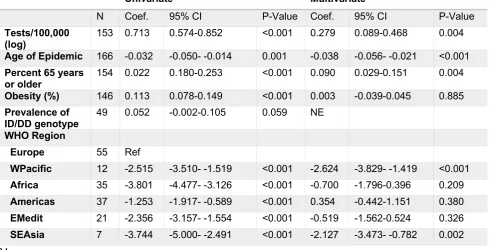
Country level simple linear regression revealed positive associations between
146
mortality/capita and testing rate, percent elderly, percent obese and a negative
147
association with the age of the epidemic (all P-values <=0.001; Table 1). On multiple
148
linear regression these associations remained significant except the percent obese
149
variable (Testing: coef. 0.28, 95% CI 0.09-0.47; Age of epidemic: coef. -0.04, 95% CI
150
-0.06- -0.02; Percent elderly: 0.09, 95% CI 0.03-0.15). So too, mortality remained
151
lower in Western Pacific and South East Asia than Europe.
152
153
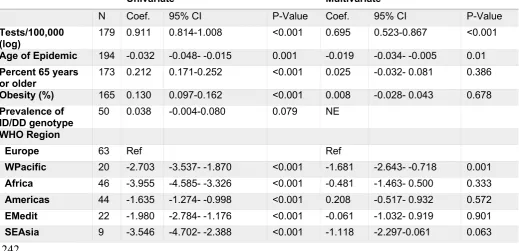
Linear regression with cases/capita as outcome variable revealed similar results with
154
the main exception that percent elderly was no longer a significant predictor in the
155
multivariate analyses (Table 2).
156
157
Both in terms of cases and attributable mortality, the COVID-19 epidemics have varied
159
in their intensity between countries and regions. Individual level studies have found
160
that being older and obese were strong risk factors for both severe symptomatic
161
disease and mortality [7, 8]. Our ecological analysis found positive associations
162
between these two variables and COVID-19 mortality. These findings suggest that a
163
higher prevalence of elderly and possibly obesity may explain part of the differences
164
in COVID-19 mortality. After controlling for these differences, however, the
165
mortality/capita and cases/capita remains higher in Europe than other regions such as
166
Western Pacific and South East Asia. This suggests that other factors play a role.
167
168
A number of explanations are possible. Firstly, we may not have adequately controlled
169
for the ages of the national epidemics. Countries with more recent epidemics may
170
have had more time and motivation to introduce more effective control programmes.
171
This would not however explain the smaller epidemic size in Western Pacific countries,
172
since these countries typically had earlier epidemics [4]. Secondly, our measures of
173
age structure and obesity are relatively crude and may not have fully-captured the risk
174
differences between populations [9]. Thirdly, differences in the speed, intensity and
175
accurate targeting of testing, contact tracing and isolation likely played a role [3, 4, 17].
176
This fits with findings of narrative reviews that Western Pacific countries responses
177
typically involved rapid, timeous, large scale screening, contact tracing and isolation
178
early on in their epidemics that resulted in subsequent declines in incidence [3, 4, 17,
179
18]. Responses in European countries on the other hand tended to be slower, and
180
less intense in terms of screening, contact tracing and isolation [1, 2, 4-6, 18, 19]. This
181
was particularly evident in countries such as Sweden and the United Kingdom [20].
182
The United Kingdom briefly proposed pursuing a strategy of allowing the controlled
spread of SARS-CoV-2 so as to develop ‘herd-immunity’ [20]. Fourthly, differences in
184
host susceptibility may play a role. We found that Europe had a higher prevalence of
185
the ID/DD-genotypes thought to confer increased risk for severe COVID-19 than
186
Western Pacific. There was however no statistically significant association between
187
ID/DD prevalence and mortality/capita or cases/capita in the country level analyses.
188
We acknowledge that this conclusion must be tempered by the fact that we only
189
assessed the effect of one susceptibility locus. Fifthly, differences in lock-down,
190
quarantining, social-distancing or face mask usage may play a role. There were
191
considerable differences in how these strategies were applied in countries [3-5, 17]. A
192
number of authors have noted that the more widespread use of face masks in public
193
in Western Pacific than European countries may have played a role in explaining
194
differential spread [3, 21, 22].
195
196
Our analysis confirms the order of magnitude difference in COVID-19 incidence and
197
mortality between Europe and the Western Pacific, South East Asia and Africa. Our
198
results suggest that differences in the age structure and possibly the prevalence of
199
obesity play a role in explaining the lower incidence in Africa and South East Asia. The
200
fact that after controlling for these risk factors and the age of the national epidemics,
201
the incidence and mortality remain significantly lower in South East Asia and Western
202
Pacific than Europe suggest that other factors such as more effective control
203
measures played a roll. This finding in turn suggests that where control strategies differ
204
between Europe and Western Pacific, such as the use of face masks in public, the
205
Western Pacific strategy should be favored.
206
207
Authors’ contributions
209
CK conceptualized the study, was responsible for the acquisition, analysis and
210
interpretation of data and wrote the analysis up as a manuscript.
211
212
Funding
213
Nil
214
215
Conflict of interest
216
The author declares that he/she has no competing interests.
217
218
Ethical approval 219
The analysis involved a secondary analysis of public access ecological level data. As
220
a result, no ethics approval was necessary.
221
222
Informed consent 223
Not applicable
224
Acknowledgements 225
Nil
226
Table 1. Simple and multiple linear regression analyses of the predictors of
COVID-228
19 mortality per 100,000 inhabitants
229 230
Univariate Multivariate
N Coef. 95% CI P-Value Coef. 95% CI P-Value
Tests/100,000
(log) 153 0.713 0.574-0.852 <0.001 0.279 0.089-0.468 0.004
Age of Epidemic 166 -0.032 -0.050- -0.014 0.001 -0.038 -0.056- -0.021 <0.001
Percent 65 years
or older 154 0.022 0.180-0.253 <0.001 0.090 0.029-0.151 0.004
Obesity (%) 146 0.113 0.078-0.149 <0.001 0.003 -0.039-0.045 0.885
Prevalence of ID/DD genotype
49 0.052 -0.002-0.105 0.059 NE
WHO Region
Europe 55 Ref
WPacific 12 -2.515 -3.510- -1.519 <0.001 -2.624 -3.829- -1.419 <0.001
Africa 35 -3.801 -4.477- -3.126 <0.001 -0.700 -1.796-0.396 0.209
Americas 37 -1.253 -1.917- -0.589 <0.001 0.354 -0.442-1.151 0.380
EMedit 21 -2.356 -3.157- -1.554 <0.001 -0.519 -1.562-0.524 0.326
SEAsia 7 -3.744 -5.000- -2.491 <0.001 -2.127 -3.473- -0.782 0.002
Table 2. Simple and multiple linear regression analyses of the predictors of
COVID-239
19 incidence per 100,000 inhabitants
240 241
Univariate Multivariate
N Coef. 95% CI P-Value Coef. 95% CI P-Value
Tests/100,000 (log)
179 0.911 0.814-1.008 <0.001 0.695 0.523-0.867 <0.001
Age of Epidemic 194 -0.032 -0.048- -0.015 0.001 -0.019 -0.034- -0.005 0.01
Percent 65 years
or older 173 0.212 0.171-0.252 <0.001 0.025 -0.032- 0.081 0.386
Obesity (%) 165 0.130 0.097-0.162 <0.001 0.008 -0.028- 0.043 0.678
Prevalence of
ID/DD genotype 50 0.038 -0.004-0.080 0.079 NE
WHO Region
Europe 63 Ref Ref
WPacific 20 -2.703 -3.537- -1.870 <0.001 -1.681 -2.643- -0.718 0.001
Africa 46 -3.955 -4.585- -3.326 <0.001 -0.481 -1.463- 0.500 0.333
Americas 44 -1.635 -1.274- -0.998 <0.001 0.208 -0.517- 0.932 0.572
EMedit 22 -1.980 -2.784- -1.176 <0.001 -0.061 -1.032- 0.919 0.901
SEAsia 9 -3.546 -4.702- -2.388 <0.001 -1.118 -2.297-0.061 0.063
Figure 1. Comparison of COVID-19 epidemics (mortality/capita and cases/capita),
246
testing intensity (tests/capita), percent of the population 65 years of age or older,
247
percent obese and prevalence of the ID/DD-genotypes of the ACE1 gene by WHO
248
world region in all countries with available data as of 7 May 2020 (*** P<0.0001,
249
**P<0.001, *P<0.01)
250
251
252
References 254
1. Saglietto A, D'Ascenzo F, Zoccai GB, De Ferrari GM. COVID-19 in Europe: the Italian 255
lesson. Lancet. 2020;395(10230):1110-1. Epub 2020/03/30. doi: 10.1016/S0140-256
6736(20)30690-5. PubMed PMID: 32220279; PubMed Central PMCID: PMCPMC7118630. 257
2. Rubino S, Kelvin N, Bermejo-Martin JF, Kelvin D. As COVID-19 cases, deaths and 258
fatality rates surge in Italy, underlying causes require investigation. The Journal of Infection in 259
Developing Countries. 2020;14(03):265-7. 260
3. Iwasaki A, Grubaugh N. Why does Japan have so few cases of COVID19? . EMBO 261
Mol Med. 2020. doi: 10.15252/emmm.202012481. 262
4. Cohen J, Kupferschmidt K. Countries test tactics in ‘war’against COVID-19. Science. 263
2020;367(6484):1287-8. 264
5. Li C, Anders H-J. SARS‑CoV‑2 and Europe: timing of containment measures for 265
outbreak control. Infection. 2020. doi: 10.1007/s15010-020-01420-9. 266
6. Johnson HC, Gossner CM, Colzani E, Kinsman J, Alexakis L, Beaute J, et al. Potential 267
scenarios for the progression of a COVID-19 epidemic in the European Union and the 268
European Economic Area, March 2020. Euro Surveill. 2020;25(9). Epub 2020/03/12. doi: 269
10.2807/1560-7917.ES.2020.25.9.2000202. PubMed PMID: 32156332; PubMed Central 270
PMCID: PMCPMC7068161. 271
7. Wu Z, McGoogan JM. Characteristics of and important lessons from the coronavirus 272
disease 2019 (COVID-19) outbreak in China: summary of a report of 72 314 cases from the 273
Chinese Center for Disease Control and Prevention. JAMA. 2020;323(13):1239-42. 274
8. Richardson S, Hirsch JS, Narasimhan M, Crawford JM, McGinn T, Davidson KW, et 275
al. Presenting characteristics, comorbidities, and outcomes among 5700 patients hospitalized 276
with COVID-19 in the New York City area. JAMA. 2020. doi: 10.1001/jama.2020.6775. 277
[Online ahead of print]. 278
9. Blüher M. Obesity: global epidemiology and pathogenesis. Nat Rev Endocrinol. 279
2019;15(5):288. 280
10. Kenyon C. Flattening-the-curve associated with reduced COVID-19 case fatality rates- 281
an ecological analysis of 65 countries. J Infect. 2020. Epub 2020/04/20. doi: 282
10.1016/j.jinf.2020.04.007. PubMed PMID: 32305488; PubMed Central PMCID: 283
PMCPMC7162747. 284
11. Phan T. Genetic diversity and evolution of SARS-CoV-2. Infection, Genetics and 285
Evolution. 2020;81:104260. 286
12. Gard PR. Implications of the angiotensin converting enzyme gene insertion/deletion 287
polymorphism in health and disease: a snapshot review. Int J Mol Epidemiol Genet. 288
2010;1(2):145-57. Epub 2010/01/01. PubMed PMID: 21537387; PubMed Central PMCID: 289
PMCPMC3076761. 290
13. Cao Y, Li L, Feng Z, Wan S, Huang P, Sun X, et al. Comparative genetic analysis of 291
the novel coronavirus (2019-nCoV/SARS-CoV-2) receptor ACE2 in different populations. 292
Cell Discovery. 2020;6(1):1-4. 293
14. Deng X, Zhang S, Jin K, Li L, Gu W, Liu M, et al. Angiotensin-converting enzyme I/D 294
polymorphism and acute respiratory distress syndrome. J Renin Angiotensin Aldosterone Syst. 295
2015;16(4):780-6. Epub 2015/04/15. doi: 10.1177/1470320315576255. PubMed PMID: 296
25869723. 297
15. Delanghe JR, Speeckaert MM, De Buyzere ML. The host’s angiotensin-converting 298
enzyme polymorphism may explain epidemiological findings in COVID-19 infections. Clinica 299
16. Kenyon C. ACE-1 I/D polymorphism associated with COVID-19 incidence and 301
mortality: an ecological study. wwwpreprintsorg. 2020. doi: 302
10.20944/preprints202004.0262.v1. 303
17. Pan A, Liu L, Wang C, Guo H, Hao X, Wang Q, et al. Association of Public Health 304
Interventions With the Epidemiology of the COVID-19 Outbreak in Wuhan, China. JAMA. 305
2020. Epub 2020/04/11. doi: 10.1001/jama.2020.6130. PubMed PMID: 32275295; PubMed 306
Central PMCID: PMCPMC7149375. 307
18. Anderson RM, Heesterbeek H, Klinkenberg D, Hollingsworth TD. How will country-308
based mitigation measures influence the course of the COVID-19 epidemic? The Lancet. 309
2020;395(10228):931-4. 310
19. Mitja O, Arenas A, Rodo X, Tobias A, Brew J, Benlloch JM, et al. Experts' request to 311
the Spanish Government: move Spain towards complete lockdown. Lancet. 2020. Epub 312
2020/04/01. doi: 10.1016/S0140-6736(20)30753-4. PubMed PMID: 32224297. 313
20. Hunter DJ. Covid-19 and the Stiff Upper Lip - The Pandemic Response in the United 314
Kingdom. N Engl J Med. 2020. Epub 2020/03/21. doi: 10.1056/NEJMp2005755. PubMed 315
PMID: 32197002. 316
21. Feng S, Shen C, Xia N, Song W, Fan M, Cowling BJ. Rational use of face masks in the 317
COVID-19 pandemic. The Lancet Respiratory Medicine. 2020. 318
22. Howard JH, A.; Li, Z.; Tufekci, Z.; Zdimal, V.; van der Westhuizen, H.; von Delft, A.; 319
Price, A.; Fridman, L.; Tang, L.; Tang, V.; Watson, G.L.; Bax, C.E.; Shaikh, R.; Questier, F.; 320
Hernandez, D.; Chu, L.F.; Ramirez, C.M.; Rimoin, A.W. Face Masks Against COVID-19: An 321
Evidence Review. Preprints 2020, 2020040203. 2020. doi: 10.20944/preprints202004.0203.v1. 322