www.nat-hazards-earth-syst-sci.net/12/1811/2012/ doi:10.5194/nhess-12-1811-2012
© Author(s) 2012. CC Attribution 3.0 License.
and Earth
System Sciences
Urban vulnerability and resilience within the context of
climate change
E. Tromeur, R. M´enard, J.-B. Bailly, and C. Souli´e
Egis Concept/Elioth, 4 rue Dolor`es Ibarruri, 93188, Montreuil, France
Correspondence to: E. Tromeur ([email protected])
Received: 22 November 2011 – Revised: 16 February 2012 – Accepted: 31 March 2012 – Published: 31 May 2012
Abstract. Natural hazards, due to climate change, are par-ticularly damaging in urban areas because of interdependen-cies of their networks. So, urban resilience has to face up to climate risks. The most impacting phenomenon is the ur-ban heat island (UHI) effect. The storage capacity of heat is depending on shapes of buildings, public spaces, spatial or-ganization, transport or even industrial activities. So, adap-tive strategies for improving urban climate could be possible in different ways. In the framework of the French project Resilis, this study characterises urban vulnerability and re-silience in terms of energy needs of buildings and outside ur-ban comfort according to the IPCC carbon dioxide emission scenarios B2 and A2 for the period 2050–2100 for 10 French cities. The evolutions of four climate indicators in terms of heating and cooling needs and number of hours when the temperature is above 28◦C are then obtained for each city to analyse climate risks and their impacts in urban environment.
1 Introduction
Urban society is more and more complex: new sets of so-cial relations, high degrees of connectivity and competitive-ness objectives. If urbanity is made of resources accumula-tion, power concentraaccumula-tion, territorial attractiveness and cul-tural life; it is also a new vector of risk, particularly due to concentration issue. External hazards, especially those due to climate change, become more significant when occurring in an urban environment: hazards are often magnified by ur-banity. Meanwhile, risks and damages are less and less ac-cepted by populations and economic activities. When cities are supposed to embody security and development, the latest events (heat waves, Xynthia) have highlighted their weak-nesses and questioned the way risks are anticipated and
man-aged. Today’s policies in risk management and assessment usually focus on a single risk, though the urban context in-duces domino effects and can spread damages. Indeed, inter-dependencies between organisations, infrastructures and ac-tivities are strong in urban areas. Unfortunately, policies are mainly focused on crisis management, whereas prevention measures are needed prior to the crisis and recovery plans have to be considered before the event occurs. Thus, risk management cannot be tackled without a global approach.
These facts have led local authorities to the expression of new needs to improve city resilience. Defined as the abil-ity of a cabil-ity to absorb disturbance and recover its functions after a disturbance (Lhomme et al., 2010), urban resilience has become a new paradigm in risk management methods enabling to tackle the challenges identified above. Resilis project aims precisely at the development of those innovative solutions dedicated to improving urban resilience. The main outcome is the development of methods and tools addressed to local authorities, networks operators, populations and all stakeholders. On the long term, the objective is to develop tools to prepare, adapt and conceive technical and social sys-tems so they are able to cope with, absorb and recover from disturbances.
day is released in the atmosphere. The storage capacity of heat is depending on shapes of buildings, public spaces, spa-tial organization, transport or even industrial activities. So, adaptive strategies could be possible in different ways.
The main consequence of the UHI could be a lack of com-fort due to possible heat wave intensification (Rosenzweig et al., 2005). This happened during the 2003 summer in lots of European countries, in particular, in France during two weeks in average. All microclimatic phenomena as heating retention, evapotranspiration reduction or heating emission due to human activities would be affected and would be in-tensified which could lead to a stronger lack of comfort for urban citizens (Colombert, 2008). The way of life of peo-ple could change. For instance, one can imagine that peopeo-ple would have to stay home most of the time during the day in summer, which would imply changing of plans during the day and having the main activity during evenings or nights for instance. In that case, economic consequences could hap-pen as well. People working outside and exposed to heat could see a decrease of their activities or, even worse, might have to stop working. However, people could adapt to this new situation and way of life during a warm season and have working conditions as in southern countries.
However, impacts to urban climate with respect to the countryside climate are not obvious, outside and inside com-fort being a function of physical parameters and microcli-matic locations, of people activity and their psychology. Brandt (2006) raised the question Does an “ideal” urban cli-mate exist? Few scientists tackle the problem that way. They prefer to compare an urban climate to a rural one and propose some solutions for urban heat island effect reduction.
Another impact from an increase of heat waves concern health risks (IPCC, 2007). Health issues could be due to di-rect exposures to extreme climate events (physical impacts because of heat or psychological impacts because of an ex-treme event itself) or indirectly via air and water quality, mosquitoes, and so on (First Assessment Report of the Ur-ban Climate Change Research Network, 2011; IPCC, 2007). In the case of hot weather, a lot of institutions advise peo-ple to stay home or to find shadow and a cool place for at least two hours during the hottest hours in the day. Numeri-cal simulations of climate change show that heat waves, as in 2003, will not be an exception in the future. The frequency of occurrence in the increase of hot days in the future being very likely (IPCC, 2007; Desplat et al., 2009; Best and Betts, 2004). The climate in Paris could be the one in Cordoba from the second part of the 21st century (Hallegate et al., 2007). So, cooling systems, urban planning or buildings would have to be revised.
Heat waves and UHI effect have big consequences on peo-ple’s health, in particular, older persons with respiratory dis-ease (Rey et al., 2007). Indeed, urban climate slows down pollution dispersion and increases night temperatures. So, an increase of ozone and a lack of cooler temperatures dur-ing the night could lead to increase mortality of the
popula-tion (Hallegate, 2007). Since this summer event in 2003 in France, hot day alert systems based on meteorological data have been created to warn people about risks (INVS, 2006), the goal being to detect hottest days coming if the temper-ature is above a certain threshold. However, this system is not perfect and would have to take into account an increase of temperature in the future, which could imply revising this threshold, alert system and prevention.
Risks coming from heat waves are double. Actual build-ing standards are not adapted to support warm days longer than those during the heat wave in France in 2003 (Halle-gate, 2007). In our latitudes about 44◦, buildings are not built to support temperatures higher than 40◦C for more than two weeks. If tomorrow Paris is at Cordoba’s latitude, building standards have to be totally changed, apartments oriented in the South-West direction becoming too hot and less comfort-able during summer. The comfort in habitations would get worse. So, one can predict a massive usage of cooling sys-tems in apartments which would contribute to the urban heat island effect due to warm air exchanged with outside air in the atmosphere. Therefore, energy peak consumptions would increase drastically and energy production installation would have to support these power peaks.
The goal of this paper is then to study impacts of building and urban area vulnerabilities to climate change. It is indeed necessary to quantify existing and future vulnerabilities in order to anticipate future climate risks for improving urban resilience. Data and methodology involving multi-climate datasets are first presented in Sect. 2. Climate data is ob-tained for the period 2050 to 2100 for two climate scenarios A2 (the worst case carbon dioxide emission scenario) and B2 (moderate case) (IPCC, 2000) for 10 French cities. The po-tential evolutions of heating and cooling needs and comfort and health indicators are, thereafter, obtained for each city in Sect. 3 to analyse climate risks in urban environment. The vulnerabilities and impacts on comfort, health and energy are then discussed in Sect. 4.
2 Data and methodology
The first part of this study consists of calculating the desired hourly climate data from 2050 to 2100. To do so, data from the Swiss software Meteonorm are used as meteorological basis in the calculi. They are supposed to be calculated and representative of the period 1996–2005 and have an hourly time-scale.
presented hereafter) are then carried out in order to create data on an hourly time-scale basis for the period 2050–2100. 2.1 M´et´eo-France data
In their study, the Intergovernmental Panel on Climate Change (IPCC) predicts a global mean temperature increase between 1.1◦C and 6.4◦C before the end of this century, which could change the radiative equilibrium of the Earth. These predictions are based on several carbon dioxide emis-sion scenarios going from the moderate one (B2) to the worst case scenario A2 (IPCC, 2000).
In our study, climate data are obtained from the cli-mate change simulator realised by the French Meteoro-logical Agency (http://climat.meteofrance.com/chgt climat/ simulateur/interpretation). This simulator simulates daily climate consequences in France for the period 2050–2100 for the two different scenarios B2 and A2 by means of the ARPEGE-Climat model developed by this agency with a spa-tial resolution of about 40 km. The use of this simulator al-lows us to get a possible estimation of a future climate, de-spite uncertainties of model and chaotic behaviour of the cli-mate system evolution. The uncertainties considered here are the range of temperature changes in 2100 produced by IPCC models:±0.7◦C for the scenario B2 and±1◦C for the sce-nario A2. We can note that only the tendency of climate pa-rameter evolution needs to be considered and not a specific result for a specific day, season or year.
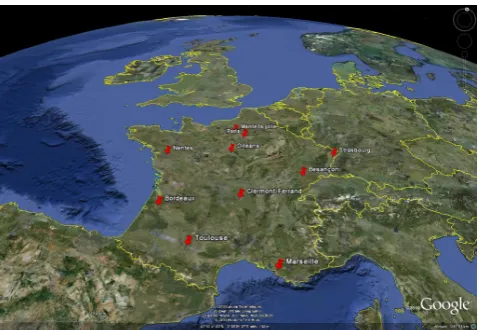
The climate simulator computes the minimum and max-imum temperatures at 2 m, the global horizontal radiation, the precipitation and the relative humidity for both scenar-ios for the period 2050–2100 in France. For our study, min-imum and maxmin-imum daily temperatures are obtained from this simulator for B2 and A2 scenarios for 10 French cities: Paris, Orl´eans, Mante-la-Jolie, Nantes, Bordeaux, Toulouse, Clermont-Ferrand, Marseille, Besanc¸on and Strasbourg. The choice of these cities is first based on pilot cities chosen in the French Resilis project (Paris, Orl´eans and Mante-la-Jolie) because of flooding and urban heat island risks and secondly on their location having a different climate behaviour. Loca-tions of cities are shown on Fig. 1.
2.2 Meteonorm data
The global climate database Meteonorm
(www.meteonorm.com) is primarily a method for the calculation of solar radiation on arbitrarily building ori-entated surfaces at any desired location. The method is based on databases and algorithms coupled according to a predetermined scheme. It commences with the user specifying a particular location for which meteorological data are required, and terminates with the delivery of data of the desired structure and in the required format.
The database was initiated by the Swiss Federal Office of Energy in 1985. Since 2010 the version 6.1 is available.
Me-Fig. 1. Locations of the 10 French cities on Google Earth.
teonorm software delivers radiation parameters on horizontal and inclined planes. Aside from this, many other meteoro-logical parameters like temperature, dew point temperature or wind speed are included. The values can be obtained in the form of monthly and yearly long-term means, as well as stochastically generated time series in hourly and minute time resolution, which correspond to typical years.
The main source of global radiation is the Global Energy Balance Archive (GEBA) of the ETH Zurich. The main source of all other parameters is the World Meteorologi-cal Organization (WMO) climate normals from 1961–1990 (WMO, 1998). Descriptions of the chain of algorithms can be found in Remund et al. (1998), Remund and Kunz (2003), Remund et al. (2007) or Badescu (2008).
Depending on specific user requirements, the user must choose the most suitable method from among the numer-ous procedures available in Meteonorm. A whole series of dependent parameters in addition to the measured data are available. In choosing the data, the quality and relevance of the basis datasets must be considered:
– Measured and interpolated monthly values are of sim-ilar precision. Although measured data reflect the spe-cific characteristics of a local site, they are always sub-ject to measurement errors, and these tend to be com-pensated by the interpolation process. Interpolated data should, therefore, be used at sites with no weather sta-tion in the vicinity (approx. 20 km distance).
– Dependent parameters such as diffuse radiation, celes-tial radiation, dew point temperature, etc., which are de-termined from calculated as opposed to measured data, are subject to greater inaccuracy owing to error propa-gation.
– The radiation data was subjected to extensive tests. The error in interpolating the monthly radiation values was 9 % and for temperature 1.5◦C. The Meteonorm radi-ation database is based on 20-yr measurement periods, the other parameters mainly on 1961–1990 and 1996– 2005 means. Comparisons with longer term measure-ments show that the discrepancy in the average total ra-diation, due to choice of time period, is less than 2 % for all weather stations.
– In general, the hourly model tends to overestimate slightly the total radiation on inclined surfaces by 0– 3 % (depending on model). The discrepancy compared to measured values is±10 % for individual months and
±6 % for yearly sums.
In order to build hourly temperature data from daily tem-perature data obtained by M´et´eo-France (methodology dis-cussed in the next section), hourly temperature data are gen-erated for the same 10 cities from the database Meteonorm for the averaged period 1996–2005 (Remund, 2007). An in-terpolation of M´et´eo-france daily temperature data is then re-alised on Meteonorm hourly temperature data. The principle is explained in the following section.
2.3 Interpolation principle for hourly temperature data
The goal of this methodology is to get hourly temperature data for the period 2050–2100 from existing climate data. So, M´et´eo-France data are interpolated based on data such as:
– daily minimum and maximum Meteonorm data are cal-culated;
– use of an interpolation function for each dayj makes the assumption that hourly evolution during the day in a future climate will be sensibly the same than today. Therefore, minimum, maximum and mean temperature tendencies evolve more than hourly temperature evolu-tion itself.
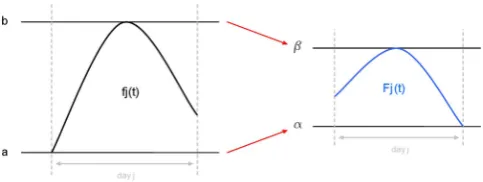
– hourly M´et´eo-France data are computed for the period 2050–2100 based on daily minima and maxima (Fig. 2). Knowing the hourly temperature evolution fj(t )for the
dayj,with a daily minimum and maximumaj andbj,
re-spectively, from Meteonorm data, the daily temperature evo-lution for a future climateFj(t )can be interpolated via an
empirical function such as:
∀j ∈ [1;365], Fj(t )=
βj−αj
bj−aj
fj(t )+Kj (1)
whereαjandβjare, respectively, the minimum and the
max-imum of temperature given by M´et´eo-France data, andKjis
a constant given by:
Kj = −
βj−αj
bj−aj
aj+αj (2)
Fig. 2. Interpolation principle.
This function allows us to get hourly data for the period 2050–2100. The continuity over the year is verified since each functionfj(t )is continuous (Lang, 1997).
2.4 Unified Degree Day
According to the French Meteorology Agency, the Unified Degree Day (UDD) is representative of annually heating and cooling energy needs. The degree day is taken here as the difference between an outside temperature at a specific hour
Toutduring the day and an inside temperature. The unified degree day is based on a temperature of referenceTreftaken inside the building. Two different temperatures of reference
Tref are considered as a function of the heating and cool-ing period (U.R.E, 1999) in order to get annually UDD from hourly climate data for the period 2050–2100:
– For the heating period (from the 1 October to the 20 May):Tref=18◦C.
– For the cooling period (the entire year):Tref=25◦C In France, these temperatures of reference are classical values to estimate energy needs for building (U.R.E., 1999). Considering the number of heating hours (NHH) during a day when Tout≤Tref, and the number of cooling hours (NHC) during a day whenTout≥Tref, heating and cooling UDDs are then given by:
UDDheat= 1
NHH NHH
P
i=0
(Tref−Touti), forTout≤Tref UDDcool= 1
NHC NHC
P
i=0
(Touti−Tref), forTout≥Tref (3)
UsingTref=18◦C andTref=25◦C for the heating and cool-ing periods, respectively, Eq. (3) becomes:
UDD18= 1
NHH NHH
P
i=0
(18−Touti), forTout≤18◦C UDD25= 1
NHC NHC
P
i=0
(Touti−25), forTout≥25 ◦C
(4)
Fig. 3. Annual distribution of the number of hours for the temper-ature for Paris in the case of the scenario A2.
3 Climate indicators
City shapes impact on local climate. What would the city’s vulnerability be to face the climate change then? What kind of information could be useful to mitigate risks and make easier urban resilience? In order to analyse the impact of cli-mate change on urban environment and to characterise vul-nerability scenarios, four indicators are built:
– the number of hours when the temperature is above 28◦C (NHT28);
– the heating UDD (UDD18);
– the cooling UDD (UDD25);
– the cross-energetic indicator.
These indicators are climate-energy indicators: the first one allows us to estimate the evolution of heat waves in the future, while the cross-energetic indicator allows us to look at the evolution of energy needs in percentages.
3.1 A case study: the city of Paris
3.1.1 Comfort and health indicator
The number of hours when the temperature is above 28◦C (NHT28) relates to energy outside urban comfort and urban climate, but also can anticipate an impact on health. Within the context of climate change, the tendency of NHT28 should increase. Figure 3 shows, for instance, the distribution of the number of hours for the temperature evolving between
−15◦C and 45◦C for both the years 2050 and 2100 for the worst case scenario A2 in Paris, compared to the averaged period 1996–2005. In general, the annually mean tempera-ture would increase by 1.2◦C in 2050 in comparison with the averaged period 1996–2005 going from 12.1◦C to 13.3◦C. This increase would be equal to 3.4◦C in 2100 given an an-nual mean temperature of about 15.5◦C. Moreover, NHT28
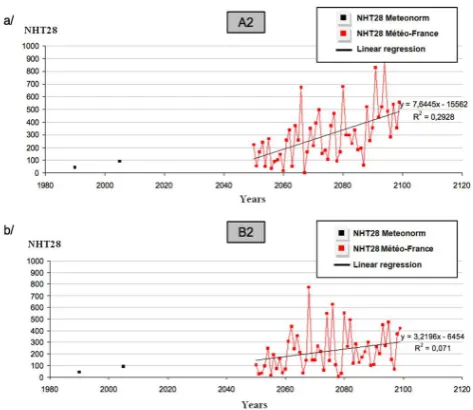
Fig. 4. Number of hours whenT >28◦C for the scenarios A2 (a) and B2 (b), in Paris.
would increase to about more than 300 % in 2100, going from 30 h for the period 1996–2005 to 120 h in 2100. There-fore, these results clearly show an increase in temperature on average in the city and are in favour of a climate change.
This increase is also well shown in Fig. 4 when looking at NHT28 for the period 2050–2100 for both scenarios. In-deed, a significant increase of NHT28 during these 50 yr is obtained for the scenario A2 (Fig. 4a). The slope coefficient of the linear regression calculated for the period 2050–2100 is above 7.5. Moreover, the variability of this tendency is im-portant as emphasized by the correlation coefficient which is less than 0.3. Noting that the calculated mean NHT28 follows the linear regression (not shown), the variability of NHT28 can double in some years in comparison with the mean, reaching a peak close to 900, while NHT28 is divided by two the year after, getting back close to the mean value. The same kind of tendency is obtained for the scenario B2 (Fig. 4b) but moderate, showing an increase of NHT28 of about 200 % between 2050 and 2100.
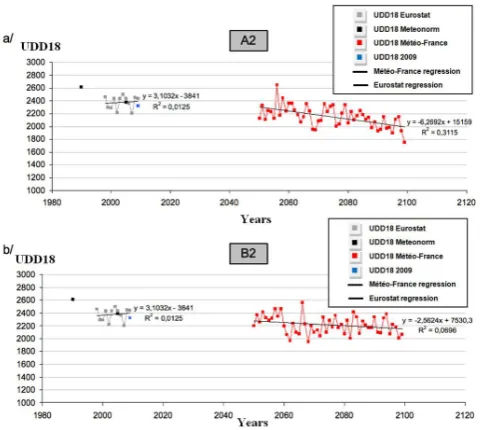
Fig. 5. Heating UDD for the scenario A2 (a) and B2 (b) in Paris.
3.1.2 Heating UDD
As NHT28, the tendency of UDD18 is observed for fifty years between 2050 and 2100 and is compared to observa-tions from the past climate (Fig. 5). In that case, Eurostat data coming from a European statistic database (Eurostat, 2010) is also used to look at the evolution of UDD18 for the period 1998–2009, Meteonorm data being still used as a reference. The linear regression calculated for the period 2050–2100 shows a clear decrease in the future for both scenarios, while a slight increase is observed today when looking at Eurostat data. For the scenario B2, UDD18 decrease is slightly less than in the scenario A2. This shows the impact of the cli-mate scenario. On average over the period 2050–2100, the decrease is about 13 % in the worst case scenario and about 5 % for the scenario B2.
In these results, the observed variability could come from different kinds of uncertainties due to input data, modelling or computation (IDDRI, 2010):
1. uncertainties due to climate scenarios;
2. uncertainties due to modelling (cloud formation, cli-mate feedback, etc. . . );
3. uncertainties due to the intrinsic natural climate vari-ability which is a chaotic phenomenon (El Nino for in-stance);
4. uncertainties due to the temporal and spatial downscal-ing.
3.1.3 Cooling UDD
The principle is the same here as for heating. The tempera-ture of reference is equal to 25◦C inside buildings. So, every
Fig. 6. Cooling UDD for the scenario A2 (a) and B2 (b) in Paris.
temperature outside above this temperature of reference im-plies energy needs for cooling. So, we can expect that cool-ing needs would increase in the context of climate change in the city, in particular because of the increase of the num-ber of hours when the temperature is above 28◦C and the increase of heat waves in the future. As for heating, results from M´et´eo-France for the period 2050–2100 are compared to the observations coming from Meteonorm for the past cli-mate. Figure 6 shows UDD25 for both climate scenarios A2 and B2. On average, UDD25 goes from 18 (average over the two Meteonorm databases) to 82 (average over the period 2050–2100 of M´et´eo-France data for the scenario A2). As a consequence, cooling needs would blow up with an increase of about 355 % (230 %) for the scenario A2 (B2) between 2050 and 2100. So, these needs would increase at least by a factor of 3 despite the moderate climate scenario.
3.2 Geographical influence
The tendencies of these three indicators described previously are calculated for nine other French cities to look at the geographical influence over the country. Figure 7 shows these climate indicators for all the 10 cities. Each indicator value corresponds to an average value obtained for the period 2050–2100 in the case of future climate M´et´eo-France data. For observational data, the value is averaged between the two databases (1960–1990 and 1996–2005) for Meteonorm and for the period 1996–2005 for Eurostat data. Averaged values are summarized in the Table 1.
Table 1. NHT28, UDD18 and UDD25 averaged values for 10 French cities for observational data and climate data from the period 2050– 2100 for the scenarios A2 and B2.
NHT28 UDD18 UDD25
Cities MNRM A2 B2 Eurostat A2 B2 MNRM A2 B2
Besanc¸on 74 348 249 2788 2484 2556 20 103 70
Bordeaux 126 705 582 1853 1642 1722 32 215 172
Clermont-Ferrand 61 357 247 2891 2679 2768 15 105 69
Mantes la Jolie 60 200 134 2376 2278 2337 16 54 35
Marseille 278 970 826 2192 1777 1869 67 271 218
Nantes 50 434 324 2117 1717 1779 14 121 87
Orl´eans 85 400 299 2336 2098 2166 22 112 82
Paris 67 296 225 2376 2153 2215 18 82 60
Strasbourg 61 189 117 2637 2702 2759 18 55 33
Toulouse 158 1066 878 2156 1723 1814 44 343 270
Fig. 7. NHT28, UDD18 and UDD25 mean values for 10 French cities for the scenarios A2 and B2.
the number of hours when the temperature is above 28◦C of about 575 %. Strasbourg has the lowest value with still an in-crease of 210 % for NHT28, slightly more for UDD25 with an increase of 215 %. In general, tendencies for scenario B2 is equivalent, but smaller than for the worst case scenario.
In general, UDD18 decreases in all cities except in Stras-bourg where UDD18 increases a little bit by 5 % for the sce-nario B2 and about 2 % for the case A2. Moreover, UDD18 for cities in the south of France is globally going down with the strongest decreases which could be directly linked to a more pronounced global warming in these regions. Indeed, Nantes, Toulouse or Marseille show an UDD18 decrease of about 20 % for in the worst case scenario A2 for instance. Globally, energy needs for heating would decrease in France during the 21st century.
3.2.1 Cross-energetic indicator
The evolution of these energetic indicators is correlated with climate change. The comfort indicator, NHT28, shows clearly an increase in the number of hours when the tem-perature is above 28◦C, whatever the city, as well as an in-crease of heat waves (not shown). So energy needs would have to evolve in the future considering this increase in cool-ing needs.
However, indicator values are dependent of the climate model which is ARPEGE-Climat from M´et´eo-France. So, another way to observe the tendency of these indicators is to look at the evolution of energy needs in percentage between the periods 1996–2005 and 2050–2100 as a function of the climate scenario. Figure 8 shows this evolution for each heat-ing and coolheat-ing needs, while the evolution of NHT28 corre-sponds to the diameter of bubbles. This one is equal to 50 % for a bubble equivalent to the legend which never occurs. It is interesting to see for Nantes, for instance, that cooling needs would increase by about 780 % when heating needs would decrease by about 19 %.
Fig. 8. Evolution of heating and cooling needs (Unified Degree Day or UDD) from 1996–2005 to 2050–2100 periods (Bubble diameters function of the evolution of number of hours where temperature is above 28◦C: +50 % in the legend). (A) Scenario A2, (B) Scenario B2.
quite cold during the winter having extreme weathers some-times, despite the global warming, which could explain this tendency.
4 Discussion
Due to the global warming, UDD18 tends to decrease while UDD25 and NHT28 tend to increase. These tendencies are accentuated for the worse case climate scenario A2. A de-crease of UDD18 could prevent a dede-crease in heating needs and consumptions. The more the outside temperature is high, the more UDD18 is low and the less necessary it is to heat a building. The global warming should logically imply less energy consumption for heating in mid-latitudes. However, these evolutions are tendencies and the climate variability is still present every year.
On the opposite side, the more NHT28 is increasing, the more UDD25 is expected to increase as well. Potential im-pacts could be urban heat island effect intensification, com-fort and health risk increase and more energy needs for cool-ing. These vulnerabilities can be classified into two vulner-ability models (Fig. 9), the functional and the bio-physical vulnerability models (Arnaud, 2011), showing possible
im-Fig. 9. Vulnerability models and impacts on energy, comfort and health.
pacts on energy, comfort and health. Our climate indicators allow us to put forward working or malfunction issues related to urban climate. For instance, industrial sectors and services in France would be more concerned about energy needs to cool buildings, since just a few apartments have cooling sys-tems. Although these indicators are independently studied and presented, they are all connected. For instance, UDD25 and NHT28 have the same tendency, data for a temperature above 28◦C being taking into account for both indicators. Moreover, in general, if more cooling is needed, this implies less heating in buildings.
New environmental building conception tries to avoid cooling systems since this implies more energy consump-tions. So, either a massive reform of environmental con-ceptions and building standards would be necessary (Roaf et al., 2005) or a massive installation of cooling systems would have to be done. There will be a price to pay: price of energy or a new vision of building conception. Hallegatte (2007) raised a fundamental question when he asked if population will accept the use of cooling systems everywhere in Paris as in big cities in the USA. Of course, there will be an economic impact added to energy and carbon dioxide emission impacts which are the basis of the adaptation to climate change in ur-ban areas. Answering this question is not so easy since urur-ban climate studies are complex because of the multidisciplinary fields and actors.
called base temperature, and equal to the lowest outside mean temperature in the year. For instance in Paris and its region, this base temperature is equal to−7◦C. No data reaches this base temperature in the M´et´eo-France data for the period 2050–2100. So, it would not be necessary to change heat-ing systems already installed in Paris in the future which are well designed in the case of a global warming. But problems could come from extreme colds and a massive demand of en-ergy for heating at the same time. So, heating systems are not questioned per say. This is more the network itself, the mean of energy production and distribution which are questioned, in particular, for electricity. A strong energy demand would imply a strong energy production. This situation could gen-erate crisis situations difficult to manage.
As for heating demands, we could get the same prob-lems during heat wave events with cooling systems. NHT28 and UDD25 tendencies show a strong vulnerability about the electricity network during hot days with a possible crash in the network depending on power peak limits and energy de-mands for cooling. Power peaks would happen mainly in the summer. But if demands are too strong, this could gener-ate electricity production problems upstream in the network. Considering a hydraulic production, what would be the en-ergy production if rivers drying out occur more frequently in the context of a global warming? Therefore, several adap-tation scenarios can be imagined for cooling building in the future. The first one would consist of installing cooling sys-tems in all old and new buildings. However, this extreme sce-nario is not recommended for environmental purposes (CO2 emissions for instance) or building design, in particular, if cooling systems are installed on facades. Moreover, this so-lution would lead to the same power peak and demand prob-lem during extreme hot events.
Another scenario would be to replace old cooling systems by new ones to get better installations in terms of energy con-sumptions. But the right technology has to be used. For in-stance, replacing cooling systems with humid air waste heat by dry air waste heat would increase the temperature by 2◦C in the city (CNRM-GAME, CNAM, Climespace, 2010). The use of air conditioners would then reinforce heat waste, in-creasing outside air temperature, which could heat buildings again, leading to a massive use of air conditioning, and so on. So, we have to pay attention to the choice of technology we want to use to adapt to climate change. In some cases, adapt-able solutions could be worse than doing nothing. Moreover, the city itself can have a negative impact on cooling needs. The cities are very attractive and density is increasing. These continuous demographic increases tend to reinforce cooling needs during hot events. It is a vicious circle.
To break down this circle, several actions are possible to improve urban climate. However, how to evaluate the efficiency of these actions? What would be the evolution of the UHI phenomenon in the future? How to integrate new climatic criteria in the urban planning? What would be available tools for decision-makers to evaluate impacts of
changes? The perspective of resilience within the context of climate change is then uncertain and difficult to do. Several levers of action for the UHI exist and are quite large, but all do not have the same efficiency. This one could vary during a day or as a function of a season (Colombert, 2008).
The main work will be to adapt current buildings, new ones representing only 1 % to 1.5 % of the French market. But communities and local authorities have to face a lot of legal constraints to plan and regulate space to improve urban climate. Besides, evaluation and quantification tools would be necessary to judge project qualities and urban resilience. The multiplicity of shapes in cities does not allow us to obtain a general answer or general law. For instance, UHI analysis in Paris showed that thermal anomaly is dependent of sea-sons or weather depressions in the region (Cantat, 2004), but mainly is due to radiation and wind speed (Bouyer, 2009). The use of morphological indicators as the sky view factor (Messaoud, 2009) or the aspect ratio is used to get empir-ical laws, but developed models cannot be reused as it is, in particular, for cities where climate is different (Bozonnet, 2006). If projections give a real increase in the lack of com-fort in cities, it is possible to attenuate undesirable effects by changing some urban characteristics. It is, however, neces-sary to rethink city planning and to adapt this one in order to keep a pleasant way of life and comfortable activities in cities.
One possible lever of action is to modify building shapes and city’s configurations. Height and width of buildings have to be thought over again to avoid canyon street formations where some radiation could get trapped and heat the air tem-perature. Acting on materials and their colour is another pathway to follow for modifying urban albedo, the reflective power of surfaces exposed to the light. The use of clear ma-terial (roofs and facades) would allow us to catch less heat which would be reflected towards the space and limit heat-ing the city. So, the attenuation of UHI could be possible by increasing albedo of buildings (Akbari et al., 2001, 2009; Gaffin, 2012). Despite this solution for cooling a city, this cannot avoid extreme hot events as predicted in climate sce-narios and lack of comfort in public space.
To improve this public comfort, shapes, aspects or geom-etry of public roads could be modified to increase albedo. Moreover, the increase of green roofs, vegetal facades or parks could limit heating a city as well. This green revolution could attenuate UHI and would offer shadows and relaxation spaces. Desplat et al. (2009) show that albedo and green surfaces are the two main levers which could contribute to cooling a city and reducing urban heat island effect. In their study, they put forward that these solutions would reduce the mean air temperature of a city by 2◦C and then attenuate the lack of comfort by the horizon 2030.
solutions would be to move polluting activities outside the city, reduce car traffic and allow more space for bikers or buses to avoid traffic jams and peak pollution, in particular, during rush hour. So, spatial city organization would have to be rethought like city density (building density, human den-sity, green denden-sity, etc.) or green space location in cities. Again, all these solutions call city planners, architects or pol-icy makers to adapt a city planning face to the global warm-ing. The single fact that urban heat island effect would be in-creased because of the global warming and possible negative consequences on people would happen, should lead actors to think cities differently by proposing adaptive strategies. This suggests a reframing of the traditional role of climate on a building in the architectural field to be reversed and look at the role of the building on local climate. The resilience to climate change will then be possible with an adaptive design, but with an adaptive consciences as well.
Acknowledgements. The authors address their thanks to the
Resilis partners. Resilis gathers researchers from the private sector (Egis, Iosis, Sogreah) involved in urban development or risk prevention, research laboratories (EIVP – Paris School of Engineering, LEESU – University of Marne-la-Vall´ee depart-ment of research in urban engineering, REEDS – University of Versailles-Saint Quentin department of research in economy, ecology and sustainable development), public research (Cema-gref – risk assessment, Fondaterra – foundation for sustainable territories). This complementariness in skills and knowledge will ensure the more holistic approach possible with the analy-sis of both technico-functionnal and socio-organizational resilience.
Edited by: B. Barroca
Reviewed by: M. Colombert and another anonymous referee
References
Akbari, A., Pomerantz, M. and Taha, H.: Cool surfaces and shade trees to reduce energy use and improve air quality in urban areas, Sol. Energy, 70, 295–310, 2001.
Akbari, H., Menon, S., and Rosenfeld, A.: Global cooling world-wide urban albedos to offset CO2, Climatic Change, 94, 275– 286, doi:10.1007/s10584-008-9515-9, 2009.
Arnaud, J. P., Toubin, M., and Serre D.: RESILIS: a research project to improve urban resilience, EGU, Vienna, Austria, 3–8 April 2011.
Badescu, V. (Ed.): Modeling Solar Radiation at the Earth’s Surface, Springer-Verlag, Berlin, Heidelberg, 2008.
Best, M. and Betts, R.: The impact of climate change on our cities, The impact of climate change on our cities, 2004.
Brandt, K: Does an “IDEAL” Urban Climate Exist?, 6th Interna-tional conference on Urban Climate, 443–445, 2006.
Bouyer, J.: Mod´elisation et simulation des microclimats urbains ´etude de l’impact de l’am´enagement urbain sur les consomma-tions ´energ´etiques des bˆatiments, PhD thesis, Ecole polytech-nique de l’Universit´e de Nantes, 2009.
Bozonnet, E.: les microclimats urbains et la demande ´energ´etique du bˆati, XXIVe Rencontres Universitaires de G´enie Civil, 2006.
Cantat, O.: L’ˆılot de chaleur urbain parisien selon les types de temps, Norois, 191, 75–102, 2004.
CNRM-GAME, CNAM, Climespace: CLIM2 French project, ur-ban climate and air conditioning, scientific report, November 2010.
Colombert, M.: Contribution `a l’analyse de la prise en compte du climat urbain dans les diff´erents moyens d’intervention sur la ville, PhD thesis, University of Marne la Vall´ee, 2008.
Desplat, J., Lauffenburger, M., Salagnac, J. L., Kounkou-Arnaud, R., Lemonsu, A., Colombert, M., and Masson, V.: Projet EPICEA, ´etude pluridisciplinaire des impacts du changement cli-matique `a l’´echelle de l’agglom´eration, Fifth Urban Research Symposium, 2009.
Eurostat: Statistiques de l’´energie – degr´es-jour de chauffage, available at: http://epp.eurostat.ec.europa.eu/portal/page/portal/ energy/data/database, 2010.
First Assessment Report of the Urban Climate Change Research Network: Climate Change and Cities, edited by: Rosenzweig, C., Solecki, W. D., Hammer, S. A. and Mehrotra, S., 312 pp., April 2011.
Gaffin, S. R., Imhoff, M., Rosenzweig, C., Khanbilvardi, R., Pasqualini, A., Kong, A. Y. Y., Grillo, D., Freed, A., Hillel, D., and Hartung, E.: Bright is the new black – multi-year perfor-mance of high-albedo roofs in an urban climate, Environ. Res. Lett., 7, 014029, doi:10.1088/1748-9326/7/1/014029, 2012. IDDRI (Institut du D´eveloppement Durable et des Relations
Inter-nationales): INVULNERABLe project, http://www.iddri.org/L’ iddri/Fondation/Projet-INVULNERABLe, 2010.
INVS, Rapport Annuel available at: http://archives. invs.sante.fr/publications/2007/rapport annuel 2006/
rapport annuel invs 2006.pdf (last access date 04/25/2012), 2006 .
IPCC: Special Report on Emissions Scenarios, 2000.
IPCC Fourth Assessment Report: Climate Change, (AR4), 2007. Hallegatte, S., Hourcade, J.-C., and Ambrosi, P.: Using Climate
Analogues for Assessing Climate Change Economic Impacts in Urban Areas, Climate Change, 82, 47–60, doi:10.1007/s10584-006-9161-z, 2007.
Hallegatte, S.: Accepterons-nous un Paris climatis´e `a l’am´ericaine?, Interview, La Lib´eration, newspaper, 2007.
Lang, S.: Undergraduate analysis, Undergraduate Texts in Math-ematics (2nd Edn.), Berlin, New York: Springer-Verlag, ISBN 978-0-387-94841-6, section II.4, 1997.
Lhomme, S., Serre, D., Diab, Y., and Lagagnier, R.: Les r´eseaux techniques face aux inondations ou comment d´efinir des indica-teurs de performances de ces r´eseaux pour ´evaluer la r´esilience urbaine, Bulletin de l’association des g´eographes franc¸ais, 487– 502, 2010.
Messaoud, B.: Approche physico-morphologique de l’alb´edo ef-fectif, Master thesis, Ecole Sup´erieure d’Architecture de Nantes, 2009.
M´et´eo France: Unified Degree Day definition: available at: http: //climatheque.meteo.fr/Docs/DJC-methode.pdf, 2005.
Remund, J. and Kunz, S.: The new version of the worldwide cli-matological database METEONORM, Proceedings of the ISES solar world congress 2003, G¨oteborg Sweden, CD-ROM Paper P6 39, 2003.
loca-tion, Sol. Energy, 62, 331–334, 1998.
Remund, J., Kunz, S., and Schilter, C.: Handbook of ME-TEONORM Version 6.0, Part II: theory, Meteotest, Fabrikstrasse 14, 3012, Bern, Switzerland, 2007.
Rey, G., Jougla, E., Fouillet, A., Pavillon, G., Bessemoulin, P., Frayssinet, P., Clavel, J., and H´emon, D.: The impact of major heat waves on all-cause and cause-specific mortality in France from 1971 to 2003, Int. Arch. Occup. Environ. Health, 80, 615– 626, 2007.
Roaf, S., Crichton, D., and Fergus, N.: Adapting buildings and cities for climate change, a 21st century survival guide, Elsevier, 363 pp., 2005.
Rosenzweig, C., Solecki, W. D., Parshall, L., Chopping, M., Pope, G., and Goldberg, R.: Characterizing the urban heat island in cur-rent and future climates in New-Jersey, Environ. Hazards, no. 6, 51–62, 2005.