Themed Section: Science and Technology
Design and Analysis of CMOS Based Temperature Sensor and
Its Readout Circuit
Pankaja. H. C, Dr. Shashidhar Tantry
Electronics and Communication, PESIT South Campus, Bangalore, Karnataka, India ABSTRACT
In this paper, the proposed sensor utilizes the temperature dependency of MOSFET and BJT for designing of this sensor. The voltage or current across MOSFETs and BJT always varies with the temperature, but the challenge in this project is to design these types of sensors to linearize this variation. This task is accomplished by proper selection of circuit architecture by adjusting W/L Ratio of the transistors and choosing the proper resistor value so that the non-linearity can be reduced. After achieving the linearity, readout circuit is designed for to digitize the obtained temperature information. The proposed temperature sensor is simulated in Cadence Analog Design Environment with GPDK180nm library.
I.
INTRODUCTIONTemperature is one of the most important fundamental physical quantity and is almost common in our daily life and which is independent of the amount of material i.e. temperature is having intensive property. As we know hundreds or thousands of devices are formed on thin silicon wafers[2]. Before the wafer is scribed and cut into individual chips, they are usually laser trimmed. Temperature is a physical quantity that is a measure of hotness and coldness on a numerical scale. In a body in its own internal thermal equilibrium, the temperature is spatially uniform. Temperature is important in all fields of natural science. One popular use of temperature sensors in VLSI implementation is in the emergence of RFID and wireless sensor network (WSN) applications.
With microprocessors scaling to higher performance and faster speed, heat dissipation has become a
growing concern. Excessive heat degrades
performance and increases power consumption of the entire system. Safe operation of the integrated circuits requires the prevention of excessive chip temperatures.
To prevent overheating, multiple integrated
temperature sensors are employed in the
microprocessor to monitor its thermal distribution.
II.
PROPOSED SCHEMEIn this paper, proposed sensor investigates two cases. In the first case, temperature sensor is designed by utilizing temperature dependency characteristics of BJT and MOSFET in Saturation region and in the second case, temperature sensor is designed by utilizing temperature dependency characteristics of only MOSFET in Sub threshold region.
The main aim of this project is to design a circuit to
obtain Proportional to absolute temperature
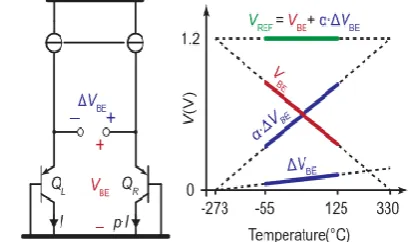
value(PTAT). To obtain this PTAT voltage, necessary design conditions has been considered. Basic operation of a PNP based circuit showing PTAT and CTAT behaviour is as shown in figure 1.
VT = KT/q………(1)
Where,
VT denotes thermal voltage.
T denotes temperature. Q denotes electric charge.
K denotes proportionality constant.
From equation (1),it is clear that the VT is directly
proportional to temperature.
Voltage across BJT is given by equation (2) VBE = VTln (I/IS)………(2)
I= IS e VBE/ VT………..…….(3)
Where,
VBE denotes base to emitter voltage.
I denotes the current flowing through each transistor. IS denotes reverse saturation current.
Equation (2) shows CTAT behaviour because of Is term.
When ‘n’ number of transistors are
considered ,equation becomes as shown in (4)
VBE1 = VTln (I/n IS)………..….(4)
∆ VBE= VBE - VBE1………(5)
∆ VBE= VTln (n)……….(6)
Where,
‘n’ denotes number of transistors.
∆ VBE denotes difference between base to emitter
voltage .
In equation (6), ∆ VBE represents PTAT voltage since it
is equal to VT because ln(n) is constant.
In equation (2), term (I/I) represents complementary
temperature. In this work ,the main concentration is on obtaining Thermal voltage because it is PTAT, so it is necessary to cancel the CTAT term.
To cancel the CTAT term, the necessary circuits have been designed by employing a technique which connects pnp transistors in parallel and so that voltages across them are same. The difference between the base to emitter voltages have been taken into consideration, which gives the required PTAT value.
A. Temperature dependency characteristics of BJT and MOSFET in Saturation region
In this proposed scheme, Temperature dependency characteristics of BJT and MOSFET in Saturation region is investigated . In the schematic shown in figure 2,the first circuit gives the voltage that is proportional to absolute temperature and this voltage is given as the input to the pmos of the differential amplifier inorder the get the required amplification range.In the final stage of the circuit ,comparator is designed by giving the differential amplifier output as the input to the first input of the comparator and pulse is given to the 2nd input so that necessary digitized temperature information is obtained. The drain current of an NMOS transistor in the saturation region is given by
ID=1/2 𝜇n𝐶𝑂𝑋 W/L(VGS-VTH)…… (7) Where,
W/L is the aspect ratio of the transistor. 𝜇 is the carrier mobility .
COX is the gate-oxide capacitance .
VTH is the threshold voltage of a MOSFET.
the drain current, but a lower mobility tends to decrease it.
B. Temperature dependency characteristics of only MOSFET in Sub threshold region
Sub threshold region operates with the gate to source voltage less than the transistors threshold voltage VT. This is done to ensure that all the transistors are indeed operating in the sub threshold region[1]
The sub-threshold drain current ID of a MOSFET is an exponential function of the gate-source voltage VGS, and given by
Where,
𝐼𝐷 = 𝐾𝐼0𝑒(𝑉𝐺𝑆−𝑉𝑇𝐻/𝜂𝑉𝑇)… (8)
𝐼0 = 𝜇𝐶(𝜂 −1) ×𝑉𝑇2
K is the aspect ratio (=W/L) of the transistor 𝜇 is the carrier mobility
COX is the gate-oxide capacitance .
VT is the thermal voltage .
VTH is the threshold voltage of a MOSFET .
𝜂 is the sub-threshold slope factor.
III.
BLOCK DIAGRAM OF THE PROPOSEDTEMPERATURE SENSOR
Figure 2. Block Diagram of the Proposed Temperature Sensor
This block diagram depicts the concept of whole operation where in the PTAT circuit block, the obtained voltage is given as an input to differential amplifier to obtain the amplified version and good linear range of the PTAT voltage versus temperature. In temperature to time conversion circuit, the obtained temperature information is converted into time.
Fig3.Schematic of the PTAT circuit in saturation region.
Fig4.Schematic of the Temperature to Time conversion circuit in saturation region.
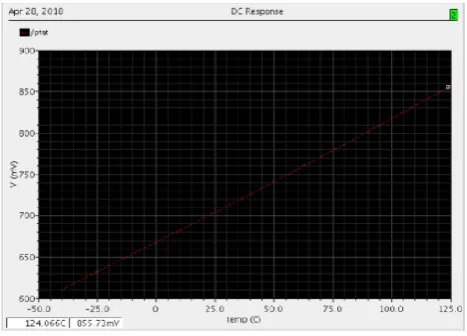
Figure 5. DC response of the proposedptat circuit showing the linear relationship of voltage and
Figure 6. DC response of the proposed differential amplifier circuit showing the linear relationship of
voltage and temperature.
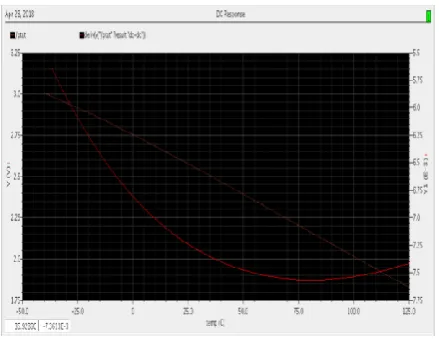
Figure 7.DC response showing the slope of the proposed ptat circuit.
Figure 8.DC response showing the slope of the differential amplifier circuit.
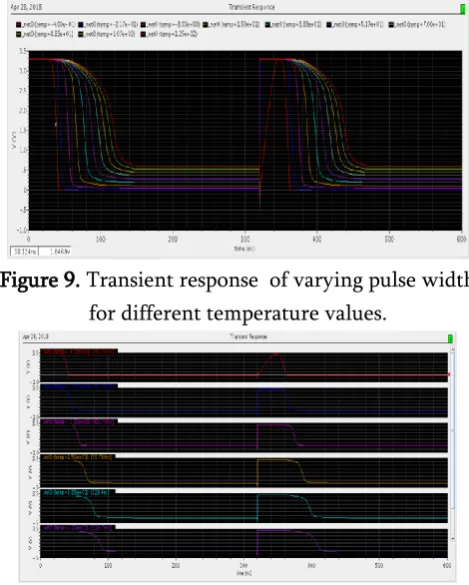
Figure 9. Transient response of varying pulse width for different temperature values.
Figure 10. Expanded version of Transient response of varying pulse width for different temperature values.
Figure 11.Schematic of the proposed temperature sensor in subthreshold region.
Figure 13.DC response showing the slope of the proposed temperature sensor.
Figure 14. Transient response of varying pulse width for different temperature values
Figure 15. Expanded version of Transient response of varying pulse width for different temperature
values.
IV.
COMPARISON TABLE OF TEMPERATURE DEPENDENCY CHARACTERI STICS IN
SATURATION AND SUBTHRESHOLD REGION
PARAMETER Proposed PTAT circuit in
saturation region
Differential amplifier circuit Proposed PTAT circuit in sub-threshold region
Voltage Range
(857.24mV-611.93mV)=245.31mV
(1.5745-423.61mV)=1.15V
(3.005V-1.832V)=1.173V Temperature
Range -40oC to +125oC - 40oC to +125oC - 40oc to +125oC
V.
COMPARISON TABLE OF SLOPE VERSUS TEMPERATURE RANGE IN SATURATION AND
SUBTHRESHOLD REGION
PARAMETER TEMPERATURE RANGE SLOPE in E-3
Proposed PTAT circuit in saturation region
-36OC to +60 OC 1.432 to 1.499
65 OC to 115 OC 1.5 to 1.599
116 OC to 125 OC 1.618
-28 OC to -10 OC 7.07 to 7.96
-9 OC to 61 OC 8 to 8.24
62 OC to 64 OC 7.1 to 7.02
65 OC to 87 OC 7 to 6.01
88 OC to 109 OC 5.9 to 5.01
110 OC to 125 OC 4.96 to 4.4
Proposed PTAT circuit in sub-threshold region
-36OC to +27 OC -5.65 to -5.99
-28 OC to 9 OC -6 to -6.99
10 OC to 125 OC -7.012 to -7.414
VI.
CONCLUSION
This paper proposes a design of temperature sensor by utilizing the temperature dependency characteristics of BJT and MOSFET. The voltage or current across MOSFETs and BJT always varies with the temperature, but the challenge in this project is to design these types of sensors to linearize this variation. In this proposed work,the required linearity is achieved within the sensing range . In the next level, Amplification circuit is designed to increase the voltage range which results in achieving more linearity. After achieving the linearity, readout circuit is designed to digitize the obtained temperature information. The proposed temperature sensor is simulated in Cadence Analog Design Environment with GPDK180nm library.
VII.
REFERENCES
[1]. Suraj Kumar Saw, Vijay Nath, "A 10.8 nW LOW POWER CMOS TEMPERATURE SENSOR FOR WIRELESS APPLICATION" 978-1-4799-7678-2/15/ IEEE 2015.
[2]. Bahman Yousefzadeh, Saleh Heidary Shalmany, and Kofi A. A. Makinwa, "A BJT-Based Temperature-to-Digital Converter With ±60 mK (3σ) Inaccuracy From −55 ◦C to+125 ◦C in 0.16μm CMOS" 0018-9200 IEEE 2017.
[3]. Subhra Chakraborty, Abhishek Pandey, Suraj Kumar
Sensor with Sensing Range of -25oC to 65Oc" 978-1-4799-8553-1/15/ IEEE 2015.
[4]. Sheng-Cheng Lee and Herming Chiueh ," A 69 µW CMOS Smart Temperature Sensor with an Inaccuracy of ±0.8°C (3σ) from -50°C to 150°C" 978-1-4577-1767-3/12/ IEEE 2012.
[5]. Poki Chen, Chun-Chi Chen, Chin-Chung Tsai and Wen-Fu Lu "A Time-to-Digital-Converter-Based CMOS Smart Temperature Sensor" IEEE JOURNAL OF SOLID-STATE CIRCUITS, VOL. 40, NO. 8, AUGUST 2005.
[6]. Michiel A. P. Pertijs, Gerard C. M. Meijer and Johan H. Huijsing, " Precision Temperature Measurement Using CMOS Substrate PNP Transistors "IEEE SENSORS JOURNAL, VOL. 4, NO. 3, JUNE 2004. [7]. A. Bakker, "CMOS smart temperature sensors—An
overview," Proc. IEEE Sensors, vol. 2, pp. 1423–1427, Jun. 2002.
[8]. Gerard C. M. Meijer, Guijie Wang and Fabiano Fruett," Temperature Sensors and Voltage References Implemented in CMOS Technology "IEEE SENSORS JOURNAL, VOL. 1, NO. 3, OCTOBER 2001.
[9]. A. Bakker and J. H. Huijsing, "Micropower CMOS temperature sensor with digital output," IEEE J. Solid-State Circuits, vol. 31, no. 7, pp. 933–937, Jul. 1996.