University of Pennsylvania
ScholarlyCommons
Publicly Accessible Penn Dissertations
2016
Akt Controls Adipocyte Function And Systemic
Metabolism
Abigail Shearin
University of Pennsylvania, [email protected]
Follow this and additional works at:
https://repository.upenn.edu/edissertations
Part of the
Biology Commons,
Cell Biology Commons, and the
Physiology Commons
This paper is posted at ScholarlyCommons.https://repository.upenn.edu/edissertations/2582
For more information, please [email protected].
Recommended Citation
Shearin, Abigail, "Akt Controls Adipocyte Function And Systemic Metabolism" (2016).Publicly Accessible Penn Dissertations. 2582.
Akt Controls Adipocyte Function And Systemic Metabolism
Abstract ABSTRACT
AKT CONTROLS ADIPOCYTE FUNCTION AND SYSTEMIC METABOLISM
Abigail L. Shearin
Morris J. Birnbaum
Adipose tissue is a key regulator of energy homeostasis. Diseases with an increase or decrease in adiposity result in perturbations of systemic metabolism. The insulin signaling and insulin-like growth factor 1 (IGF-1) cascades are vital to the function of many tissues during development and in the mature organism. AKT, a Ser/Thr kinase, is a central node in the insulin and IGF-1 pathways. In the liver, much is known about the consequences when insulin-AKT signaling is lost, but adipose tissue has presented a unique challenge to study in vivo. The extant evidence suggests that manipulating the insulin-signaling cascade in adipose causes
systemic insulin resistance (IR), but often these models exhibit a lipodystrophy, implicating insulin/IGF-1 signaling as required for adipocyte differentiation or maintenance. In vitro work has identified the insulin pathway as necessary for adipocyte differentiation. The mechanism through which adipocyte IR causes systemic IR has remained elusive. We used the AdipoQ-Cre to delete Akt1 and Akt2 simultaneously (Adipo-AKT KO) and individually (Adipo-(Adipo-AKT1 KO, Adipo-(Adipo-AKT2 KO) to understand how loss of (Adipo-AKT signaling affects the mature adipocyte. Adipo-AKT KO mice have a severe lipodystrophy with hyperinsulinemia, hepatosteatosis, and perturbed glucose homeostasis. Adipo-AKT1 KO mice have no obvious defects, but Adipo-AKT2 KO mice have systemic IR, with hyperinsulinemia, elevated free fatty acids (FFAs), and blunted insulin-stimulated glucose uptake in adipocytes. This defect has been proposed to account for the observed IR in models with loss of adipocyte insulin signaling, supported by work using the aP2-Cre to delete glucose transporter 4 (aP2-Glut4 KO), the insulin-responsive glucose transporter, but subsequent work has shown the aP2-Cre is not adipocyte-specific. We tested this mechanism by generating mice with AdipoQ-Cre deletion of Glut4 (Adipo-Glut4 KO). These mice do not have systemic IR, unlike the aP2-Glut4 KO. We conclude that loss of adipocyte glucose uptake cannot account for the IR in the Adipo-AKT2 KO, and that the most likely candidate for the propagation of IR from the adipocyte to the liver is elevated FFAs, which promote hepatic glucose production. We propose that loss of AKT2 causes elevated FFAs because of blunted suppression of lipolysis in response to insulin.
Degree Type Dissertation
Degree Name
Doctor of Philosophy (PhD)
Graduate Group
First Advisor Morris J. Birnbaum
Second Advisor Patrick Seale
Keywords
Adipocyte, Akt, Diabetes, Insulin resistance, Lipodystrophy, Obesity
Subject Categories
AKT CONTROLS ADIPOCYTE FUNCTION AND SYSTEMIC METABOLISM
Abigail L. Shearin
A DISSERTATION
in
Cellular and Molecular Biology
Presented to the Faculties of the University of Pennsylvania
in
Partial Fulfillment of the Requirements for the
Degree of Doctor of Philosophy
2016
Supervisor of Dissertation Co-Supervisor of Dissertation
_________________________ _______________________
Morris J. Birnbaum, MD, PhD Patrick Seale, PhD
Emeritus Professor of Medicine Associate Professor of Cell
and Developmental Biology
Graduate Group Chairperson
_________________________
Daniel S. Kessler, PhD, Associate Professor of Cell and Developmental Biology
Dissertation Committee
Kendra K. Bence, PhD, Former Associate Professor of Animal Biology-Chair
Christopher A. Hunter, PhD, Mindy Halikman Heyer Distinguished Professor of Pathobiology, University of Pennsylvania School of Veterinary Medicine
Dedication
ACKNOWLEDGMENTS
First and foremost, I would like to acknowledge my thesis mentor, Morrie Birnbaum, and
my co-mentor, Patrick Seale, without whom this work would not have been possible and this
thesis would never have been completed. I would like to express my ultimate gratitude to the
collaborative and collegial atmosphere in both the Birnbaum and Seale labs that made learning
and doing the hard task of science fun, even when it was not always rewarding. I have had the
good fortune to make friends in two outstanding labs during my thesis career and benefit from the
mentorship of two spectacular scientists at different stages of their career. I have grown
immensely as a person and scientist and have had the privilege to observe both a senior,
established investigator and a junior, rising investigator run labs and interpret data. Morrie
provided exacting and supportive guidance during the early stages of my thesis and Patrick has
engaged in this work in a way I did not think I would find after Morrie’s departure. Thank you to
both for their hard work and dedication to this project and to me as a graduate student and
up-and-coming scientist.
I am incredibly indebted to the VMD-PhD program and my thesis committee, especially
my committee chair, Kendra Bence, for their support, financial and emotional, and feedback over
the years.
I would like to thank my dog, Beeblebrox, and my cat, Cecil, for being lights in my day no
matter what had happened while I was not home with them. They are always present and ready
to offer a cuddle or goofy expression when I most need it. Bee especially has provided me with a
distraction when most necessary by forcing me to commit to take him to classes and on hikes to
relieve the stressors of scientific learning.
Lastly, I would like to thank my family, friends, and boyfriend, Toby, all of whom have
provided me with immense support and love during both the good times and bad times of the
PhD. Everyone in my life has always been proud and interested in what I am doing and I am very
fortunate to be surrounded personally and professionally by such caring and generous people.
ABSTRACT
AKT CONTROLS ADIPOCYTE FUNCTION AND SYSTEMIC METABOLISM
Abigail L. Shearin
Morris J. Birnbaum
Adipose tissue is a key regulator of energy homeostasis. Diseases with an
increase or decrease in adiposity result in perturbations of systemic metabolism. The
insulin signaling and insulin-like growth factor 1 (IGF-1) cascades are vital to the function
of many tissues during development and in the mature organism. AKT, a Ser/Thr kinase,
is a central node in the insulin and IGF-1 pathways. In the liver, much is known about the
consequences when insulin-AKT signaling is lost, but adipose tissue has presented a
unique challenge to study in vivo. The extant evidence suggests that manipulating the
insulin-signaling cascade in adipose causes systemic insulin resistance (IR), but often
these models exhibit a lipodystrophy, implicating insulin/IGF-1 signaling as required for
adipocyte differentiation or maintenance. In vitro work has identified the insulin pathway
as necessary for adipocyte differentiation. The mechanism through which adipocyte IR
causes systemic IR has remained elusive. We used the AdipoQ-Cre to delete Akt1 and
Akt2 simultaneously (Adipo-AKT KO) and individually (Adipo-AKT1 KO, Adipo-AKT2 KO)
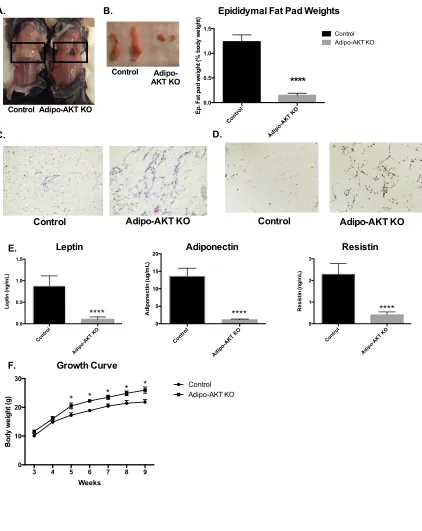
to understand how loss of AKT signaling affects the mature adipocyte. Adipo-AKT KO
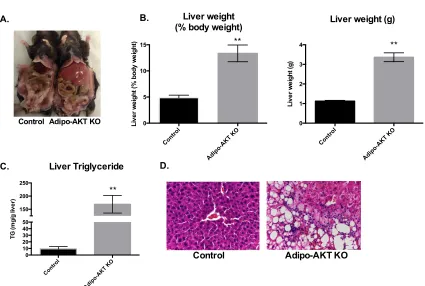
mice have a severe lipodystrophy with hyperinsulinemia, hepatosteatosis, and perturbed
glucose homeostasis. Adipo-AKT1 KO mice have no obvious defects, but Adipo-AKT2
KO mice have systemic IR, with hyperinsulinemia, elevated free fatty acids (FFAs), and
blunted insulin-stimulated glucose uptake in adipocytes. This defect has been proposed
to account for the observed IR in models with loss of adipocyte insulin signaling,
the insulin-responsive glucose transporter, but subsequent work has shown the aP2-Cre
is not adipocyte-specific. We tested this mechanism by generating mice with AdipoQ-Cre
deletion of Glut4 (Adipo-Glut4 KO). These mice do not have systemic IR, unlike the
aP2-Glut4 KO. We conclude that loss of adipocyte glucose uptake cannot account for the IR
in the Adipo-AKT2 KO, and that the most likely candidate for the propagation of IR from
the adipocyte to the liver is elevated FFAs, which promote hepatic glucose production.
We propose that loss of AKT2 causes elevated FFAs because of blunted suppression of
TABLE OF CONTENTS
ACKNOWLEDGMENTS
... III
ABSTRACT
... IV
LIST OF TABLES
... IX
LIST OF FIGURES
... X
PREFACE
... XI
CHAPTER 1:
... 1
GENERAL INTRODUCTION
... 1
1.1 Canonical insulin signaling ... 2
1.2 Insulin action is required for adipocyte differentiation and maintenance ... 10
1.3 β-adrenergic and insulin signaling regulate lipolysis in adipocytes ... 14
1.4 Insulin-stimulated glucose uptake in myocytes and adipocytes ... 18
1.5 Insulin and glucose stimulate de novo lipogenesis in adipocytes ... 21
1.6 Adipose tissue as an endocrine organ ... 24
1.7 Lipodystrophy leads to systemic insulin resistance ... 27
1.8 Obesity, insulin resistance, and Type 2 diabetes mellitus ... 28
1.10 Adipocyte insulin resistance as the causal event in systemic insulin
resistance ... 31
1.11 AKT is required for systemic insulin sensitivity ... 33
CHAPTER 2:
... 41
LACK OF AKT IN ADIPOCYTES CAUSES SEVERE LIPODYSTROPHY
(SHEARIN ET AL., 2016)
... 41
CHAPTER 3:
... 57
ADIPOCYTE AKT2 CONTROLS CIRCULATING FREE FATTY ACIDS AND
SYSTEMIC INSULIN SENSITIVITY
... 57
CHAPTER 4:
... 90
ADIPOCYTE
FOXO1
DELETION RESCUES BROWN FAT IN THE ADIPO-AKT
KO, BUT HAS NO EFFECT ON ADIPO-AKT2 KO
... 90
CHAPTER 5:
... 102
SUMMARY AND SPECULATION
... 102
5.1 AKT is required for adipocyte function ... 103
5.2 Adipocyte Akt1 is dispensable for systemic insulin sensitivity ... 106
5.3 Adipocyte Akt2 controls systemic metabolism ... 106
5.4 The adipocyte mechanism(s) that propagate insulin resistance ... 111
CHAPTER 6:
... 122
REFERENCES:
... 133
LIST OF TABLES
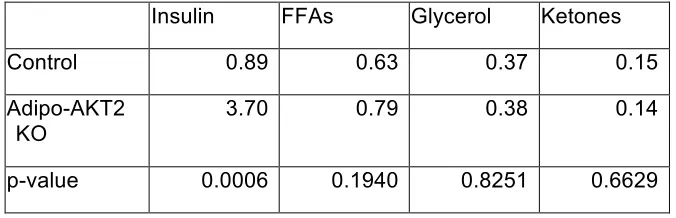
Table 3-1. Serum chemistries in the ad libitum state for control and Adipo-AKT2 KO mice.
Table 6-1. Primers for genotyping mice.
LIST OF FIGURES
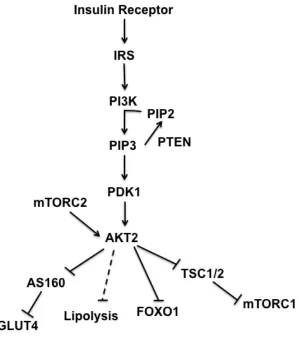
Figure 1-1. The insulin signaling cascade
Figure 2-1. Adipo-AKT knockout mice are lipodystrophic
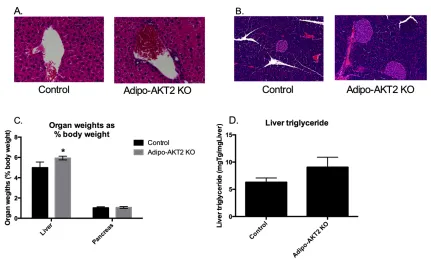
Figure 2-2. Adipo-AKT knockout mice have hepatomegaly
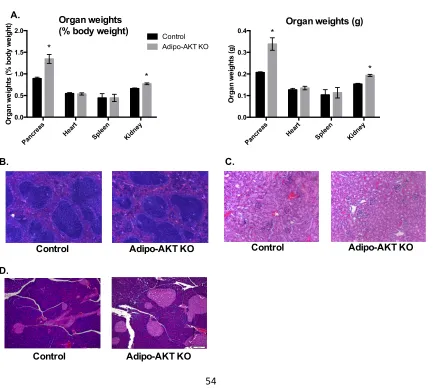
Figure 2-3. Adipo-AKT KO mice have enlarged pancreases and renomegaly
Figure 2-4. Adipo-AKT mice are insulin-resistant
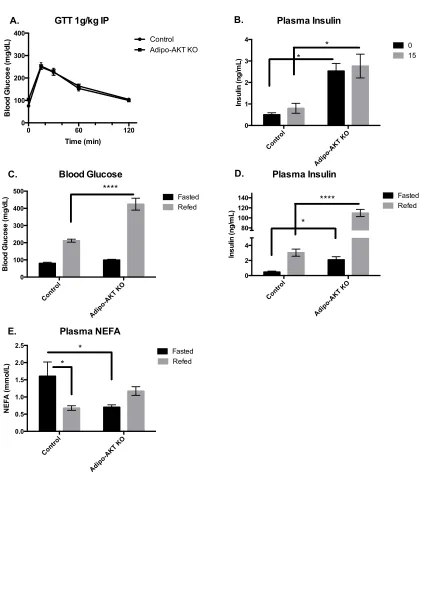
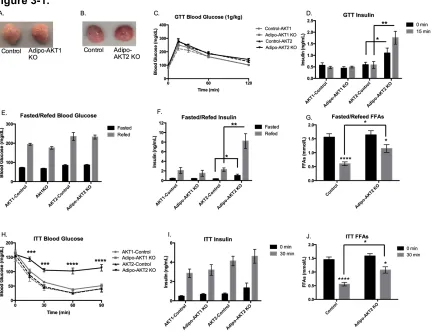
Figure 3-1. Lack of adipocyte AKT2, but not AKT1, causes hyperinsulinemia and insulin resistance
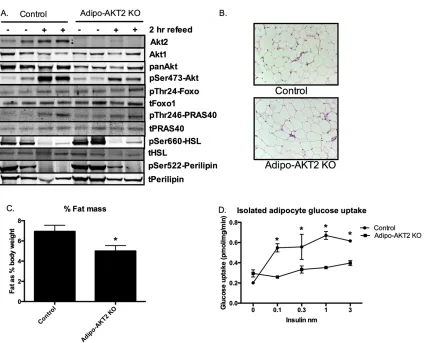
Figure 3-2. Adipo-AKT2 mice have functional adipose insulin resistance
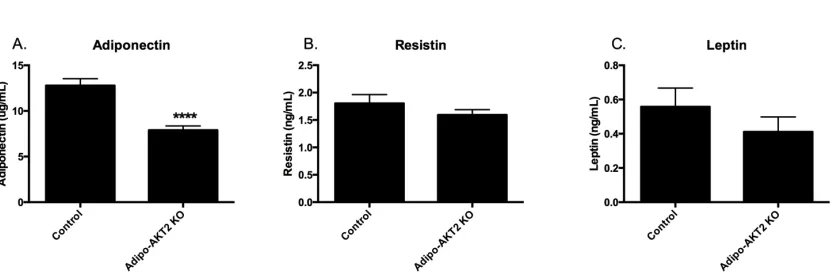
Figure 3-3. Circulating adiponectin is reduced in Adipo-AKT2 KO mice
Figure 3-4. Adipo-AKT2 KO mice have mild hepatomegaly and enlarged islets
Figure 3-5. Adipo-AKT2 KO mice aged 9-12 months do not exhibit glucose intolerance
Figure 3-6. Loss of adipocyte AKT2 causes hepatic and muscle insulin resistance
Figure 3-7. Mice with adipocyte-specific loss of Glut4 do not have hyperinsulinemia or glucose intolerance
Figure 3-8. Female mice with adipocyte-specific deletion of Glut4 do not have hepatic insulin resistance
Figure 3-9. Male Adipo-Glut4 KO mice do not have insulin resistance
Figure 3-10. Transcription of ChREBP and FASN are reduced in Adipo-AKT2 KO mice
Figure 3-11. Other published mechanisms of adipocyte insulin resistance are unchanged in Adipo-AKT2 KO mice
Figure 4-1. Mice without Akt1/Akt2/Foxo1 have brown adipose tissue but not white adipose tissue
Figure 4-2. TFKO mice have improved glucose homeostasis compared to Adipo-AKT KO mice, but are insulin resistance
Figure 4-3. Mice with simultaneous adipocyte deletion of Akt2 and Foxo1 do not have decreased insulin levels in response to a meal challenge
PREFACE
Adipose tissue, once considered inert, is now known to include a multitude of cell
types, including immune cells, vascular and perivascular cells, neuronal cells, adipocyte
precursors, and mature adipocytes. It is, consequently, the focus of increasing scientific
interest, particularly relating to how new adipocytes are generated, how they change in
response in stimuli, how they function in the mature state, and how they impact the body
systemically. Adipose tissue is now considered central to the maintenance of energy
homeostasis, which has led to an improved understanding of both lipodystrophic
disorders and obesity. Lipodystrophic and obese patients have likewise benefited greatly
from the knowledge gained in studies of adipocytes, particularly as regulators of glucose,
fatty acids, and adipokines. Our understanding of the important of adipokines has
especially improved the treatment of lipodystrophic individuals as they often have
dramatically decreased levels, especially of leptin. Some clinical success has been
achieved in treating these patients with leptin replacement therapy.
Lipodystrophic patients and models have led to a greater appreciation for the
requirement of healthy, functional adipose tissue to maintain systemic homeostasis,
informing our knowledge of the opposite end of the adiposity spectrum, obesity. Those
with a severe lipodystrophy exhibit many of the same physiological ailments that affect
patients with insulin resistance (IR) and Type 2 diabetes mellitus (T2DM), such as
hepatosteatosis and hyperinsulinemia, though often leptin levels are elevated in obese
patients and they can exhibit leptin resistance as well as insulin resistance. How obesity
predisposes to IR and T2DM is not well defined, but improving our understanding of how
insulin resistant adipose tissue affects whole body energy homeostasis is imperative to
work has been hampered by the difficulty of specifically targeting adipocytes in vivo, and
because manipulating the insulin signaling pathway in an attempt to cause IR often
leads to lipodystrophic models, with little to no adipose tissue available for study and
severe systemic dysfunction. However, from this work and in vitro studies, we have
learned that many potential factors made, stored, or secreted by adipose tissue play a
role in how adipocytes are altered in the insulin resistant state and why that dysfunction
CHAPTER 1:
General Introduction
1.1 Canonical insulin signaling
Overview of the insulin signaling cascade
In the adult organism, insulin and insulin-like growth factor-1 (IGF-1) are
essential for homeostasis. Insulin and IGF-1 have many actions in every tissue and cell
type of the body, but insulin, and IGF-1 to a less extent, are especially crucial in organs
responsible for the maintenance of energy balance: brain, liver, muscle, and adipose
(Rask-Madsen and Kahn, 2012). Activation of the insulin or IGF-1 receptor initiates a
complex cellular cascade that, while similar in broad terms, is distinct in each tissue.
Here we focus largely on the adipocyte, with insulin regulating anabolism via
downstream targets common to all tissues, and also glucose uptake and suppression of
lipolysis (Figure 1-1). In the fasted state, circulating insulin levels are low and the tissues
are in the basal state. During a meal, insulin is released from beta cells in the pancreas
in response to glucose, fatty acids, and other factors (Rorsman and Braun, 2013). In all
of these tissues, insulin binds to its receptor (IR) on the cell surface, activating several
kinases including the Grb2-associated-binder-1 (Gab1) and the insulin receptor
substrates (IRS) 1 and 2, which are activated by IR in a relatively specific manner by
recruiting the receptor via the pleckstrin homology (PH) and phosphotyrosine binding
(PTB) domain (Farhang-Fallah et al., 2002; Taniguchi et al., 2006). IRS1/2 is able to
bind a number of proteins, including Grb2, which activates the cell growth pathway
Ras-mitogen-activated-protein kinase (Ras-MAPK), but the climacteric kinase activated by
IRS1/2 is phosphotidylinositol (3,4,5)-kinase (PI3K) (Rask-Madsen and Kahn, 2012;
Taniguchi et al., 2006). The Ras-MAPK pathway, regulated by Grb2 downstream of
IRS1/2, is coordinately regulated with the PI3K pathway to control cell growth and
regulates transcription factors critical fro cell growth and proliferation and p90 ribosomal
S6K, an integral kinase for protein synthesis (Avruch, 1998; Mendoza et al., 2011). PI3K
is a family of kinases, with classes I, II, and III having separate functions and
physiological implications that are further explored below (Thorpe et al., 2015).
PI3K I is the isoform stimulated by insulin and other growth factors and involved
in the regulation of propagating these signals throughout the cell (Thorpe et al., 2015).
Once activated, PI3K phosphorylates the inositol ring of phosphatidylinositol (4,5)
bisphosphate to phosphotidylinositol (3,4,5) triphosphate (PIP3), which subsequently
initiates a cascade of serine/threonine kinase activity, directly recruiting
phosphoinositide-dependent kinase 1 (PDK1) and its substrate AKT/PKB, among others,
to the cell membrane (Dibble and Cantley, 2015). PDK1 phosphorylates AKT at Thr308,
but maximal activation of AKT, a central ser/thr kinase in the insulin signaling cascade,
also requires phosphorylation at Ser473 by the mechanistic target of rapamycin complex
2 (mTORC2) (Sarbassov et al., 2005). AKT represents a central node in the insulin
signaling cascade, with multiple, separate pathways downstream controlling various cell
processes (Figure 1-1).
AKT activity promotes anabolism and suppresses catabolism
Akt has three isoforms with each isoform encoded by a distinct gene and
expression differentially regulated during time points of development and in adult tissues
(Dummler and Hemmings, 2007). Akt1 is ubiquitously expressed in all tissues of the
body and is most critical during development and cellular proliferation (Walker et al.,
is most active and its neurological function remains elusive (Easton et al., 2005; Walker
et al., 1998). In the insulin-responsive tissues of adult organisms acutely regulated by
insulin: liver, muscle, and adipose, Akt2 is the predominantly expressed isoform
(Altomare et al., 1995; 1998). Akt1 is expressed in these tissues as well, but at lower
levels (Walker et al., 1998). Downstream of AKT, the insulin signaling cascade becomes
specific to cell-type, dependent on the obligatory functions of the tissue. Well-established
direct substrates of AKT include the transcription factor forkhead box O (FOXO), the
tuberous sclerosis complex (TSC1/2) complex--a GTPase activating protein for Rheb,
proline-rich substrate 40 (PRAS40)—a protein associated with the mechanistic target of
rapamycin complex 1 (mTORC1), and the Rab GTPase activating protein
AS160/TBC1D4 that regulates glucose transport (Dibble and Cantley, 2015; Siddle,
2011). Canonically, AKT directly regulates insulin-mediated suppression of lipolysis in
adipocytes via phosphorylation of phosphodiesterase 3B, but an AKT-independent
pathway has also been identified (Choi et al., 2010; DiPilato et al., 2015).
FOXO
FOXO, DAF-16 in C. elegans, was identified as being downstream of the insulin
receptor like gene (DAF-2), PI3K (AGE1) and AKT from a genetic screen of dauer larvae
(Gottlieb and Ruvkun, 1994; Lin et al., 1997; Ogg et al., 1997; Paradis and Ruvkun,
1998; Riddle et al., 1981). Since its identification as a pivotal member of the insulin
signaling cascade, FOXO has been heavily studied. In mammals, there are 4 FOXO
family members, 1, 3a or 3, 4, and 6. Foxo6 is expressed most highly in neurons, but the
deletion leading to developmental defects, and Foxo4 deletion causing no obvious
defects (Paik et al., 2007). In the adult animal, FOXO1 (termed FOXO here) is regulated
by both AKT phosphorylation and acetylation by Sirtuin 1 (Sirt1), and histone
deacytelases (HDACs) (Frescas et al., 2005; Mihaylova et al., 2011). Active, nuclear
FOXO is not phosphorylated and most lines of evidence suggest a lack of acetylation is
also important for maximal FOXO activity, though acetylation by HDAC appears to
positively regulate FOXO (Mihaylova et al., 2011). Several other mechanisms may exist
that regulate FOXO activity on some level; evidence suggests XBP-1 in the unfolded
protein response indirectly regulates FOXO and PGC-1a may also induce glycosylation
(Housley et al., 2009; Y. Zhou et al., 2011).
Upon stimulation of AKT, FOXO is phosphorylated at Thr24 and becomes
excluded from the nucleus (Matsuzaki et al., 2003). As a transcription factor active in the
fasting state, FOXO promotes the expression of genes necessary for development and
in the adult maintenance of energy balance in an insulin-poor state (Matsumoto et al.,
2006; Tikhanovich et al., 2013). Conservation of FOXO targets is also observed, with
1659 targets shared between the mouse and C. elegans (Webb et al., 2016). In the liver,
where FOXO functions in the adult mammal are the most thoroughly studied, it promotes
expression of gluconeogenic genes such as glucose-6-phosphatase (G6Pase) and
phosphoenolpyruvate carboxykinase (PEPCK) (W. Zhang et al., 2006). Mice that
overexpress FOXO have increased gluconeogenesis, while mice without hepatic FOXO
develop fasting hypoglycemia (Matsumoto et al., 2006; 2007). In mice without hepatic
IR-AKT signaling, gluconeogenesis is unrestrained and deleting FOXO simultaneously
While FOXO’s regulation of gluconeogenic genes is well-established, how it
regulates genes involved in lipid synthesis and fatty acid oxidation is less clear. In mice
without hepatic Foxo1 and Foxo3a, hepatic lipid content was increased, but serum
triglycerides were decreased (K. Zhang et al., 2012). The authors also showed
decreases in fatty acid synthase (FAS), a key enzyme in DNL, and HMG CoA reductase,
the committed enzyme in fatty acid oxidation (K. Zhang et al., 2012). Increased FOXO
activity in the liver causes reduced expression of key lipogenic genes such as sterol
regulatory element binding protein 1c (SREBP1c), acetyl-CoA carboxylase (ACC) and
fatty acid synthase (FAS) (W. Zhang et al., 2006). This is consistent with decreases in
the expression of these genes in mice lacking AKT in the liver (Titchenell et al., 2016). A
role for FOXO in the regulation of liver albumin production has also been described;
mice without hepatic AKT or IR and active FOXO suppress albumin production, but
concomitant deletion rescues the hypoalbuminemia (Q. Chen et al., 2016).
In muscle, active FOXO downstream of decreased AKT signaling causing
atrophy in cultured mytobules through elevated atrogin-1, a muscle-specific
ubiquitin-ligase, expression, and decreased FOXO induction leading to downregulation of
atrogin-1 transcript levels (Sandri et al., 2004). Recent work has found similar results in vivo,
with deletion of insulin receptor and insulin-growth factor-1 receptor in the muscle
resulting in nuclear accumulation of active FOXO and upregulation of both atrophy and
autophagy genetic programs. Subsequent deletion of FOXO in this model rescues the
atrophy of muscle mass (O'Neill et al., 2016). The role of FOXO in mature adipose tissue
has been poorly described, though its role in adipocyte differentiation is better
understood and is discussed in the below section on insulin signaling in the adipocyte.
improvement in glucose tolerance and insulin sensitivity, potentially as a result of the
observed increased energy expenditure (Nakae et al., 2008).
mTORC1
Within the context of insulin signaling, the primary directive of tuberous sclerosis
complex 1/2 is the suppression of mTORC1 activity without insulin, and the
permissiveness of mTORC1 activity in response to insulin. In the basal, or fasted, state,
TSC1/2 is maintained at the lysosome in a GDP-bound Rheb-dependent manner,
preventing mTORC1 association of the Rheb and the lysosome (Menon et al., 2014). In
response to enagement of the insulin receptor and subsequent signaling events,
including AKT phosphorylation of TSC complex at multiple sites, TSC1/2 is released
from Rheb and the lysosome, allowing mTORC1 to bind to GTP-bound RHeb and be
activated (Menon et al., 2014). PRAS40 becomes dissociated from mTORC1 in
response to insulin, allowing for substrate binding (L. Wang et al., 2007). Amino acids,
mainly leucine and arginine, are also able to activate mTORC1 in an insulin-independent
manner. The mechanism for leucine’s promotion of mTORC1 activity was recently
elucidated to depend on relief of suppression of Rag guanine triphosphatases (GTPs)
through a GATOR2-dependent pathway (Wolfson et al., 2016).
Sestrin2-GATOR2 suppress mTORC1 activity and upon binding of leucine, this complex is
disrupted and inhibition of Rag is alleviated, allowing for the stimulation of mTORC1
(Budanov and Karin, 2008; Wolfson et al., 2016). CASTOR, or cellular arginine sensor
for mTORC1, also interacts with GATOR2 in a manner similar to Sestrin1 and
Once mTORC1 activity is induced, it is a driving force of anabolism in the cell as
a vital member of several pathways for synthesis of macromolecules, proteins, lipids,
and nucleic acids (Howell et al., 2013). mTORC1 can acutely initiate protein synthesis
via phosphorylation of eukaryotic-initiation factor 4-E binding proteins (4EBPs),
weakening it’s interaction with eukaryotic initiation factor (eIF), and allowing the
assemblage of the eIF4F translation initiation complex (X. M. Ma and Blenis, 2009). S6
kinase (S6K) is also a key substrate of mTORC1; S6K phosphorylates a number
proteins in the translation initiation complex, including the ribosomal protein S6, eIF4B,
and eEF2k (Raught et al., 2004; X. Wang et al., 2001). Additionally, mTORC1 promotes
overall translation through the induction of ribosomal biogenesis also through
phospohorylation of 4-EPB1/2, which translation 5’-terminal oligopyrimidine tracts
(5’-TOP) mRNAs (Thoreen et al., 2012).
Lipid synthesis is also regulated by mTORC1 in an sterol-regulatory element
binding protein 1 and 2 (SREBP)-dependent manner (Düvel et al., 2010; Porstmann et
al., 2008). SREBPs are responsible for the transcriptional regulation of a large
percentage of the lipogeneic program (Horton et al., 2002; 2003), and mTORC1 is
necessary for the processing of cellular SREBP to nuclear SREBP, a cleavage step that
requires SREBP cleavage-activating protein (SCAP) (Sun et al., 2007). SREBP1 is also
involved in the production of genes for the pentose-phosphate pathway (PPP), a salvage
pathway for ribose and a critical cellular source for de novo synthesis of purines
(Stincone et al., 2015). Via S6K, mTORC1 is also involved in the de novo synthesis of
pyrimidines (Ben-Sahra et al., 2013; Robitaille et al., 2013). Recent studies in adipose
tissue have highlighted mTORC1’s role in the beiging of inguinal fat, identifying β
et al., 2016; Tran et al., 2016). Other labs, however, did not observe the same loss in the
ability of adipose depots lacking raptor to beige (P. L. Lee et al., 2016). mTORC1 may
also play a role in the adipose tissue to stimulate lipolysis, which is discussed in more
detail below. This brief synopsis of the many functions of mTORC1 within the cell
underscores its incredible importance in the propagation of the insulin signal for
anabolism, cellular maintenance, growth, and overall energy homeostasis.
AS160
AS160, or AKT substrate 160kD, also termed TBC1D1, is a Rab-GAP protein
that is required for maximal insulin-stimulated glucose uptake and is directly
phosphorylated by AKT at multiple sites in response to insulin receptor activation
(Lansey et al., 2012; Sano et al., 2003). Phosphorylation of AS160 is also stimulated by
muscle contraction in an AMPK-depdent manner (Kramer et al., 2006). As a Rab-GAP
protein, it activates small GTPases at the Glut4 storage vesicle (GSV) along with
another Rab-GAP, the Ral-GAP complex (RGC) (X.-W. Chen et al., 2011; Leto and
Saltiel, 2012). AS160 is active in the basal, fasted state, maintaining Glut4 and the GSV
in insulin-poor conditions; it is deactivated by AKT2 phosphorylation, permitting Glut4 to
translocate to the plasma membrane (Sano et al., 2003). In fact, when AS160 is
depleted from 3T3L1 adipocytes, Glut4 is redistributed to the plasma membrane in basal
conditions and GSV exocytosis is reduced in response to insulin (Eguez et al., 2005).
When AS160 is overexpressed, Rab proteins are inactive and Glut4 translocation in
response to insulin is blunted (Sano et al., 2003). AS160 is required for maximal
mechanisms related to external trafficking are distinct from those regulating recycling of
the GSV (Zeigerer et al., 2004). Mice null for AS160 have a defect in insulin-stimulated
glucose uptake into both the muscle and adipose tissue. These mice have elevated
transcript levels of glucneogenic enzymes in the liver and at age 16 weeks have a
blunted response to insulin injection (Lansey et al., 2012; H. Y. Wang et al., 2013).
1.2 Insulin action is required for adipocyte differentiation and maintenance
Adipocyte differentiation
Adipocytes have a mesenchymal stem cell origin that becomes committed to an
adipocyte precursor state through the integration of physical characteristics of the extra
cellular matrix and WNT signaling (Cristancho and Lazar, 2011). The progression of this
committed precursor to a mature adipocyte is intensely regulated by multiple signaling
events in the bone morphogenetic protein (BMP) and CCAAT/enhancer-binding protein
(C/EBP) pathways, among others (Cristancho and Lazar, 2011). As differentiation
progresses, other factors become critical, most notably peroxisome proliferator-activated
receptor y (PPARy), which is both required and sufficient to induce adipogensis
(Cristancho and Lazar, 2011; Lazar, 2005). While adipogenesis occurs prenatally, it is
more prominent in the first few days postnatal, with rapid expansion of adipose depots in
the neonate (Kirtland and Harris, 1980). This expansion of adiposity is attributed to
increased nutrient intake, consistent with in vitro studies showing that insulin signaling is
required for adipogenesis. Studies performed in mouse embryonic fibroblasts (MEFs)
and NIH 3T3L1 cells has shown that loss of AKT, a central node in the insulin signaling
AKT is required for adipogenesis
AKT, a ser/thr kinase downstream of the insulin receptor and
phosphotidyl-inositol-3 kinase, is regulated during all states of adipogenesis. In precursor cells, the
Akt1 isoform is the most highly expressed (Altomare et al., 1998; Walker et al., 1998).
This isoform is ubiquitous in the organism and is particularly critical during development.
Akt2, the isoform most highly expressed in insulin responsive tissues, especially
adipocytes, muscle, and liver, is not as critical during development and is not highly
expressed in adipocyte precursors (Altomare et al., 1998). MEFs isolated from mice null
for Akt1 exhibit defective adipocyte differentiation, while MEFs from Akt2 null mice have
normal differentiation (Yun et al., 2009; 2008). This is further expanded upon by MEFs
from embryos null for both Akt1 and Akt2 successfully differentiating when AKT1 is
replaced but not when AKT2 alone is replaced (Yun et al., 2008). However, this is
inconsistent with in vivo data. Given the in vitro data, one would expect Akt1 null mice to
exhibit a lipodystrophy resulting from impaired adipogenesis. While these mice have an
overall smaller body size and are protected from diet-induced obesity, potentially as
result of increased energy expenditure, they do not have a change in their adiposity as
percent of body weight (Cho et al., 2001; Wan et al., 2011a). This suggests that the in
vivo milieu and potentially compensation from AKT2 allows for adipogenesis to progress.
As expected from the in vitro data, mice null for Akt2 do not have a decrease in adiposity
as adults, but exhibit a mild lipodystrophy when aged, the cause of which is unknown
(Cho, 2001; Garofalo et al., 2003). While mice lacking Akt1 and Akt2 in the germline die
shortly after birth, if they are rescued, they exhibit many defects, one of which is
FOXO inactivation is required for adipogenesis
The mechanistic role of insulin action and active AKT in adipogenesis is
proposed to be the suppression of FOXO activity (Nakae et al., 2008; 2003; Yun et al.,
2008). FOXO (Forkhead bOX-containing protein, subfamily O), has four isoforms, 1, 3a,
4, and 6 and is a critical transcription factor during both development and in mature
tissues (Accili and Arden, 2004). FOXO6 is not a substrate of AKT, while the other three
isoforms are regulated by AKT (Accili and Arden, 2004). All three of these FOXO
isoforms are expressed in mature adipocytes, but FOXO1 is the most highly expressed
in all depots (Nakae et al., 2003). Knockdown of AKT in 3T3L1 cells leads to active Foxo
and an inhibition of adipocyte differentiation. Overexpression of constitutively active
FOXO1, that cannot be phosphorylated by AKT, has similar effects, with no observed
adipocyte differentiation (Nakae et al., 2003).
Insulin signaling is required for adipocyte maintenance
How the adipocyte is maintained is largely unanswered in the field because of
the challenges of targeting the mature adipocyte until recent years. With the
development of a Cre recombinase transgene driven by the Adiponectin promoter,
AdipoQ-Cre, we are better able to target mature adipocytes, but this also has its
caveats. The inguinal adipose depot expresses adiponectin at levels sufficient to induce
Cre expression during development, but the epididymal depot does not have embryonic
expression of adiponectin (Hong et al., 2015). The precursors studied in the adult
Rodeheffer, 2013). How the expression of AdipoQ-Cre in the inguinal depot during
embryogenesis affects adipogenesis at later time points and in the adult is unknown.
The expression profile of adiponectin in developing brown adipose tissue (BAT) is also
unknown.
Work from multiple labs have targeted factors required for adipocyte
differentiation with the AdipoQ-Cre and suggest that these factors are also required for
adipocyte maintenance. The loss of adipocyte PPARy causes a severe lipodystrophy
with very little adipose tissue, hepatosteatosis, and hyperinsulinemia (F. Wang et al.,
2013). Based on current information regarding the timing of Cre expression, it is
reasonable to interpret that the loss of the epididymal fat tissue is a defect in
maintenance, while inguinal adipose may never develop and the BAT is unknown at this
time. The loss of the insulin receptor in the adipocyte also causes a lipodystrophy with
insulin resistance, though these mice have more adipose tissue than what is observed in
the PPARy mice (Qiang et al., 2016). The loss of both insulin receptor and insulin like
growth factor-1 receptor (IGF-1R) leads to a profound lipodystrophy, both with the use of
the congenital AdipoQ-Cre and when induced through use of the AdipoQ-CreER that
requires tamoxifen injection for Cre expression and recombination of the floxed alleles
(Boucher et al., 2016; Softic et al., 2016). This strongly suggests that insulin receptor
and IGF-1R are required for maintenance, though a confounding variable is that
tamoxifen alone can induce adipocyte loss followed by adipogenesis, leading to a
transient lipodystrophy, which is observed in the insulin receptor/IGF-1R knockout
adipose tissue: upon withdrawal of the tamoxifen, the adipocytes regenerate (Boucher et
1.3 β-adrenergic and insulin signaling regulate lipolysis in adipocytes
Stimulation of lipolysis during the fasting state
Adipose has long been described as a site of energy storage, but it’s importance
in the regulation of energy availability and the processes through which energy is stored
and released only began to generate interest in the past few decades (Rosen and
Spiegelman, 2014). The adipocyte provides energy to other tissues during the
insulin-poor fasting state and replenishes those stores in the insulin-replete fed state. In the
fasted state, adipose tissue undergoes lipolysis, the breakdown of triglyceride into fatty
acids and glycerol to supply energy to metabolically active organs, such as the liver,
muscle, brain, and heart (Duncan et al., 2007). In the fasted state in the absence of
insulin and nutrient intake, lipolysis is upregulated through B-adrenergic signaling,
activating adenylate cyclase and promoting cyclic AMP production, thereby activating
protein kinase A (PKA) via PDK1, a ser/thr kinase that stimulates lipolysis by
phosphorylating and activating several lipases (Cheng et al., 1998). The key enzymes
involved in lipolysis have multiple points of regulation, especially through Perilipin, which
is phosphorylated directly by PKA at several residues required for maximal activation,
including ser497 and ser522 (H. H. Zhang et al., 2003).
Perilipin
Perilipin has two established functions in the regulation of lipolysis.
Un-phosphorylated Perilipin binds to the lipid droplet and protects it from cellular lipases,
making it a critical element in the preservation of lipid stores in the adipocyte (Tansey et
lipases access to the lipid droplet, and the second by releasing comparative gene
identification-58 (CGI-58), a cofactor for adipocyte triglyceride lipase (ATGL) that Perlipin
binds in the insulin-poor state and is also phosphorylated directly by PKA (Lass et al.,
2006; Sahu-Osen et al., 2015; Yamaguchi et al., 2004; 2007). CGI-58 enhances
activation of ATGL, the initiating step of lipolysis, hydrolysis of triglyceride of
diacylglycerol (Lass et al., 2006). PKA directly phosphorylates both ATGL and
hormone-sensitivie lipase (HSL) (Krintel et al., 2009; Pagnon et al., 2012). HSL is required for the
hydrolysis of diacylglycerol to monoacylglycerol, but it is also able to hydrolyze
triglyceride to diacylglycerol (Kraemer and Shen, 2002). Upon phosophorylation, HSL
translocates from the cytoplasm to the lipid droplet (McDonough et al., 2011). Recent
work has suggested that adipocyte AMP-activated protein kinase (AMPK) is also critical
to the phosphorylation and activity of ATGL and HSL, providing another layer of
regulation to the maintenance of lipolysis in the nutrient-poor state (S.-J. Kim et al.,
2016).
Perilipin null mice have the expected phenotype of a decrease in adiposity,
consistent with perilipin functioning to protect the lipid droplet from cellular lipases
(Tansey et al., 2001). Additionally, without adipose Perilipin, CGI-58 is likely readily
available to co-activiate ATGL, further increasing lipolysis. These mice have elevated
basal lipolysis, but Perilipin null adipocytes have a blunted response to isoproterenol, a
similar phenotype to that observed in AMPK adipocyte knockout mice (S.-J. Kim et al.,
2016). Despite their decreased adiposity and inability to store lipids in the liver, these
mice are glucose intolerant. Surprisingly, mice over-expressing adipocyte Perlipin also
have a decrease in adiposity, but are protected from diet-induced obesity, exhibit low
resistance (Miyoshi et al., 2010). While the perlipin null and overexpressing mice have
dramatic phenotypes, the downstream lipases regulated by Perilipin are also critical for
regulating adiposity and insulin sensitivity.
Adipose triglyceride lipase and hormone sensitive lipase
Deactivation of perlipin and release of CGI-58 is required for maximal ATGL
activity, but ATGL it is also phosphorylated directly by PKA at Ser406. This
phosphorylation event is required for maximal ATGL activity, and constitutively
phosphorylated ATGL-Ser406 has increased basal lipolytic activity (Pagnon et al., 2012).
In vitro work has postulated that ATGL transcriptional expression is regulated by the
canonical insulin signaling cascade, with FOXO stimulated expression during the basal
state and mTORC1 suppressing expression via the transcription factor early growth
factor 1 (Egr-1) in the insulin-stimulated state (Chakrabarti and Kandror, 2009;
Chakrabarti et al., 2013). Currently, we do not know if these processes occur in vivo, but
whole-body deletion of Atgl does result in systemic changes. Atgl null mice on low fat
diet (LFD) have increased adipose accumulation, but improved insulin sensitivity; this is
more evident when control and ATGL null mice are fed high fat diet (HFD) for four weeks
(Hoy et al., 2011). The control mice become insulin and glucose intolerant, while the
ATGL -/- mice maintain insulin sensitivity and glucose tolerance similar to what is
obeserved in LFD fed ATGL null mice. Both LFD and HFD fed ATGL -/- mice have
reduced circulating free fatty acid levels (FFAs) and on HFD they exhibit reduced plasma
phenotype, as adipocyte-specific ATGL deletion reveals a similar phenotype with
protection from diet-induced insulin resistance (Schoiswohl et al., 2015).
HSL is phosphorylated directly by PKA at multiple sites, with Ser660 and Ser659
controlling HSL activity. It has been proposed that phosphorylation at these sites
promotes a conformational change in the HSL protein, allowing it to interact with tri- or
di- acylglycerol (Krintel et al., 2009). Mice null for hormone-sensitive lipase do not have a
change in overall fat mass on normal chow or HFD, though diacylglycerol has been
shown to accumulate in the WAT of this model without an increase in adiposity
(Haemmerle et al., 2002; Park et al., 2005b). These mice have decreased plasma FFAs
and when fed normal chow, improved hepatic insulin sensitivity. On HFD, HSL -/- mice
have improved WAT and muscle glucose uptake compared to HFD-fed controls mice
(Park et al., 2005b). Haploinsufficiency of HSL results in reduced lipolytic capability, and
improved insulin sensitivity without gross abnormalities in adipose depot mass (Girousse
et al., 2013). Taken together, these studies suggest a link between a loss of lipolytic
activity and improved systemic insulin sensitivity, especially when challenged with
diet-induced obesity.
Insulin-mediated suppression of lipolysis
In response to insulin, following a meal, Perilipin, HSL, and ATGL are
dephosphorylated and lipase activity and access to the lipid droplet is sharply decreased
(Carmen and Víctor, 2006). The regulation of this process by insulin action likely
includes both AKT-dependent and AKT-independent, PI3K-dependent mechanisms
suppression of lipolysis, stimulated by isoproterenol, was incomplete but present when
AKT inhibitor was added to the cells, suggesting that an AKT-independent mechanism is
able to partially suppress lipolysis. This study went on to use wortmannin to
pharmalogically inhibit PI3K, and insulin action in 3T3L1 cells to suppress lipolysis was
ablated (Choi et al., 2010). Several studies have suggested that AKT-dependent
suppression of lipolysis functions through phosphodiesterase 3B (PDE3B), whereby AKT
phosphorylation of PDE3B is required to activate the phosphodiesterase, hydrolyzing
cAMP and returning it to basal levels, leading to the suppression of perlipin and lipase
activity (Carmen and Víctor, 2006; Snyder et al., 2005). However, other work has
suggested that the AKT phosphorylation site on PDE3B is dispensable for insulin’s
suppression of lipolysis (DiPilato et al., 2015).
In vivo work has further suggested an AKT-independent mechanism for insulin
action to suppress lipolysis. In mature insulin-responsive tissues, Akt2 is the most
prevalent isoform of Akt expressed (Altomare et al., 1998). The Akt2 null mouse has mild
defects in the ability to suppress lipolysis, with slight but significant increases in plasma
glycerol and FFAs levels in response to an insulin tolerance test, but lipolysis is
suppressed when compared to the fasting state. However, decreases in insulin
sensitivity in the adipocyte may be the result of systemic insulin resistance in this model
and not the result of adipocyte-autonomous insulin resistance (Koren et al., 2015).
1.4 Insulin-stimulated glucose uptake in myocytes and adipocytes
In contrast to lipolysis, insulin-stimulated glucose uptake in adipocytes is, based
fasting to maintain in vivo homeostasis, the adipocyte takes up energy in the fed state. It
does this in the form of glucose and fatty acids. These building blocks are used to
generate triglycerides through re-esterification and glucose is also used as a carbon
source for de novo lipogenesis (Solinas et al., 2015).
Trafficking of Glut4 to the plasma membrane
Insulin-stimulated glucose uptake in adipocytes and myocytes is mediated at the
most distal level by glucose transporter 4 (Glut4). When insulin is released from β-cells
and engages the insulin receptor on adipocytes and myocytes, a tightly regulated
cascade is initiated that includes the activation of AKT, which then phosphorylates and
inactivates the Rab-GTPases AS160 and RGC at the glucose storage vesicle (GSV) of
the cell, where Glut4 is sequestered. One of the Rab proteins involved in this pathway
has been identified as Rab10, which is associated with GSVs and appears to target its
associated GSVs to the plasma membrane in response to insulin. The trafficking of
GSVs to the plasma membrane in this As160-Rab10-dependent pathway functions
through the myosin motor protein myosin-Va (Y. Chen et al., 2012). Rab10 may also be
involved in the recycling of Glut4 through endosomes, and may even target some
endosomes for the plasma membrane to further increase glucose uptake under
prolonged insulin exposure (Y. Chen et al., 2012). Tumour suppressor candidate 5
(Tusc5) has also been shown to regulate Glut4 recycling back to the plasma membrane
from endosome under conditions of continuous insulin stimulation and may represent a
The suppression of the Rab-GTPases and Rab10-targeted GSV translocation is
coordinately regulated with an AS160-independent mechanism for translocation of Glut4
to the plasma membrane in response to insulin. An essential member of this trafficking
pathway has been identified as a protein termed TUG (tether, containing a UBX domain,
for Glut4) (Bogan et al., 2003). TUG tethers GSVs intracellulary, most likely to the
trans-golgi network (TGN), in the basal state (Bogan et al., 2012). In response to insulin, TUG
is cleaved, liberating the tethered GSV to allow trafficking to the plasma membrane.
Knockdown of TUG in 3T3L1 adipocytes prevents maximal insulin-stimulated glucose
uptake (Bogan et al., 2012). Interestingly, knockdown of TUG in unstimulated 3T3L1
adipocytes elicits an exocytosis of GSVs similar to that observed in wild-type
insulin-stimulated cells (Xu et al., 2011). It is not yet established if the TUG-dependent
trafficking of Glut4 also requires AKT function.
At the cell membrane, the Rho-family small GTPase TC10, assembles the GSV
to the membrane in an PI3K-independent, insulin, APS-dependent, process (Chiang et
al., 2001; J. Hu et al., 2003). The active insulin receptor recruits the adaptor protein
APS, which is expressed in skeletal muscle, heart, and adipose tissue, organs with high
rates of glucose uptake in response to insulin (Ahmed et al., 1999; Moodie et al., 1999).
APS activation by IR recruits a complex containing c-Cbl, a member of the Cbl family of
E3-ubiquitin ligases, and facilitates phosphorylation of c-CBL to allow recruitment of the
adaptor protein, proto-oncogene CRK and the guanine-exchange factor (GEF) C3G (J.
Liu et al., 2002; Ribon et al., 1996). C3G then phosphorylates TC10 that is located on
lipid rafts in the plasma membrane and initiates interaction between the membrane and
AKT2 is required for glucose uptake
The pathways regulating glucose uptake converge at the cell membrane, but
both are required for glucose uptake to occur. Manipulating glucose uptake downstream
at the level Glut4 or TC10 ablates glucose uptake as efficiently as manipulating
upstream effectors, such as AKT, AS160, or Rab10 (Bae et al., 2003; Cho, 2001;
Lansey et al., 2012; Vazirani et al., 2016; H. Y. Wang et al., 2013). In vitro data strongly
implicate AKT2 as the isoform most efficient at regulating insulin-responsive glucose
uptake and both in vitro and in vivo work as suggested that AKT2 is required for maximal
glucose uptake (Bae et al., 2003; Cho, 2001; Gonzalez and McGraw, 2009a; 2009b).
The Akt2 null mouse exhibits defects in insulin-stimulated glucose uptake in both
adipocytes and myocytes, the two tissues most dependent on Glut4 translocation for
active glucose uptake (Bae et al., 2003; Cho, 2001). These mice are insulin resistant, as
are mice with muscle-specific deletion of Glut4 and mice with aP2-Cre mediated deletion
of Glut4, suggesting that at least from a muscle and whole-body perspective, loss of
insulin-stimulated glucose uptake alone may be sufficient to cause systemic insulin
resistance (Abel et al., 2001; Cho, 2001; Zisman et al., 2000). In contrast. AKT1 is
dispensable for glucose uptake in vitro and in vivo, as the Akt1 null mouse does not
have defects in glucose uptake (Bae et al., 2003; Cho et al., 2001). Loss of both Akt1
and Akt2 in the germline results in a loss of adipogenesis (Peng et al., 2003).
1.5 Insulin and glucose stimulate de novo lipogenesis in adipocytes
In response to insulin in the fed state, adipocytes take up glucose and free fatty
depleted in the fasted state. However, some of the carbons from glucose are diverted to
de novo lipogenesis (DNL) (Herman et al., 2013; Marcelino et al., 2013; Solinas et al.,
2015). During adipocyte differentiation, DNL, measured by supplying radio-labeled
glucose and glutamine tracers but no exogenous sources of fatty acids, is sufficient for
production of all lipids necessary to differentiate and accumulate normal lipid droplets
(Collins et al., 2011). In humans, the contribution of DNL to total triglyceride
accumulation in adipocytes has been calculated to be ~20%, representing an important
source of triglycerides (Strawford et al., 2004). Rates of DNL are influenced by diet as
well, with diets high in glucose promoting DNL and diets high in triglycerides suppressing
DNL (Hudgins et al., 2008; Lambert et al., 2021). Adipocytes with high rates of DNL tend
to be smaller in size and are associated in vivo with insulin sensitivity, as opposed to
adipocytes with lower rates of DNL that are larger in size and associated with insulin
resistance, in contrast to our understanding of DNL in the liver being highly correlated
with insulin resistance (Eissing et al., 2013; Lambert et al., 2021; Postic and Girard,
2008; Roberts et al., 2009). This dichotomy remains true when manipulating the DNL
cascade in the liver versus adipocytes. When carbodhydrate response element binding
protein (ChREBP), a critical regulator of DNL in both tissues, is knocked down in the
liver it improves insulin sensitivity, but decreased expression of ChREBP in the
adipocyte is correlated with reduced insulin sensitivity (Dentin et al., 2006; Herman et al.,
2013). SREBP, a key target of mTORC1 signaling, also regulates the expression of DNL
ChREBP and SREBP1c
ChREBP has been shown to be responsive to glucose concentration
independent of insulin stimulation in hepatocytes and stimulates target DNL genes
acetyl-CoA carboxylase (ACC), ATP-citrate lyase (ACL), and fatty acid synthase (FAS),
the rate-limiting step of de novo lipogenesis (Iizuka et al., 2004; Yamashita et al., 2001).
Germline deletion of ChREBP results in mice unable to undergo lipogenesis in their liver,
glucose intolerance, and insulin resistance (Iizuka et al., 2004). Interestingly, when Glut4
is over-expressed exclusively in the adipocyte in the ChREBP null mouse, an
improvement in glucose tolerance is observed (Herman et al., 2013). Additionally, when
stressed on a high fat diet (HFD), mice over-expressing adipose Glut4 are protected
from insulin resistance and glucose intolerance, with a partial rescue in the DNL genetic
program (Herman et al., 2013). These data isolate glucose signaling and ChREBP
expression, specifically the isoform identified in this work, ChREBPB, in the adipose
tissue as the fundamental regulators of DNL in the adipocyte. Furthermore, it implies that
loss of ChREBP in the adipocyte causes insulin resistance that can be partially rescued
by increased glucose uptake.
In mice null for SREBP, many of the downstream targets that are co-regulated by
ChREBP and SREBP were decreased, including ACC, FAS and ACL in both adipose
and liver (Shimano et al., 1999). However, SREBP expression of these genes in adipose
specifically may be less important than the regulation of ChREBP, as several studies
have suggested that loss of ChREBP expression affects the downstream targets, but
does not affect expression of SREBP (Herman et al., 2013; Tang et al., 2016). This does
not rule out that processing of SREBP to its nuclear form by an SREBP
and thus it cannot be ruled out that SREBP is indeed an important regulator that has
been overlooked. More is known about SREBP regulation in the liver, discussed in more
detail below.
1.6 Adipose tissue as an endocrine organ
Since the discovery of leptin in 1997 as a hormone produced in adipose tissue
and distributed systemically, most importantly to the brain to regulate satiety, the
function of adipose tissue as an endocrine organ has been intensely studied (Kershaw
and Flier, 2004; Waki and Tontonoz, 2007). Other adipocytokines, or adipokines, also
play key roles in regulating satiety and insulin sensitivity.
Adiponectin
Adiponectin is produced exclusively by adipose tissue and plays an important
role in systemic sensitivity to insulin (E. Hu et al., 1996). Mice null for adiponectin have a
mild insulin resistant phenotype in some studies, while others do not find a systemic
effect with loss of adiponectin function in the mouse (K. Ma et al., 2002; Maeda et al.,
2002; Nawrocki, 2005). Several studies have correlated low adiponectin levels to insulin
resistance in both mouse models of genetic or diet-induced obesity, a primate model of
T2DM, and in insulin resistant humans (Hotta et al., 2001; E. Hu et al., 1996; Kadowaki
et al., 2006; Nawrocki, 2005; Weyer et al., 2001). Elevated adiponectin levels in mice
expressing an active adiponectin transgene are more insulin sensitive than control mice
(Combs et al., 2004). The mechanism underlying adiponectin’s insulin-sensitizing effect
potentially by reducing the expression of gluconeogenic enzymes and thereby activating
AMPK (Berg et al., 2001; Combs et al., 2004; Yamauchi et al., 2002).
Resistin
Another adipokine, resistin is associated with both insulin resistance and
inflammation, and some studies have suggested it inhibits adipocyte differentiation
(Holcomb et al., 2000; K. H. Kim et al., 2001; Steppan et al., 2001). Mice injected with
resistin develop glucose intolerance and insulin resistance, and it was postulated to be a
target of action for thiazolidnediones (TZDs) that induce PPARy action and improve
insulin sensitivity (Steppan et al., 2001). However, other studies have suggested that
resistin expression is suppressed in obese and insulin resistant states, with activation of
PPARy using TZDs inducing resistin expression and contributing to the
insulin-sensitizing effects of TZD administration (Way et al., 2001). Still other studies have
argued there is a disconnect between the mRNA expression of resistin in diabetes
versus circulating levels, which may explain the difference between the studies
performed (Rajala et al., 2004). Higher circulating levels of resistin has been correlated
with obesity in human studies (Degawa-Yamauchi et al., 2003; Kusminski et al., 2005).
Recent work has replicated the original data showing that giving exogenous resistin to
mice decreases insulin sensitivity, and this work also suggests that resistin plays a role
in regulation of blood pressure, potentially through a Toll-like receptor 4-dependent
mechanism (Jiang et al., 2016). Interestingly, resistin is expressed predominantly by
adipocytes in mice, but by macrophages in humans, and also by other tissues (Patel et
macrophage-specific manner were insulin resistant and had increased resistin expression in WAT
after only 4 days of being fed a HFD, and further increased after 3 weeks, providing
evidence for macrophage infilitration into WAT during HFD feeding (Qatanani et al.,
2009).
Leptin
Leptin, arguably the most famous adipokine, is an anorexegenic hormone,
regulating energy balance by suppressing food intake, leptin levels are increased in
obese individuals (Klok et al., 2007). This observation led to the discovery of leptin
resistance during obesity (Bjørbaek et al., 1998; Dietrich et al., 2008). Mice without leptin
(ob/ob) or the leptin receptor (db/db), were originally identified in 1950 and 1966,
respectively (Hummel et al., 1966; INGALLS et al., 1950). These mice have been
studied for more than half a century, but it wasn’t until the 1990s that leptin was
identified as the “obese” gene encoding the circulating factor lacking in ob/ob mice and
the receptor lacking in db/db mice (Tartaglia et al., 1995; F. Zhang et al., 1997). The
discovery and study of leptin has resulted in a field of neuronal leptin signaling and more
broadly, the central nervous system regulation of obesity and energy homeostasis. Loss
of plasma leptin is associated with a constellation of physiologic consequences,
including hyperphagia, insulin resistance as a result of hyperphagia, and decreased
energy expenditure. Several models of lipodystrophy have been treated with leptin and
rescued their insulin resistance (W. S. Chen et al., 2009; CortEs et al., 2014; Gray et al.,
2006; Shimomura et al., 1999). Still other studies have suggested that Type I diabetes
have hypoleptinemia resulting in increased activity of the hypothalamic-pituitary axis and
leading to increased lipolysis and hepatic insulin resistance (Perry et al., 2014). In obese
patients with elevated leptin levels and leptin resistance, a leptin sensitizer has recently
shown promise in inducing weight loss (J. Lee et al., 2016).
Leptin and other adipose-cytokines, or adipokines, have identified an endocrine
adipose-brain axis not previously understood. Adipokines are part and parcel of the vital
function of adipose tissue in the maintenance of overall organismal health and energy
balance.
1.7 Lipodystrophy leads to systemic insulin resistance
In lipodystrophy patients, a lack, or severe decrease, of adipose tissue
dramatically disrupts overall energy homeostasis, leading to many hallmarks of insulin
resistance and Type 2 Diabetes Mellitus (T2DM), but without the presence of obesity
(Garg, 2004). Congenital generalized lipodystrophy (CGL) Type 1 is the most common
form of lipodystrophy occurring in humans and results from a mutation in the
1-acylglycerol-3-phosphate O-acyltransferase 2 (AGPAT2) gene (Agarwal et al., 2002;
Garg, 2004). Germline knockout of Agpat2 causes a lipoatrophy, as or more severe than
when the gene responsible for CGL Type 2, Seipin, is deleted in a whole-body or
adipose-specific manner (CortEs et al., 2009; Cui et al., 2011; L. Liu et al., 2014). Other
genes have been implicated in human lipodytrophic conditions as well, including, in the
insulin-signaling pathway, AKT2 and a subunit of PI3K (Chudasama et al., 2013; Garg,
Several other mouse models exhibit profound lipodystrophic phenotypes, most
notably the AZIP/F-1 dominant negative mouse which is unable to induce adipocyte
development but has been used to study adipocyte development by transplanting the
stromal vascular fraction and observing which cells develop into adipocytes (Moitra et
al., 1998; Rodeheffer et al., 2008). These models, and others, all exhibit a similar
phenotype, with non-alcoholic fatty liver disease (NAFLD), hyperinsulinemia, and often
hyperglycemia. Some models have elevated circulating FFAs as well, but others do not,
likely due to their severe lack of adipose tissue and an inability to increase FFAs in
response to a fast (Colombo et al., 2003; CortEs et al., 2009; Cui et al., 2011; L. Liu et
al., 2014; Moitra et al., 1998). In lipodystrophic patients and mouse models, several
hallmarks of insulin resistance are present and have informed our understanding of the
fundamental role that adipose tissue plays in maintaining energy balance. The severity
of these IR signs may be increased in lipodystrophy compared to obese patients and
models, but their inability to appropriately regulate adipocyte function may also point to
critical players in how obese individuals also fail to maintain their systemic homeostasis.
1.8 Obesity, insulin resistance, and Type 2 diabetes mellitus
Overnutrition and obesity are a rising epidemic, now a leading risk factor for the
worldwide disease burden (Haslam and James, 2005). Obesity is correlated with a
constellation of physiologic disturbances including hypertension, high cholesterol, fasting
hyperinsulinemia, hyperglycemia and glucose intolerance, with an estimated annual cost
of over $209 billion (Cawley and Meyerhoefer, 2012; Sims et al., 1973). How obesity and
overnutrition affect tightly regulated energy homeostasis is poorly understood. In
central organ in the regulation of energy. Our ability to intervene in the epidemic of
obesity and its sequelae requires a greater understanding of how adipose tissue
regulates energy homeostasis.
Twenty-nine million people in the United States have Type 2 diabetes, and nearly
three times as many are “prediabetic,” both defined by fasting plasma glucose levels,
increased hemoglobin A1C (HbA1C) levels, an indicator of glucose levels over the
previous 3 months, and an oral glucose tolerance test (8944, 2015; Prevention, 2015). In
prediabetes some inability to regulate hyperglycemia is observed, with elevated HbA1C,
and fasting blood glucose concentration over 100 mg/dL (8944, 2015). Prediabetes is
much more common than full-fledged diabetes, and even before developing prediabetes,
individuals are insulin resistant. In an insulin resistant state, glucose levels are
maintained by overcoming the systemic insulin resistance in metabolic organs by
secreting more insulin. For reasons that are unclear, weight loss and increased physical
activity improve overall insulin sensitivity (8944, 2015). Furthermore, it is not well
understood how diet and/or physiological impacts of hyperinsulinemia and
hyperglycemia affect the metabolic changes observed in insulin-responsive tissues. For
example, we only recently understand how de novo lipogenesis in the liver contributes to
non-alcoholic fatty liver disease (Lambert et al., 2021). Information garnered from the
use of insulin-sensitizing therapeutics, such as the TZD family of drugs, suggests that an
increase in adiposity does not necessarily equate to decreased insulin sensitivity, but
rather that efficiently sequestering fatty acids into adipocytes can improve systemic
insulin responsiveness (Lehrke and Lazar, 2005).
Correlation between insulin resistance and a defect in suppression of lipolysis in
hepatic insulin responsiveness has been reported (Girousse et al., 2013; Moore et al.,
2004; Rebrin et al., 1996; Sindelar et al., 1996). The peripheral regulation of HGP has
recently garnered additional support from work done in rodents (Perry et al., 2015;
Titchenell et al., 2016). This work has proposed that FFAs-driven HGP as a result of
adipose insulin resistance is responsible for the what has been termed “selective insulin
resistance,” referring to the paradox of why, in the insulin resistance state, the liver
remains sensitive to insulin to promote DNL and triglyceride accumulation, resulting in
NAFLD, but is insensitive to insulin in regards to suppression of HGP, causing
hyperglycemia in the face of high insulin levels (Brown and Goldstein, 2008). Potentially,
HGP is regulated independently of liver insulin signaling and in response to adipose
insulin signaling. These data suggest that adipose tissue may be elemental to our
understanding of the pathology of obesity and T2DM in humans, but only recently have
the tools become available to pursue these studies in an adipocyte-centered manner in
vivo.
1.9 Challenges in targeting adipose tissue in vivo
In vivo regulation of the adipocyte response to insulin has, until very recent
years, been an intractable question due to a lack of tools for targeting adipose tissue
specifically. Historically, models attempting to delete elements of the insulin-signaling
cascade in adipocytes were generated using Cre recombinase driven by the aP2
promoter (Abel et al., 2001; Blüher et al., 2002; Boucher et al., 2012; Kumar et al.,
2010). Interpretation of the genetic models published with the aP2-Cre is confounded by
its promiscuous expression, demonstrated by subsequent work showing that aP2-Cre is