5
Learning by Exporting: Lessons from high-technology SMEs
James H Love and Panagiotis Ganotakis
Aston Business School Aston University Birmingham B4 7ET
United Kingdom
Abstract
Theory points to the existence of a ‘learning by exporting effect’, in which exposure to export markets enhances performance through exposure to the knowledge stocks of trading partners. We investigate the learning by exporting hypothesis by examining the effect of exporting on the subsequent innovation performance of UK high-tech SMEs. We find evidence of learning by exporting, but the pattern of this effect is relatively complex. Exporting helps high-tech SMEs innovate subsequently, but does not make them more innovation intensive. There is also evidence that it is consistent exposure to export markets that helps firms overcome the innovation hurdle, but that there is a positive scale effect of exposure to export markets which allows innovative firms to sell more of their new-to-market products on entering export markets. Service sector firms are able to reap the benefits of exposure to export markets at an earlier (entry) stage of the internationalization process than are manufacturing firms. Firms producing a rapidly changing portfolio of innovative products exhibit higher ‘churn’ in terms of entry to and exit from export markets than low-intensity innovators, and this is reflected in the effects of entry and exit into and out of such markets.
1. Introduction
International trade benefits the trading parties both in static terms through comparative advantage, and in dynamic terms through exposing countries to the knowledge stocks of their trading partners (Grossman and Helpman 1991a,b). This ‘learning by exporting’ effect may be important at both the country level and at the level of the individual
exporting firm. For example, learning by exporting is regarded as an important dimension of export-led growth for developing economies (World Bank, 1993), and many Western economies provide support to exporters in the understanding – or hope – that the
productivity of these and other domestic firms will improve as a result of exposure to international markets1.
However, detecting learning by exporting effects at the firm level is by not
straightforward. Firm performance, especially productivity and profitability, is extremely heterogeneous even with sectors (Bartelsman and Doms, 2000; Goddard et al., 2006) and is subject to many influences unrelated to exporting. In addition, firms learn from many external as well as internal sources which may have nothing to do with exposure to export markets, and thus it is not always easy to separate out the learning by exporting effect. As a result, empirical studies of the effects of exporting on (productivity) performance have very mixed results (Wagner 2007); as Salomon and Jin (2008) point out, we still know relatively little about the how exporting affects performance at the firm level.
This is especially true for small and medium-sized enterprises (SMEs). A recent strand of IB literature has highlighted the importance of understanding the effects of the
internationalization process undertaken by those technologically-driven SMEs which tend to internationalize relatively early in their lifecycle (Autio et al 2000; Zahra et al 2000; Filatotchev et al 2009). While there is some evidence that the internationalization of such firms is associated with improved performance in terms of profitability and growth (Bloodgood et al 1996; Burgel et al 2001), there is little direct evidence on the extent to which such firms are able to benefit from learning by exporting, often the initial stage in the internationalization process for SMEs (Jones 2001).
Here we look for evidence of learning by exporting among high-tech SMEs in the UK. As suggested by Salomon and Shaver (2005) we look for the learning by exporting effect on that part of the firm’s activity where learning is most likely to have a direct effect – innovation activity. High-tech SMEs are a particularly interesting group to consider in terms of the innovation-exporting relationship. These are firms that operate mainly in highly innovative sectors, and tend to be high-growth firms which internationalize relatively early, and for which overseas markets play an important role (Acs and
Audretsch, 1987; Lynskey, 2004). Such firms are therefore fertile ground for identifying the learning by exporting effect.We carefully allow for the (lagged) effect of exporting, but also for other potential sources of external knowledge and learning which may
1 For example, in Britain the government department UK Trade & Industry actively promotes the
influence innovation. We also allow for changes in exporting status during the time of study, to examine what effect entering and exiting export markets may have on learning and thus on innovation performance.
We find is that there is evidence of learning by exporting, but that the pattern of this effect is relatively complex. Exporting helps high-tech SMEs innovate subsequently, but does not make them more innovation intensive. There is also evidence that it is
consistent exposure to export markets that helps firms overcome the innovation hurdle, but that there is a positive scale effect of exposure to export markets which allows
innovative firms to sell more of their new-to-market products on entering export markets. Our results also suggest that service sector firms are able to reap the benefits of exposure to export markets at an earlier (entry) stage of the internationalization process than are manufacturing firms. Firms producing a rapidly changing portfolio of innovative products exhibit higher ‘churn’ in terms of entry to and exit from export markets than low-intensity innovators, and this is reflected in the benefits they gain from entry and exit into and out of such markets.
2. Learning by Exporting: theory and evidence
The theoretical basis for positive link between exporting and performance has its basis in economic models of the benefits from trade and openness. For example, endogenous growth models in the tradition of Grossman and Helpman (1991a,b) recognise that trade exposes each country to the knowledge stocks of its trading partners. As this knowledge is transferred internationally, both embodied in the flow of traded goods and services and disembodied through technology transfer, the domestic productivity frontier shifts outwards and higher economic growth ensues. This is ‘learning by exporting’. At the level of the individual firm, recent theoretical analysis by Aw et al (2008) is the first to explicitly predict performance improvements arising from exporting – but crucially this learning effect is dependent on a positive interaction with R&D, suggesting a role for innovation in the learning by exporting effect.
In practical terms, learning by exporting is potentially important; the World Bank regards the transmission of tacit and (occasionally) proprietary knowledge from customers and suppliers to exporters as an important dimension of export-led growth for developing economies (World Bank, 1993). Exporting firms may also benefit in terms of
productivity and innovativeness in two other ways related to learning by exporting. First, the stronger competition in foreign markets forces firms to improve both products and processes and thus remain competitive. Second, scale effect may be important. Exporting extends the market over which margins may be earned, and since many costs, such as R&D, are largely fixed, such investments may be recouped over a larger sales volume. This aids productivity, and provides greater incentives to invest in R&D and innovation.
The empirical literature on the firm-level benefits of exporting gives rather mixed evidence. Some studies do indeed find a positive link between exporting and
1995, 1999, 2004; Castellani 2002; Greenaway et al 2005; Arnold and Hussinger 2005). Part of the reason for this lies in the likelihood of a self-selection mechanism. There are fixed cost involved in entering export markets, and therefore only the more productive firms are able to do so. Roberts and Tybout (1997), Clerides et al (1998) and Helpman et al (2004) all develop formal theoretical models of exporting with sunk costs of entry, and in all cases the models suggest that the sunk costs of market entry favour larger, more productive firms. The rationale behind these models is that firms contemplating entry to foreign markets have to engage in market research, set up new distribution networks, negotiate with potential new partners, and may have to modify their product range, all of which incur costs. Only those with sufficiently low marginal costs have the profits large enough to cover these fixed costs of entry. Thus exporters are more productive than non-exporters not specifically because of benefits derived from exporting, but because they are more productive firms to begin with, and can therefore overcome the fixed costs of entering foreign markets. Wagner (2007) reviews over fifty empirical studies on exporting published between 1995 and 2006, and finds overwhelming support for the existence of this self-selection mechanism.
However, another, less well researched reason for the lack of clear evidence in support of learning by exporting may arise from the use of (total factor) productivity as the
dependent variable in most studies. Recently, Salomon and Shaver (2005) and Salomon and Jin (2008) have argued that much of the empirical research reviewed above provides a very indirect test of the learning by exporting hypothesis. Since learning by exporting is about learning, a better measure of the possible effect would be one which embodies a learning outcome, such as innovation. Such an approach is consistent with the theoretical analysis discussed above (Grossman and Helpman 1991a,b); accessing the knowledge stocks of trading partners should manifest itself in improved product and process
innovation, and it this innovation which in turn determines international competitiveness and productivity at both firm and country level (Aw et al 2008).
Recent empirical evidence finds some support for learning by exporting using this approach. For example, in a study of the Taiwanese electronics industry, Aw et al (2007) find that exporting significantly boosts productivity, especially if accompanied by
examine how Northern Ireland service firms’ innovation activity relates to productivity and export behaviour. Echoing some of the results of Aw et al (2007), they conclude that innovation itself is not sufficient to generate productivity improvements. Only when innovation is combined with increased export activity are productivity gains evident.
Overall, the empirical literature suggests there may indeed be a positive effect of exporting on innovation. But can this all be ascribed to learning by exporting? Firms acquire knowledge from a variety of sources, and it is essential to allow for other sources of external (as well as internal) knowledge sources which could mask or enhance the true influence of learning by exporting. In addition, although there are numerous studies of early-internationalization or ‘born-global firms (e.g. Autio et al 2000; Knight and Cavusgil 2004), there is little systematic evidence specifically on learning by exporting among high-tech SMEs. In the sections below we outline an attempt to determine the extent and nature of this effect for a sample of UK high-tech SMEs, while allowing for other knowledge sources which may influence innovative behaviour.
3. Data
The empirical analysis is based on data from a representative survey of UK new technology based firms (NTBFs). These are defined as firms that are independently owned (i.e. the founder(s) owns at least 50% of the company), are less than 25 years old and belong to a high technology sector (Tether and Storey, 1998).The survey gathered information on the exporting behavior and performance of the firms, their innovative and knowledge gathering activities and finally on the backgrounds of the founders.
In order to identify the UK high technology sectors an approach similar to that used by Butchard (1987)2 was followed, based on the twin criteria of firms with high R&D
intensity (measured as R&D expenditure over the amount of sales or value added) and firms with a high proportion of scientists and engineers who spend the majority of their time in R&D activities. By using the OECD STAN indicators and the ‘Research & Development in the UK’ (2002) published by the Office of National Statistics, the expenditure over sales as well as the R&D expenditure over value added criterion was used, for each sector according to the UK SIC classification3. The ratio of scientists and engineers who spend the majority of their time in R&D activities over total employment was also calculated by using the ONS MA_14 reports and the STAN indicators. The categorization of companies according to the independence criterion was done by using FAME (Financial Analysis Made Easy), a database that contains contact details of all the
2 Butchard (1987) identified 15 manufacturing and 4 service sectors as high technology, based on two
criteria. Firms with high R&D intensity (measured as R&D expenditure over the amount of sales, or value added) and firms with a high proportion of scientists and engineers who spend the majority of their time in R&D activities, in relation to the rest of the industries. However, this classification could not be adopted here as the categorization was carried out according to the NACE-70 four digit system which has now been replaced by the ISIC Rev.3, or for the case of the UK the UK SIC classification. Most importantly, the adoption of a high-tech sector categorization based on data more than 20 years old (the time of the time of Butchard’s survey) would not have picked up the creation and expansion of new industrial sectors.
limited UK companies and their directors, which can also be used to isolate the companies where individual owners own more than 50% equity.
The second step in the sampling frame involved the stratification of companies according to age and size for each high-tech sector4. This led to an initial calibrated
semi-proportional random sample of 4000 companies selected from the high-tech sector population5 (see Table 1 column 1). Data were collected by postal questionnaires between April and July 2005, following first discussions with a number of academics with extensive experience of carrying out surveys of SMEs, in order to identify questions that could perhaps bias the study and second, face-to-face interviews with five
entrepreneurs (five companies) in order to receive feedback on the clarity of the questions included in the questionnaire and to therefore ensure that unfamiliar and ambiguous terms were not included in any of the questions and that the questionnaire was as concise as possible. From the feedback received appropriate alterations were made. Finally a pilot study of 100 NTBFs was carried out before the main survey in order to investigate whether an acceptable response rate could have been achieved. Respondents were promised both confidentiality and anonymity and that results will be presented purely in an aggregated form.
A customized survey was the most appropriate manner in which to collect data because comprehensive and detailed archival information on NTBFs was not (and still is not) available from secondary sources, especially on their innovative and exporting activity. However, it must be recognised that, in general, studies using questionnaires to collect data at the same point in time and from single respondents in each firm can suffer from common method variance or bias (Podsakoff and Organ, 1986). Podsakoff et al (2003) point out six situations that can lead to common method bias namely; self-reporting, the survey being carried out at a single point in time, measures that are based on respondents’ perception, single respondents, the entire data being collected from one source and item social desirability. In order to tackle this problem, a number of steps were taken.
First, the survey did not include questions measuring perceptions of individuals in the traditional form of Likert scales, therefore removing the bias that can be introduced by respondents’ perceptions and to a certain degree reducing the effect of item social desirability. The questionnaire included questions related to accounting-based and different forms of economic/statistical data such as turnover, profit, number of employees, sources of finance used, whether a firm has exported, innovated and the percentage of sales derived from selling to foreign markets and by selling innovative products/services. Questions on innovative outputs were similar to those used in official
4 We are grateful to the ONS for providing the table for each sector according to companies’ size and age.
surveys such as the Community Innovation Survey (CIS), completion of which is mandatory for a sample of UK SMEs.
Second, in order to check for the validity of the answers given and therefore to check for any evidence of self-reporting or/and social desirability bias the information provided in the questionnaires in regards to a firm’s age, turnover, profit, number of employees, group membership and financial sources used was double checked with the information that those firms provided in their published accounts, and which was able to be accessed by using the FAME dataset. Although some SMEs are not always required to disclose such information (hence the need to collect it by survey) this check could be performed for over 50% of the firms in the sample and no serious inaccuracies were found.
Furthermore, the background of some entrepreneurs (e.g. age, education) was checked by using FAME (age) and company websites (were available) and again responses appeared to be accurate. The fact that respondents overall provided accurate information for sensitive issues such as a firm’s size and financial state and personal information about themselves makes the authors confident that the answers given to questions that could not be double checked (e.g. collaborative agreements, innovative activity) are unlikely to suffer from systematic bias.
Finally, bias introduced by common method variance can be further minimized in this study as it is unlikely that the respondents were able to cognitively link the ideas behind the purpose of this paper, i.e. whether exporting in a previous period has an effect on a firm’s innovative activity in a subsequent period. For example, the covering letter to the survey instrument explained that the purpose of the study was to ‘investigate
entrepreneurial activity and the performance and growth of NTBFs in the UK’, with no specific mention of either innovation or exporting. In addition, although essentially linear, the estimated model is relatively complex in terms of the number of independent variables and the inclusion of indicators for several sources of knowledge inputs to innovation quite independent of exporting, data on which were gathered at different points of the questionnaire. We therefore believe that in the process followed prior, during and after the survey reasonable steps were taken to minimize any bias that CMV can introduce into the study.
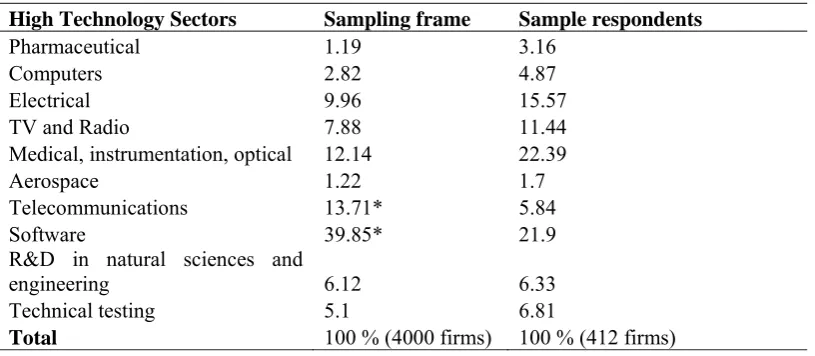
Of the original sample of 4000 companies 412 companies took part in the survey. All questionnaires were answered by members of the entrepreneurial founding team. The distribution of the response rate across the industries identified as high-tech is illustrated in Table 1. On initial examination a chi-square test appears to show that the distribution of the original population and the sample significantly differ (χ2(9)= 31.546 and
p=0.000238). However, this is due to the high incidence of consultants in the lowest employment band-size of just two sectors. The ONS data do not distinguish between consultants and (genuine) R&D-intensive businesses within the software and
the ONS and that of the respondents to the survey does not significantly differ (χ2(9)= 4.049 and p=0.77) confirming the representativeness of the study’s survey.
Table 2 provides the summary statistics and describes the variables used in this study. 53.1 % of the sampled firms exported in 2004 in comparison to 44.9 % in 2001. 10.9 % of them exported in 2004 but not in 2001 and only 4.3 % exported in 2001 but not in 2004. Innovation is defined in this study as the introduction of at least one new-to-market product or service in the previous three years. Using this definition, 56% of the firms in the sample innovated over the period 2001-04, and on average 20.3% of firms’ sales were derived from the introduction of new-to-market products, a figure that captures the ability of firms not only to introduce but also to successfully commercialize new products (innovation success).
4. Model and Method
Model and variables
The empirical estimation begins with a brief preliminary analysis to determine the existence or otherwise of an ‘exporting premium’ for our sample of firms i.e. is there a difference in labour productivity between exporters and non-exporters after allowing for suitable controls? This is an established starting point in the literature on learning by exporting (Bernard and Jensen 1995; Wagner 2007; Van Biesebroeck 2005). If there is no evidence of an export premium there is therefore little point in exploring the possible sources and scale of learning by exporting through its effect on innovation. We therefore estimate the following:
ln LPit = φ + δ1EXit +δ2Controlsit + εit (1)
LPit is labour productivity (output per worker) and EXit is a dummy exporter variable.
The controls here are simply firm size and industry dummy variables. The coefficient on δ1 gives an indication of the exporting premium after allowing for scale and industry
effects. It does not by itself indicate the existence of learning by exporting effects – a positive coefficient could in whole or in part arise from selection effects – but it is indicative that exporting and performance are at least related.
In general terms we write the innovation production function as:
Iit= α + β1EXi0 +β2KSit + β3RIit + εit (2)
The dependent variable Iit is the proportion of total sales accounted for by new-to-market
products over the period 2001-04. This is a standard measure of innovation intensity or ‘success’ in the innovation literature (Brouwer and Kleinknecht, 1996; Roper et al 2008).
The independent variables include measures of exporting and other potential knowledge sources for innovation. The exporting variable EXi0 is a dummy variable taking the value
1 if the firm exported in 2001 and zero otherwise. The coefficient on β1 therefore
indicates whether exporting at the beginning of the innovation period has an effect on subsequent innovation performance. However, data are also available on whether the firm exported in 2004, allowing a more extensive set of dummy export status variables to be defined as follows:
STARTi = 1 if (EX2001 = 0) and (EX2004 = 1)
BOTHi = 1 if (EX2001 = 1) and (EX2004 = 1)
STOPi = 1 if (EX2001 = 1) and (EX2004 = 0)
When used in place of EXit the coefficients on these variables indicate how moving into
and out of export markets affects innovation, thus providing further insights into the mechanisms by which learning by exporting operates for high-tech SMEs.
The variables KSit are measures of other forms of internal and external knowledge
sources which have been shown to have an impact on innovation outputs at the firm level. Failure to allow for these in the analysis could result in the apparent learning by
exporting effect being over or understated. R&D has long been regarded as a crucial knowledge input into innovation. Since the seminal work of Cohen and Levinthal (1989), the influence of R&D is acknowledged as being of two related types: first, it provides an important direct input into (product) innovation. Numerous studies have confirmed the importance of R&D in this respect (Love and Roper, 1999; Veugelers and Cassiman, 1999; Love and Roper, 2002; Leiponen, 2005). Secondly, R&D is an important element of absorptive capacity, increasing the ability of a firm to assimilate and absorb external knowledge. The second of these mechanisms may be particularly important in the present context: since learning by exporting is about absorbing knowledge, often
the present study we include measures of the firm’s expenditure on both internal and external R&D, in order to allow as fully as possible for the R&D effect on innovation.
However, internal and external R&D are not the only sources of knowledge inputs. Recent work on the ‘innovation value chain’ has shown that knowledge inputs from direct collaborative relationships with a variety of sources can have a positive impact on innovation (Roper et al 2008, Ganotakis and Love 2009). We therefore allow for the effect of knowledge linkages to customers or suppliers (Joshi and Sharma, 2004; Love and Mansury, 2007; Smith and Tranfield, 2005), horizontal linkages to competitors or other sectoral firms (Hemphill, 2003) and linkages to universities or other public research centres (Roper et al., 2004; Del Barrio-Castro and Garcia-Quevedo, 2005). In each case the metric used is a dummy variable indicating whether the firm had a collaborative agreement with the relevant partner.
We also allow for a number of control variables, largely reflecting the resource base of the firm (RIit). Employment size and its square are included in order to allow for the
possible scale benefits of exporting (Van Biesebroeck 2005), which we wish to allow for separately from any learning by exporting effect. Although the majority of firms in the sample are independent entities, a small minority are part of a group of companies (see Table 2). We include a dummy variable for group membership in order to allow for the possibility of knowledge flows within group networks. Age has been shown to be linked both to exporting and to innovation (Love et al 2010), and the firm’s age in years is included in the estimation to allow for any knowledge acquisition related to years in business. We also allow for the firm’s skill base, as measured by the proportion of the workforce with degrees (Freel and Robson 2004), and for whether the firm has received any government assistance for its innovation activity. Finally, we include a dummy variable to indicate whether the firm has adopted a niche marketing strategy. Van Biesebroeck (2005) shows that increased product specialization helps lead to the exploitation of scale economies even among relatively small firms, and this variable therefore sheds light on the scale effects of exporting.
Method
To show how the export premium varies over the distribution of productivity among firms in the sample, we estimate equation (1) by quantile regression. While standard regression analysis (e.g. OLS) performs estimations only at the conditional mean, quantile regression allows one to trace the entire conditional distribution of plant level productivity, conditional on the set of regressors (Koenker and Bassett, 1978; Love et al 2009).
(1996) (Wagner, 2001) 6. However, this modeling approach makes the implicit
assumption that the signs on β1, β2 and β3 are the same both for the probability of being
an innovator and for the extent of innovation (Cragg, 1971). Since we are interested in how exporting affects these two outcomes separately, we test the implicit assumption of sign equality on β1, β2 and β3 against the unrestricted form which does not make this
restriction. This is done by estimating equation (1) by probit (where the dependent variable is a dummy innovator variable) followed by a truncated regression of innovation intensity applied to innovators, and conducting a likelihood ratio test against the
restricted (Tobit) model. In the analysis discussed below the resulting test statistic7 shows that the restriction is invalid, and we therefore report the results from the probit and truncated regression models8.
In order to have confidence in the results of these models, we must be sure that there is no self-selection effect among innovators. In other words, modelling innovation intensity needs to take into account the possibility that innovators are not a random sub-set of all firms, and may have certain characteristics that are also linked to how intense is their innovation activity. We therefore initially estimate equation (2) using the Heckman (1979) approach which tests for any selection bias. In both versions of the Heckman estimation (i.e. with the simple exporter dummy and with the exporting entry/exit dummies) the inverse Mills ratio (λ) is highly insignificant, indicating an absence of selection effects9. We can therefore proceed with the probit and truncated regression estimations as outlined above.
5. Results
Is there an exporting premium?
Table 3 shows the result for the values of δ1 (the exporter variable) from estimating
equation (1) by quantile regression. There clearly is an exporting premium: at the conditional mean, exporters have on average output per worker 26% higher than non-exporters10. However, this exporting premium is unevenly distributed, with the least productive firms experiencing an export premium of up to 54%, and the most productive firms experiencing no export premium (coefficient on the exporter dummy variable is insignificant).
By itself, this is not proof of any learning by exporting effect. It could simply, either wholly or in part, be the result of a self-selection effect, with high productivity firms
6 In practice, Roper et al (2006) observe that the signs and significance levels obtained using the fractional
response model are very similar to those obtained using Tobit.
7 Defined as λ = 2(ln L
probit + ln Ltruncation – ln Ltobit). Critical values of χ2 are 35.17 and 37.65 respectively. 8 Data come from a truncated distribution if values in a certain range are not observed, such as data for
non-innovators in the innovation intensity equation. In such circumstances, simply using OLS regression on the non-limit observations is inconsistent, and a maximum likelihood estimator is therefore used.
9 Estimations available on request from the authors.
10 Since the dependent variable is the log of output per worker, the elasticity with respect to the
selecting to become exporters. However, the fact that the exporting premium is markedly larger for firms at the lower end of the productivity distribution is intriguing. Some firms may well enter export markets because of high productivity without deriving much benefit from doing so. This would appear to be compatible with the lack of an export premium for the most productive firms in the sample. However, as Van Biesebroeck (2005) points out, firms – especially small firms – enter export markets for different reasons. They may export because their owners have family or business partners abroad, and so export entry may occur relatively early and even among firms whose productivity levels would not normally be considered to be high enough to overcome the sunk costs of exporting. Such firms may have more scope for productivity improvements from
exposure to foreign markets – in other words, lower productivity firms which do manage to get over the exporting hurdle may gain more from doing so than firms which are already highly productive. At the very least, the results of Table 3 are not inconsistent with the learning by exporting hypothesis, and suggest that it is worth exploring the issue in more detail. We do this by considering the effects of exporting on firms’ innovation outputs.
Estimating the learning by exporting effect
Table 4 shows the results of the probit and truncated regression estimations of equation (2) on the full sample of firms11. The first two columns show the results where the key independent variable is a simple lagged exporter dummy. In terms of the general determinants of innovation, there is evidence that internal and external knowledge sources have a positive impact on innovation outcomes. Internal R&D and collaboration with supply chain partners and with universities all have a positive effect on the
likelihood of innovation, while both internal and external R&D are important for
innovation intensity. There is little evidence of scale effects, with neither a niche market strategy nor employment size having little direct effect on innovation (although the coefficient on employment size is only marginally insignificant in the probit estimation).
Turning now to the effect of exporting, we find that firms that export in 2001 have a 15% greater probability of innovating in the subsequent three year period than those that do not. This effect is evident after allowing for both scale effects and for other possible sources of knowledge for innovating, and is therefore compatible with the existence of learning by exporting. However, this effect is not evident in the truncated regression estimation with innovation intensity as the dependent variable (Table 4 column 2). This suggests that the positive effect of learning by exporting extends to helping firms overcome the barrier to innovation, but does not help increase innovation intensity. It is also notable that both internal and external R&D have significant and positive
coefficients in the truncated regression, and that high skill levels are significant in encouraging increased innovation intensity.
which consistently export (i.e. export in both 2001 and 2004): starting to export has a positive but insignificant coefficient. By contrast, innovation intensity is positively affected by entry into export markets (START has a positive and significant coefficient). Thus the learning by exporting effect helps to overcome the threshold into innovation only if firms consistently export, but for those firms which are already innovators, it is entry into export markets that boost innovation intensity.
This combination of results has an interpretation for the effects of exporting. The fact that exporting, and especially consistently being in export markets, is associated with an increased probability of innovating after allowing for other knowledge inputs appears to point to learning by exporting. However, the lack of any overall exporting effect on innovation intensity coupled with the positive effect of exporting entry on this variable seems unlikely to be directly related to learning by exporting. It seems more likely that this points to some benefit of having a much larger market in which to sell, a form of scale effect. Exposure to export markets extends the market over which sales may be made, and in particular extends the potential market for the most innovative products. The results of Table 4 therefore appear to point to the joint effect of two related effects: a learning by exporting effect which increase the likelihood of innovating, and a scale effect of actually entering export markets with a range of new-to-market products.
Manufacturing versus services
The next stage is to consider whether the learning by exporting effect differs between manufacturing and service sector firms. Numerous authors have argued that services and their innovations comprise unique attributes which distinguish them from product or manufacturing innovations,such as their intangible nature, inseparability, and enhanced interactivity between client and firm (Gallouj, 2002; Blind and Hipp, 2003; Chapman and Hyland, 2003). These attributes of manufacturing and services may have implications for ease with which firms enter and acquire knowledge from export markets, and hence for the learning by exporting effect. There may, in addition, be differences within services. For example, capital-intensive services such as energy and telecommunications require substantial initial investments in physical assets, with the corresponding effect of scale economies, suggesting that their relationship between sunk costs and exporting may be similar to that of manufacturing firms. By contrast, knowledge-intensive services do not require large investment in plant or physical assets, but do require substantial investment in human capital assets (Erramilli and D’Souza 1995; Sanchez-Peinado and Pla-Barber 2006). These sectors are unlikely to face the same sunk cost entry barriers as capital intensive services, and so they may enter international markets at lower levels of output.
Two key studies by Contractor et al (2003, 2007) examine the effect of
within services. Specifically, knowledge-based service firms (advertising, market research, financial services etc) achieve the benefits of internationalization earlier than capital-intensive service firms (air transport, hotels, wholesaling and retailing etc).
If, as Contractor et al (2003, 2007) argue, the barriers to internationalization are lower for service firms, and especially for knowledge-intensive service firms, than for
manufacturing enterprises, then it may also be the case that learning by exporting is faster and easier for such firms. We therefore re-estimate equation (1) separately for
manufacturing and services. The sample of firms is split approximately 60/40 manufacturing/services: as indicated in Table 1, all of the service sector firms in the sample are in knowledge-intensive sectors, precisely the type which might be anticipated to internationalize easily and so quickly learn from exporting. Overall manufacturing firms in the sample are more likely to export than services sector firms: 63% of manufacturers export at some point compared with 37% of service firms, and 46% of manufacturers export in both years compared with 26% of service sector firms.
Results are shown in Table 5, and are consistent with the hypothesis that service firms learn from exporting earlier than those in manufacturing. The pattern of exporting effects in manufacturing is similar to that of the sample overall. Only manufacturing firms exporting in both 2001 and 2004 are significantly more likely to innovate, suggesting that persistence in exporting is required to achieve learning by exporting in manufacturing. By contrast, for (knowledge intensive) service firms starting to export boosts both the likelihood of innovation and the intensity of sales of innovative products. While, as indicated earlier, the latter of these may be a scale effect linked to the larger size of export markets compared with domestic markets, the former is highly suggestive of service firms being able not only to internationalize earlier than manufacturing firms as hypothesized by Contractor et al (2003, 2007), but being able to learn from exporting at an earlier (entry) stage of the internationalization process
There are other differences in determinants of innovation between the manufacturing and service firms, notably the importance of external as well as internal R&D in
manufacturing, the high importance of supply-chain collaboration for innovation in services, and the positive effect of pursuing a niche marketing strategy on manufacturing innovation probability.
High-intensity versus low-intensity innovators
Earlier we saw that the relationship between exporting and productivity varied
pragmatic approach. Splitting the sample at 25% sales from new-to-market products provides a convenient split at the 75th percentile of innovation intensity. Firms with 25% of sales or above coming from new-to-market products are therefore considered high-intensity innovators, and innovators with fewer than 25% of sales coming from innovative products are labeled low-intensity innovators12.
There is broad similarity in the two groups in terms of commitment to exporting. For example, 64% of high-intensity and 58% of low-intensity firms export, and their relative average levels of export intensity is 18.6% and 20.8% respectively. However, their pattern of involvement in export markets is different. In particular, there is a marked difference in the pattern of export entry and exit between these two groups. The high-intensity innovators have a lot more starters (19% as opposed to 3% of low-high-intensity innovators) and a lower proportion of BOTH (40% as opposed to 49%), which suggests more ‘churn’ in export markets among highly innovative firms. The question then is whether this different pattern of export involvement leads to a different learning by exporting effect. Results are shown in Table 6.
For the low-intensity innovators, there is no exporting effect on innovation intensity. These firms do innovate successfully, and, as indicated above, are substantially involved in export markets, but there is no evidence that export entry and exit enhances or
diminishes the extent to which they sell innovative products in the marketplace.
For high-intensity innovators the results are striking and suggest the effect of exporting entry and exit is more complex than might be thought. The results indicate that those firms that are most successful in selling new products in the marketplace don’t require any boost from export markets to do so (i.e. they gain nothing from START). By itself, this is not perhaps surprising: from a resource-based perspective we would expect these highly successful firms to be the ones with the high-quality internal resources, as indicated by the importance of internal (but not external R&D) and the importance of skills to their innovation performance. By contrast, low-level innovators depend on external rather than internal R&D to boost innovation performance, and there is no skills effect on these firms. This suggests that high-intensity innovators have internal attributes that low-intensity innovators (which are nevertheless successful firms) lack: the
difference between high- and low-intensity innovators lies in aspects of their internal resources, not the boost they get from entering export markets.
What is more surprising, however, is that high-intensity innovators which persistently export (i.e. BOTH) tend to have a lower proportion of innovative products in their
portfolios, and that those which chose to stop exporting between 2001 and 2004 are more ‘successful’ innovators than those which never exported (the base category). At first sight this seems to pose a challenge for the learning by exporting hypothesis. However, it is actually consistent with the results we saw earlier for the quantile effects of exporting on productivity (output per worker). There we saw that exporting generally tended to be associated with a larger premium at the lower end of the productivity distribution. Here,
12 Performing the split at 40% of innovative sales results in a similar sign pattern on relevant coefficients,
the suggestion is that while entering and (especially) staying in export markets is good for getting over the innovation hurdle (viz. the probit results of Table 4), the most
innovation-intensive firms gain nothing by consistently remaining in export markets, and may actually benefit from ceasing to export.
Where firms are producing a rapidly changing product range, it may well make sense to concentrate on domestic markets from time to time in order to consolidate and check out the new product range, then move back into export markets when the time is right. Such an ‘export-dipping’ approach is also consistent with the data show earlier on the much higher level of export ‘churn’ among high-intensity innovators than their low-intensity counterparts. These are small, high-technology and relatively nimble enterprises, for which the fixed costs of export entry are presumably relatively low, and for which dipping in and out of export markets is a realistic possibility. This may not represent a coherent strategy, but rather a response to events as they unfold. There is evidence that high-tech SMEs often begin to internationalize on the basis of geographically dispersed niche markets based simply on the opportunities provided by unsolicited orders from abroad (Oakey 1984; Bell et al 2001) or as a result of family or other ties in foreign countries (Van Biesebroeck 2005). We should therefore not be surprised that the most highly innovative SMEs with a rapidly changing product offering should behave in this way, nor that ceasing to export for a time may allow the opportunity to consolidate the product range.
6. Discussion and conclusions
Theory strongly suggests the existence of learning by exporting, but the empirical literature has produced mixed results in terms of the effect of exporting on productivity, and to some extent on innovation. Using a sample of high-tech SMEs based in the UK, we find evidence which is consistent with the existence of a learning by exporting effect, but which suggests that the nature of any such effect is subtle and dependent on the export entry and exit behaviour of the firms concerned. Once the effects of other knowledge sources are allowed for, our results suggest that exporting helps high-tech SMEs innovate subsequently, but does not make them more innovation intensive. There is also evidence that it is consistent exposure to export markets that helps firms overcome the innovation hurdle, but that there is a positive scale effect of exposure to export
markets which allows innovative firms to sell more of their new-to-market products on entering export markets. Our results also suggest that service sector firms are able to reap the benefits of exposure to export markets at an earlier (entry) stage of the
internationalization process than are manufacturing firms.
While appearing to pose a challenge for the learning by exporting hypothesis, this is consistent with the previously observed behaviour of SMEs. In a recent analysis of ‘re-internationalization’, Welch and Welch (2009) point out that firms often engage in relatively intermittent exporting for extended periods, and that sporadic exporting is commonplace among UK SMEs without either entry or exit from export markets being a coherent strategy (Crick 2003). Similar results have been found for Italian SMEs, with repeated, serial entry and exit to and from export markets being relatively commonplace, and firms taking time to build up the experience and internal assets necessary to make export market entry a clear strategic decision (Bonaccorsi 1992).
Our results do appear to confirm that many highly innovative SMEs have an approach to export markets which is not particularly strategic. Instead, these relatively small and nimble enterprises may be responding to the opportunities afforded by orders coming from overseas and are prepared to dip into and out of export markets as the opportunity presents itself. Note that this is not necessarily inconsistent with learning by exporting: as indicated above, consistent exposure to export markets makes it more likely that high-tech SMEs produce new-to-market products, and firms which are already highly innovative may find that an ‘export-dipping’ approach is appropriate for them at this stage of their lifecycle. This may also be a result of UK high-tech SMEs being concerned (perhaps from past experience) that their innovative product will be easily copied by foreign competitors due to low levels of intellectual property protection that exist in some foreign markets (Smith 2001, 2002; Liu and Lin 2005; Weng et al 2009). This can cause high-tech firms that have a high proportion of radically innovative products in their portfolio to avoid exporting to such countries at least during the early stages of the introduction of such products to the market. Although reasonable, this interpretation cannot be tested as we do not have information about the exporting destinations of our sampled firms.
There are potential policy implications arising from this. Much of the justification for export subsidies and support given to firms (often SMEs) contemplating entry to export markets is implicitly based on the existence of a learning by exporting effect. By
supporting such firms in the short term, it is argued, innovation and productivity benefits will flow which will assist the competitive position not only of the assisted firms, but of the economy as a whole. However, if firms simply self-select into export markets and there is no beneficial learning by exporting effect, such subsidies and assistance may simply be a waste of resources. At least for the sample of firms in the current study, there is some suggestion that policy provision of this type is not wasted, although we do not claim to have carried out an evaluation of the impact of policy support on the firms concerned13. These and earlier findings do suggest, however, that some reconsideration of the learning by exporting effect is required, both in conceptual and in policy terms. Hitherto the perceived benefits of learning by exporting have been limited broadly to the transmission of tacit or proprietary knowledge from customers and suppliers in
international markets (World Bank 1993). The results reported above, coupled with
13 Such an analysis would involve estimation of the treatment effect of policy support on supported and
earlier findings on the export behaviour of SMEs (e.g. Crick 2003, 2004), suggest that learning by exporting effects should be extended to include the experiences gained from sporadic and intermittent exporting behaviour. Learning by exporting is ultimately a form of learning by doing, and this can also involve absorbing the lessons of intermittent or even failed attempts at selling abroad (Crick 2004; Welch and Welch 2009).
Table 1. Distribution of population and sample firms by industry
High Technology Sectors Sampling frame Sample respondents
Pharmaceutical 1.19 3.16
Computers 2.82 4.87
Electrical 9.96 15.57
TV and Radio 7.88 11.44 Medical, instrumentation, optical 12.14 22.39
Aerospace 1.22 1.7
Telecommunications 13.71* 5.84
Software 39.85* 21.9
R&D in natural sciences and
engineering 6.12 6.33
Technical testing 5.1 6.81
Table 2. Summary Statistics and variable description
Variable description Mean S.D.
Exporting Performance
Exports in 2004 – Whether a firm was an exporter in 2004 (0/1) 0.531 0.499 Percentage of exports in 2004 – Amount of export sales in relation to total
sales in 2004 (%) 19.56 29.51 Exports in 2001 - Whether a firm was an exporter in 2001 (0/1) 0.449 0.498 Percentage of exports in 2001 – Amount of export sales in relation to total
sales in 2001 (%)
15.03 26.71
Innovation variables
Product Innovation – New to the market product in the last 3 years (0/1) 0.56 0.49 Innovation success – Percentage of new to the market products sales (%) 20.3 29.8 Knowledge sourcing activities of a technical nature
Percentage Internal R&D – R&D undertaken within the firm (% of R&D
expenditure in relation to total expenditure) 22.53 31.99 Percentage External R&D – R&D undertaken outside the firm in the form
of totally outsourced contracts (% of R&D expenditure in relation to total expenditure )
3.43 11.72
Formal collaborative agreements of a technical nature with
customers/suppliers (0/1) 0.12 0.314 Formal collaborative agreements of a technical nature with other companies
(0/1) 0.11 0.317
Formal collaborative agreements of a technical nature with
universities/public research institutions (0/1) 0.08 0.26
Resources Employment (number) 16.07 26.37
Part of a group (other company owns less than 50 % equity or firm is head
of group, 0/1)) 0.08 0.273 Firm age (years) 10.57 6.76 Percentage of workforce with degree (%) 41.62 36.3 Government and EU assistance
Government assistance on R&D for product/process (0/1) 0.12 0.329 Market strategy
Table 3. Value of the export premium on labour productivity
Quantiles
overall 0.1 0.25 0.5 0.75 0.9
EXit 0.23** 0.43** 0.26** 0.13 0.18 0.19
Notes: **p<0.05. The coefficient on EXit is derived from equation (1) in the text, estimated by quantile regression.
Table 4. Determinants of Innovation: full sample
Product Innovator
(Probit)
Product Innovation Success (Truncated regression)
Product Innovator (Probit)
Product Innovation Success (Truncated regression)
Exporting
Exporter 2001 0.155** 0.072 -7.467 5.190
Start 0.146 0.105 13.901** 7.039
Both 0.165** 0.076 -6.693 5.641
Stop 0.066 0.142 5.427 9.759
Knowledge Sources
Internal R&D 0.003*** 0.0011 0.141** 0.068 0.003*** 0.0011 0.188*** 0.06
External R&D 0.000 0.0026 0.290* 0.163 -0.0001 0.0026 0.264* 0.164
Collaboration with customers/suppliers 0.245** 0.107 0.825 6.868 0.251** 0.105 -3.083 6.832
Collaboration with other companies -0.079 0.122 1.119 8.050 -0.003 0.1124 2.682 86.869
Collaboration with universities 0.279** 0.140 -2.076 8.577 0.218 0.140 -1.572 8.334
Resources
Employment 0.009 0.006 -0.206 0.563 0.009 0.006 -0.224 0.560
Employment squared -0.0001* 0.00008 0.004 0.009 -0.0001* 0.00008 0.004 0.009
Part of group of firms 0.067 0.151 3.359 8.170 0.067 0.142 1.614 8.156
Firm age -0.000 0.006 0.112 0.474 -0.000 0.006 0.119 0.442
Percentage of workforce with degrees -0.000 .001 0.215*** .079 -0.000 .0001 0.146** .069
Government and EU assistance
Assistance on R&D for products/services 0.195** 0.098 7.213 6.034 0.129** 0.101 5.895 6.751
Marketing Strategy
Niche market 0.129 0.092 -5.902 6.969 0.144* 0.087 -1.749 6.969
Constant 0.443*** 0.152 -12.072 15.175 0.486*** 0.148 -14.676 14.573
Observations 269 145 289 157
Log-Likelihood -155.52 -653.01 -168.61 -707.24
Test of probit-truncated model versus tobit (χ2) 36.59 38.46
Table 5. Determinants of Innovation: manufacturing versus services
Manufacturing Services
Product Innovator
(Probit)
Product Innovation Success (Truncated regression)
Product Innovator (Probit)
Product Innovation Success (Truncated regression) Exporting
Start 0.110 0.136 11.360 8.848 0.266 * 0.149 31.611** 14.483
Both 0.215** 0.098 -5.095 7.021 0.050 0.138 -9.529 9.660
Stop -0.055 0.224 6.122 15.045 0.150 0.193 -0.478 13.791
Knowledge Sources
Internal R&D 0.002 0.0016 0.192** 0.087 0.004** 0.0016 0.144 0.092
External R&D -0.0002 0.002 0.337* 0.191 -0.0028 0.008 -0.230 0.480
Collaboration with customers/suppliers 0.209 0.152 -6.642 10.303 0.393*** 0.114 3.332 10.155
Collaboration with other companies -0.017 0.179 0.027 10.835 0.050 0.153 6.815 9.780
Collaboration with universities 0.222 0.153 4.024 9.174 -26.672 23.468
Resources
Employment -0.0005 0.007 -0.034 0.678 0.027** 0.010 0.841 1.363
Employment squared -0.000 0.000 0.0001 0.010 -0.0002** 0.0001 -0.020 0.036
Part of group of firms -0.078 0.246 -8.341 14.752 0.139 0.175 8.939 10.749
Firm age 0.001 0.007 0.317 0.539 -0.003 0.01 -0.268 0.724
Percentage of workforce with degrees -0.0002 0.001 0.194** 0.088 -0.0004 0.158 0.0531 0.118
Government and EU assistance
Assistance on R&D for products/services 0.182* 0.113 3.842 6.738 0.012 0.254 21.918 14.215
Marketing Strategy
Niche market 0.320*** 0.114 14.075 12.848 0.027 0.125 -6.704 9.147
Constant -0.611 0.195 -29.008 20.936 -0.536** 0.255 5.999 19.624
Observations 164 88 125 69
Log-Likelihood -94.82 -389.76 -66.57 -312.33
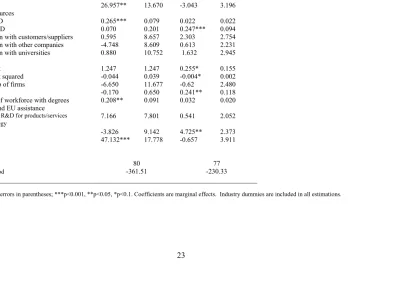
Table 6. Determinants of Innovation Intensity: high-intensity versus low-intensity innovators (truncated regression)
High-intensity innovators Low-intensity innovators
Exporting
Start -2.328 8.458 5.993 4.548
Both -17.166** 7.465 -0.902 1.736
Stop 26.957** 13.670 -3.043 3.196
Knowledge Sources
Internal R&D 0.265*** 0.079 0.022 0.022
External R&D 0.070 0.201 0.247*** 0.094
Collaboration with customers/suppliers 0.595 8.657 2.303 2.754
Collaboration with other companies -4.748 8.609 0.613 2.231
Collaboration with universities 0.880 10.752 1.632 2.945
Resources
Employment 1.247 1.247 0.255* 0.155
Employment squared -0.044 0.039 -0.004* 0.002
Part of group of firms -6.650 11.677 -0.62 2.480
Firm age -0.170 0.650 0.241** 0.118
Percentage of workforce with degrees 0.208** 0.091 0.032 0.020
Government and EU assistance
Assistance on R&D for products/services 7.166 7.801 0.541 2.052
Marketing Strategy
Niche market -3.826 9.142 4.725** 2.373
Constant 47.132*** 17.778 -0.657 3.911
Observations 80 77
Log-Likelihood -361.51 -230.33
References
Acs Z J and Audretsch D B (1987) ‘Innovation, market structure and firm size’, Review of Economics and Statistics, 69, 567-574.
Arnold J M and Hussinger K (2005) ‘Export behaviour and firm productivity in German manufacturing: a firm-level analysis’, Weltwirtschaftliches Archiv, 141, 219-243.
Aw B Y, Roberts M J and Winston T (2007) ‘Export market participation, investments in R&D and worker training, and the evolution of firm productivity’, The World Economy, 30, 83-104.
Aw B Y, Roberts M J and Xu D Y(2008) ‘R&D investments, exporting, and the evolution of firm productivity’, American Economic Review, 98, 451-456.
Autio, E., Sapienza, H. J., & Almeida, J. G. (2000). ‘Effects of age at entry, knowledge intensity, and imitability on international growth.’ Academy of Management Journal, 43: 909–924.
Bartelsman, E.J. and M. Doms (2000), “Understanding productivity: lessons from longitudinal microdata”, Journal of Economic Literature, 38,. 569-595.
Baldwin J R and Gu W (2004) ‘’Trade liberalization: export-market participation, productivity growth, and innovation’, Oxford Review of Economic Policy, 20, 372-392.
Bell J, McNaughton R and Young S (2001) ‘Born-again global firms – an extension to the ‘Born Global’ phenomenon’, Journal of International Management, 7, 173-189.
Bernard A B and Jensen J B (1995) ‘Exporters, jobs and wages in US manufacturing, 1976-1987’, Brookings Papers on Economic Activity, Microeconomics.
Bernard A B and Jensen J B (1999) ‘Exceptional export performance: cause, effect, or both?’ Journal of International Economics, 47, 1-25.
Bernard A B and Jensen J B (2004) ‘Exporting and productivity in the USA’, Oxford Review of Economic Policy, 20, 343-357.
Blind, K.and Hipp, C. (2003) The role of quality standards in innovative service companies: An empirical analysis for Germany, Technological Forecasting and Social Change. 70, pp. 653-669.
Blind, K, and A Jungmittag. (2004) ‘Foreign direct investment, imports and innovations in the service industry’, Review of Industrial Organisation 25, 205-227.
Bonaccorsi, A. 1992. On the relationship between firm size and export intensity. Journal of International Business Studies, 23: 605–635.
Brouwer, E and Kleinknecht, A (1996) ‘Firm size, small business presence and sales of innovative products: a microeconomic analysis’, Small Business Economics, 8, 189-201.
Burgel, O., Fier, A., Licht, G., & Murray, G. 2001. The rapid internationalization of high-tech young firms in Germany and the United Kingdom. London: Anglo-German Foundation.
Butchard R (1987) ‘A new definition of high technology industries’, Economic Review, 400, 82-88.
Castellani (2002) ‘Export behaviour and productivity growth: evidence from Italian manufacturing firms’, Weltwirtschaftliches Archiv, 138, 605-628.
Chapman, R.and Hyland, P. (2003) Complexity and learning behaviours in product innovation, Technovation, 23, pp. 553-561.
Clerides S K, Lach S and Tybout J R (1998) ‘Is learning-by-exporting important? Micro-dynamic evidence from Colombia, Mexico and Morocco’, Quarterly Journal of
Economics, 113, 903-947.
Cohen, W.M., Levinthal, D.A. (1989) ‘Innovation and learning: the two faces of R&D’. The Economic Journal, 99, 569–596.
Contractor F J, Kundu S K and Hsu C-C (2003) ‘A three-stage theory of international expansion: the link between multinationality and performance in the service sector’, Journal of International Business Studies, 34, 5-18.
Contractor F J, Kumar, V and Kundu S K (2007) ‘Nature of the relationship between international expansion and performance: the case of emerging market firms’, Journal of World Business, 42, 401-417.
Cragg, J (1971) ‘Some statistical models for limited dependent variables with application to the demand for durable goods’, Econometrica, 39, 829-844.
Crick, D. (2003). The international entrepreneurial decision of UK SMEs to discontinue overseas activities: A research note reporting practices within the clothing industry eighteen months on. Journal of International Entrepreneurship, 1(4), 405–413.
Del Barrio-Castro, T., Garcia-Quevedo, J., 2005. Effects of university research on the geography of innovation. Regional Studies 39 (9), 1217-1229.
Department of Trade and Industry (2003) ‘Innovation Report’, London.
Erramilli M K and D’Souza (1995) ‘Uncertainty and foreign direct investment: the role of moderators’ International Marketing Review, 123, 47-60.
Filatotchev I, Liu X, Buck T and Wright M (2009) ‘The export orientation and export performance of high-technology SMEs in emerging markets: the effects of knowledge transfer by returnee entrepreneurs’, Journal of International Business Studies, 40, 2009, 1005-1021.
Freel, M.S. (2000) Strategy and structure in innovative manufacturing SMEs: The case of an English region, Small Business Economics, 15, pp. 27- 45.
Freel, M.S. and Robson, P.J.A., 2004. Small firm innovation, growth and performance - Evidence from Scotland and northern England. International Small Business Journal 22, 561-575.
Gallouj, F. (2002) Innovation in services and the attendant old and new myths, The Journal of Socio-Economics, 31, pp. 137-154.
Ganotakis P and Love J H (2009) ‘The innovation value chain in new technology based firms: evidence from the UK’, Research Paper 0916, Aston Business School,
Birmingham.
Geroski, P.A., (1990) ‘Innovation, Technological Opportunities, and Market Structure’ Oxford Econonomic Papers, 42, 586-602.
Girma S, Gorg H and Hanley A (2008) ‘R&D and exporting: A comparison of British and Irish firms’,Review of World Economics, 144, 750-773.
Goddard J, Tavakoli M and Wilson J O S (2006) ‘Determinants of profitability in European manufacturing and services: evidence from a dynamic panel model’, Applied Financial Economics, 15, 1269-1282.
Greenaway D, Gullstrand J and Kneller R (2005) ‘Exporting may not always boost firm productivity’, Weltwirtschaftliches Archiv, 141, 561-582.
Griliches, Z.,(1992). ‘The Search for Research-And-Development Spillovers’, Scandinavian Journal of Economics, 94, S29-S47.
Grossman, G.M. and Helpman, E. (1991a) ‘Trade, Knowledge Spillovers, and Growth’. European Economic Review, 35, 517-526..
Grossman, G, and Helpman, E (1991b) Innovation and Growth in the World Economy (Cambridge, MA: MIT Press).
Harris R I D and Trainor M (1995) ‘Innovations and R&D in Northern Ireland manufacturing: a Schumpeterian approach’, Regional Studies, 29, 593-604.
Heckman, J J. (1979) ‘Sample Selection Bias as a Specification Error’, Econometrica 47, 153-161.
Helpman, E., Melitz, M., Yeaple, S., (2004) ‘Export versus FDI with heterogeneous firms’, American Economic Review, 94, 300–316.
Hemphill, T.A., 2003. Cooperative Strategy, Technology Innovation and Product Development in Industrial Companies. International Journal of Production Economics 69, 169-76.
Jones, M. V. 2001. First steps in internationalisation: Concepts and evidence from a sample of small high-technology firms. Journal of International Management, 7(3): 191– 210.
Joshi, A.W., Sharma, S., 2004. Customer Knowledge Development: Antecedents and Impact on NewProductPerformance. Journal of Marketing 68, 47-59.
Koenker, R. and G. Bassett (1978), “Regression quantiles”, Econometrica, Vol. 50, pp.43-61.
Knight, G. A., & Cavusgil, S. T. 2004. Innovation, organizational capabilities, and the born-global firm. Journal of International Business Studies, 35: 124–141.
Leiponen, A. (2005) Organization of knowledge and innovation: The case of Finnish business services, Industry and Innovation, 12, pp. 185-203.
Liao, J, H Welsh, and M Stoica. 2003. Organizational absorptive capacity and firm responsiveness: an empirical investigation of growth-oriented firms. Entrepreneurship Theory and Practice (Autumn):63-85.
Liu W H and Lin Y C (2005) ‘Foreign patent rights and high-tech exports: evidence from Taiwan’ Applied Economics, 37, 1543-1555.
Love J H and Mansury M A (2007) ‘External Linkages, R&D and Innovation Performance in US Business Services’ Industry and Innovation, 14, 477-496.
Love, J.H. and Roper, S. (2002) Innovation and export performance: evidence from the UK and German manufacturing plants, Research Policy, 31, pp. 1087-1102.
Love J.H. and Roper, S. (1999) ‘The determinants of innovation: R & D, technology transfer and networking effects’, Review of Industrial Organization 15, 43-64.
Love J H, Roper S and Du J (2009) ‘Innovation, ownership and profitability’, International Journal of Industrial Organization, 27, 424-434.
Love J H, Roper S and Hewitt-Dundas N (2010) ‘Service Innovation, Embeddedness and Business Performance: Evidence from Northern Ireland’, Regional Studies, forthcoming.
Lynskey M J (2004) ‘Determinants of innovative activity in Japanese technology-based start-up firms’, International Small Business Journal 22, 159-196.
Oakey R (1984) High technology small firms, innovation and regional development in Britain and the United States, London: Frances Pinter.
Office of National Statistics (2002) ‘Research and Development in the UK’, London
Office of National Statistics (2003) ‘Press Release Unique Reference Number 03/92’, London.
Podsakoff P M and Organ D W (1986) ‘Self Reports in Organizational Research: Problems and Prospects’ Journal of Management, 12, 531-544
Podsakoff P M, MacKenzie S B, Lee J Y and Podsakoff N P (2003) ‘Common Method Biases in Behavioral Research: A Critical Review of the Literature and Recommended Remedies’ Journal of Applied Psychology, 88, 879-903.
Roberts M and Tybout J R (1997) ‘The decision to export in Colombia: an empirical model of entry with sunk costs’, American Economic Review, 87, 545-564.
Roper S, Du J and Love J H (2008) ‘Modelling the innovation value chain’, Research Policy, 37, 961-977.
Roper, S., Hewitt-Dundas, N., Love, J.H., 2004. An Ex Ante Evaluation Framework for the Regional Benefits of Publicly Supported R&D Projects. Research Policy33, 487-509.
Sanchez-Peinado E and Pla-Barber J (2006) ‘A multidimensional concept of uncertainty and its influence on entry choice; an empirical analysis in the service sector’,
Salomon R and Jin B (2008) ‘Does knowledge spill to leaders or laggards? Exploring industry heterogeneity in learning by exporting’, Journal of International Business Studies, 39, 132-150.
Salomon R and Shaver J M (2005) ‘Learning by exporting: new insights from examining firm innovation’ Journal of Economics and Management Strategy, 14, 431-460.
Smith P J (2001) ‘How do Foreign Patents Rights Affect U.S. Exports, Affiliate Sales, and Licenses? Journal of International Economics, 55, 411-439.
Smith P J (2002) ‘Patent Rights and Trade: Analysis of Biological Products, Medicinals and Botanicals, and Pharmaceuticals’ American Journal of Agricultural Economics, 84, 495-512.
Smith, D.J., Tranfield, D., 2005. Talented suppliers? Strategic change and innovation in the UK aerospace industry. R&D Management 35, 37-49.
Tether B S, Storey D J (1998) ‘Smaller firms and Europe’s high technology sectors: a framework for analysis and some statistical evidence’ Research Policy, 26, 947-971.
Van Biesebroeck J (2005) ‘Exporting raises productivity in sub-Saharan African manufacturing firms’, Journal of International Economics, 67, 373-391.
Veugelers, R. and Cassiman, B. (1999) Make and buy in innovation strategies: evidence from Belgian manufacturing firms, Research Policy, 28, pp. 63-80.
Wagner J (2007) ‘Exports and productivity: a survey of the evidence from firm-level data’, The World Economy, 30, 60-82.
Welch C L and Welch L S (2009) ‘Re-internationalisation: exploration and conceptualisation’, International Business Review, 18, 567-577.
Weng Y H, Yang C H and Huang Y J (2009) ‘Intellectual property rights and US information goods exports: the role of imitation threat’ Journal of Cultural Economics, 33, 109-134.
World Bank (1993) The East Asian Miracle (New York: Oxford University Press).
Zahra, S. A., Ireland, R. D., & Hitt, M. A. 2000. International expansion by new venture firms: International diversity, mode of market entry, technological learning, and