James et al. World Journal of Engineering Research and Technology
TASK RELEVANCE VS SALIENCY IN COMPUTATIONAL
MODELLING OF DIRECTED ATTENTION FATIGUE
James Mountstephens* and Toh Chia Ming
Faculty of Computing and Informatics, Universiti Malaysia Sabah, Jalan UMS, 88400, Kota
Kinabalu, Sabah, Malaysia.
Article Received on 05/09/2019 Article Revised on 26/09/2019 Article Accepted on 16/10/2019
ABSTRACT
Failures of visual attention can be life threatening. Computer models of
visual attention have not previously addressed the issue of fatigue over
time and also its underlying mechanisms. This work explores the
hypothesis that directed attention fatigue is caused by an inability to
inhibit responses to salient distractors in favour of task-relevant targets.
A model of this competition in gaze allocation was constructed using
the Matlab Saliency toolbox implementation of Itti and Koch‟s bottom-up attention model
which was extended with foveation, decision making, and a task-relevance map. Human
performance and gaze data was collected by eye tracker during a novel mentally-fatiguing
task and used to tune and evaluate the model. The initial results are encouraging.
KEY WORDS: Computer Modelling; Attention; Fatigue; Saliency.
INTRODUCTION
Our ability to concentrate on tasks is crucial for success and survival. In varying degrees,
concentration is required for most activities and, for many sustained tasks such as driving,
piloting and visual surveillance, a loss of concentration may be safety critical. Attention, a
key aspect of human perception, is the mechanism underlying concentration. Failures of our
ability to attend prevent proper concentration. In the visual modality, which this research is
concerned with, attention directs gaze, and failure to attend to task-relevant locations in a
scene is likely to yield poor performance. When attention is directed towards a task,
World Journal of Engineering Research and Technology
WJERT
www.wjert.org
SJIF Impact Factor: 5.924
*Corresponding Author
Dr. James Mountstephens
Faculty of Computing and
Informatics, Universiti
Malaysia Sabah, Jalan
UMS, 88400, Kota
performance may vary over time in response to changes in motivation, interest level, and
knowledge. But, even with high motivation, there are limits on how long attention can be
sustained, and it will eventually deteriorate. Depending on the task in question, this Directed
Attention Fatigue (DAF) may have consequences ranging from discomfort and performance
degradation, to possible injury and death (Berman and Kaplan 2010). It is therefore important
to understand the mechanisms of DAF since this might allow us to redesign tasks or
performance strategies in order to mitigate it. Computer modelling of attention and its fatigue
could help better understand the phenomenon. One hypothesis to explain DAF revolves
around the generally-accepted idea that attention has two main modes of operation,
distinguished by effort and intentionality (Itti et al, 2005). Crucially, these two modes drive
our gaze towards different parts of a scene and therefore compete with each other to
determine where we actually do look. In bottom-up mode, governed by primitive areas of the
brain, our gaze is drawn involuntarily to locations by salient visual properties of the scene. In
top-down or voluntary mode, we choose where to look, based on higher functions such as
object recognition and executive control which manifest in the prefrontal cortex (PFC). The
PFC is known to exert inhibitory control over lower brain areas and therefore, directing our
attention to perform tasks means inhibiting responses to competing stimuli and bottom-up
cues (Itti et al, 2005), which requires effort from higher brain areas, a resource considered
limited (Berman and Kaplan 2010). DAF is therefore an inability to inhibit bottom up
distractors and to actively direct gaze, induced by sustained concentration. Although this
explanation in terms of competition is plausible, it is not yet proven and no practical
computer model of it yet exists.
Although computational models of visual attention have been developed, DAF has not been
incorporated into them. Our previous work (Mountstephens and Toh 2015) is the only
attempt so far to address this issue. Progress was made by substantially extending the
influential bottom-up attention model of Itti and Koch (IKM) to model sustained task
performance with the addition of foveation, top-down task relevance, object recognition,
decision making and action. Human gaze data under DAF within a sustained task were
gathered using an eye tracker and custom software. This data was used to develop a model
that generated the measurable gaze characteristics and deterioration in performance
associated with DAF. Our earlier model‟s predictions were the emergent behaviour of
interacting functional and biologically-inspired processes, and not simply a mathematical
explanatory, focusing on the functional mechanism of DAF that gives rise to these
measurable properties. Specifically, the hypothesis in the literature that DAF is caused by a
failure to inhibit bottom-up distractors is explored by directly modelling and testing its results.
To this end, we devised a novel sustained task to clearly control the competing elements of
saliency and task relevance. Performance and gaze patterns on this task by human subjects
were measured by eye tracker. We then extended both IKM and our previous model by
setting up competing maps for saliency and task relevance and ran this model on the same
task as the test subjects to compare its output with human performance and gaze patterns.
Computer modelling of attention is an active research area that borders with neuroscience and
computer vision. A number of models have been devised ranging from top-down / task based
to entirely bottom-up. A comprehensive survey can be found in Borji and Itti (2013) but here
only the particular model used in this research will be described in detail. This work extends
the popular bottom-up attention model due to Itti and Koch (1998) (hereafter known as IKM,
for Itti and Koch Attentional Model) which, when given an image or image sequence, is
designed to output a sequence of gaze fixation points. A schematic showing the sequence of
operations is found in figure 1.
Figure 1: Itti and Koch Attention Model (Itti, Koch, and Neibur 1998).
Saliency is a property related to the „pop out‟ effect commonly found in visual search
experiments where an object may be especially conspicuous relative to its neighbours
because it differs in some property. For example, a circle found amongst squares or a green
of the conspicuity of an image point based purely on local differences in low-level features
and is embodied within a saliency map, an array of neural processing units analogous to the
input image whose activity encodes saliency for each image point. During operation, a
process of local competition amongst neurons determines that with the highest activation (the
„winner‟) which, as most salient, is taken to be the new location of gaze for the next time-step.
Activation in the saliency map evolves over time in response to features of the input image
sequence and an internal biasing mechanism called inhibition of return (IOR), which
negatively weights the region in the saliency map centered on the current gaze location. This
prevents gaze from becoming stuck in a single location and enforces a scan of the scene.
Within IKM, information is represented in maps which are analogous to the input image, or
some function of it. These maps are produced by filtering and combining features. The
saliency map is the most important map since it ultimately determines the gaze fixation point.
Inspired by biological visual receptors, local differences are considered more important than
absolute values and a filter‟s response at a given location depends on how the value there
differs from its neighbours. Specifically, the values in each feature map are calculated in an
approximation to a centre-surround response, produced by convolving a raw feature map with
a Gaussian kernel at progressively larger standard deviations and differencing between this
hierarchy, or „Gaussian pyramid‟, of maps. The features used in calculating saliency are
inspired by those found in early regions of the human visual cortex. Raw features can be
either static or time-dependent. Colour opponency (red/yellow and green/blue), orientation
and intensity are the most common static features and can be calculated from a single image
whereas the dynamic features of motion and flicker require an image sequence for their
calculation. Calculation of the centre-surround response for each of these raw feature maps is
the first stage in model execution and is conducted as above. Depending on the exact
configuration of the visual cortex there may be several feature maps for a feature type (eg. for
motion, there may be motion left, motion right, up and down) so these are combined into a
single conspicuity map to summarise the total response for the type of feature in question.
Conspicuity maps are combined in a similar fashion to form the saliency map for this time
step and this provides enough information to decide the gaze location. A winner-takes-all
process is used to find the point of highest saliency (or more accurately, the neuron in the
saliency map array with the highest activation) which is the model‟s current output. Finally, a
mechanism of inhibition of return (IOR) negatively weights the saliency map in an area
the next time-step. Since gaze cannot return to the current location until the negative
weighting subsides, a serial search of the image in order of decreasing saliency is enforced.
IKM has been used and cited in a large number of projects and publications and has shown to
successfully replicate some aspects of human gaze allocation. The basic bottom-up IKM
model with saliency map has also been extended by the original author (Navalpakkam and Itti
2005) to include a Task Relevance Map (TRM), which can allow object recognition to
influence gaze location, originally to allow the tracking of specific objects. The TRM
responds to a specific object or set of visual features and competes with bottom-up saliency
in a similar manner to the generally-accepted account of competing modes of attention
described earlier. The weighting of the TRM vs saliency is therefore of paramount
importance.
However, IKM in any of its versions does not fatigue over time and no modelling of DAF is
included, making IKM unrealistic for sustained and challenging tasks, even with additonal
TRM. Our previous work attempted to remedy this shortcoming by extending IKM with
task-based object recognition, decision making functions, and a probabilistic model of DAF. In
(Mountstephens and Toh 2015) we attempted to capture the gaze patterns associated with
DAF using a custom test and eye tracking on human subjects. The custom test extended the
widely-used SART (Sustained Attention Response Test) test (Itti et al 2005) used in the
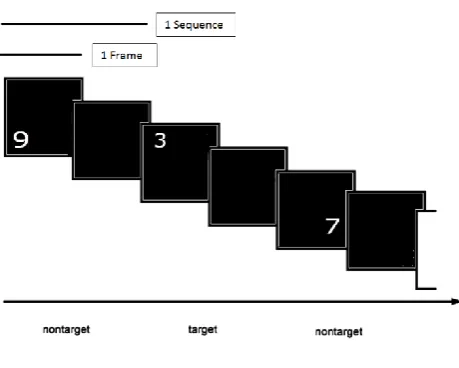
psychological literature which is administered to induce DAF in test subjects. Briefly put,
SART requires the subject to view a screen where digits from 1-10 are rapidly shown and are
required to press a button on every number except a 3 where pushing the button must be
inhibited. In other words, digits 0-2 and 4-9 are distractors and digit 3 is the target. The
original SART is knownto induce DAF but it does not have a significant spatial / gaze
component making it unsuitable for studying the gaze patterns associated with DAF. We
extended SART by moving the cue around the screen which required significant gaze
allocation. This new test, Spatial SART (SSART) was able to induce DAF in subjects and
revealed changes in gaze and test performance as fatigue set in. It was observed that task
performance deteriorated over time and gaze distance to target and reaction time increased
Figure 2: Spatial SART Test.
This gaze and performance data from human subjects was used to construct a computer
model that extended IKM to using foveation, template matching, and a probabilistic function
of time that determined where gaze would be at any given moment. The model‟s predictions
were in acceptable accordance with the human gaze and performance data. However, SSART
and the resulting attention model did not explicitly address the underlying mechanism of
DAF hypothesised in the psychological literature, namely as competition between effortful
top-down concentration and effortless bottom-up saliency. This is the purpose of this current
work.
MATERIALS AND METHODS
Although SSART was able to induce fatigue and had a significant gaze component, it did not
present stimuli that were clearly separable as being either salient or task-based. For this
purpose, we extended SSART by devising a new test called TRM-SSART (Task-Relevance
Map SSART) which enabled a top-down versus bottom-up scenario where test participants
needed to suppress distracting elements that have high saliency but which are also irrelevant
to the task. To do this, Spatial SART functionality was maintained but with the addition of
distracting elements. The targets of this test are colored numbers (instead of the original
white in SSART) which are low saliency targets compared to the distractor - a white square
box the same size as the target. This distractor was chosen since, according to theory it was
expected to produce strong responses in both the orientation and intensity conspicuity maps.
This high saliency was also confirmed by manual inspection of Matlab saliency toolbox
output. This difference in visual properties of the target and distractor allows competition
said to be the cause of DAF. Distractors are generated at random locations but they will not
obscure the targets.
Performance and gaze data were collected from 8 Malaysian university students using a
custom Matlab implementation of TRM-SART lasting 15 minutes. Gaze was measured using
a Mirametrix S2 eye tracker running at 60Hz. The variables measured were task performance,
distance to target, and distance to non-target (ie distractor).
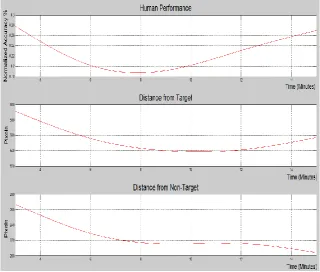
Figure 3: Human Subject TRM-SSART Data.
Since it is designed to induce DAF quickly, this test is extremely difficult, as can be seen by
the fact that participants only start with 28% accuracy at the beginning of the test, which
the end, performance is seen to recover, indicating a cyclical component to fatigue. This
cyclical component will prove important later. Performance correlates strongly with Distance
to Non-target since a reduction in this variable means the participants were more distracted to
the non-target over time. The changes in distance to target however had no visible correlation
with the performance with decreasing distance to target over time. By comparing the rate of
change between distance to target and distance to non-target, distance to non-target had
higher decrement therefore showing that participants were more often distracted instead of
attending to the correct target location.
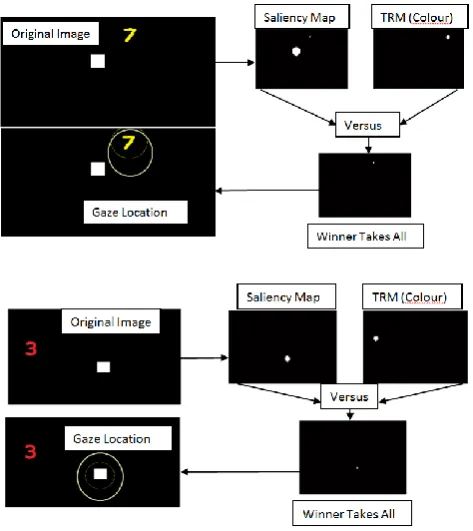
To model these results and explore the hypothesis of competing top-down and bottom-up
influences on attention, we extended our previous work using the Matlab Saliency Toolbox
and custom code for foveation, target pattern matching based on filter response, and decision
making. The saliency map provided the bottom up response (primarily to the distractor) and
the pattern matching filters provided the top down response across the image. These two
responses compete based on a weight function w(t) that control the respective influence of
the TRM on gaze. When w(t) is higher, gaze is more likely to be drawn task-relevant
locations, especially the target. However, with lower values of w(t), saliency is likely to
overpower task relevance and gaze will be distracted from the target, degrading performance.
These two scenarios are illustrated below.
Clearly, the exact nature of w(t) is crucial to model output. Since the the mechanism of DAF
is hypothesised to be the increasing inability of top-down influence to suppress bottom-up
responses, w(t) should decrease over time. However, the cyclical component observed in the
human performance data just seen suggests that a cosine function is an appropriate form for
w(t). Based on experimentation, the following function was found to fit the human
performance data best.
RESULTS AND DISCUSSION
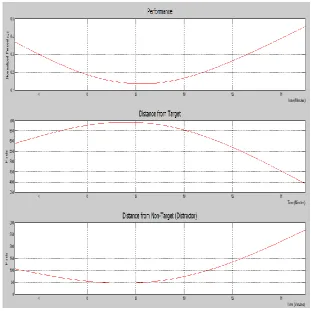
The output of the computer model was the same as the human subjects: i) a decision about
the target and ii) a location of gaze. This allowed a direct comparision of model output and
human data to determine the accuracy of the model. The system was run on the same
TRM-SSART test as the human subjects and the same three variables were measured. The results
are shown below in figure 5.
By comparing figures 3 and 5, it can be seen that task performance by the model is similar to
the human data. This was not unexpected as the model‟s core module which is the TRM was
based on the human performance data. However, the model‟s performance was a lot better
than the human performance and the Distance to Target graph has opposing trends for the
model and human data. The last graph which is the Distance to Non-target also has differing
trends over time between the model and human data.
To measure how much deviation of the model result to the human data in terms of all the
variables, MSPE was also used. MSPE for the model‟s performance has 2.43% deviation
from the collected human data while distance from target has 4.48% deviation from the
collected human data. MSPE for model Distance to non-target was 1156% deviation from the
human data as there is a huge difference in distance value. From here, it can seen that the
distance to non-target is totally off compared to the human data counterpart while the average
distance from target for the explanatory model is higher than the predictive model.
CONCLUSION
Overall this model managed to adequately simulate some aspects of human behavior on the
TRM SSART test, namely the overall performance trend were on par with the human results.
More research needs to be done however overcome the deviation of gaze patterns between
the human data and model results.
REFERENCES
1. Berman M G and Kaplan, S (2010). "Directed Attention as a Common Resource for
Executive Functioning and Self-Regulation". Perspectives on Psychological Science.
5(1): 43–57.
2. Itti L, Rees G, Tsotsos, J K (eds.) (2005). Neurobiology of Attention. Boston: Elsevier
Academic Press.
3. Mountstephens J and Toh C M (2015) “Towards A Computer Model Of Attention
Fatigue”. International Journal of Recent Advances in Multidisciplinary Research 2(9):
774-782.
4. Borji A, Itti L. (2013) “State-of-the-art in visual attention modeling.” Pattern Analysis
and Machine Intelligence, IEEE Transactions, 35(1): 185-207.
5. L Itti, C Koch, E Niebur, (1998) “A Model of Saliency-Based Visual Attention for Rapid
Scene Analysis,” IEEE Transactions on Pattern Analysis and Machine
6. Navalpakkam V, Itti L (2005) “Modeling the influence of task on attention” Vision