Pharmacophore 2014, Vol. 5 (2), 262-272 USA CODEN: PHARM7 ISSN 2229-5402
Pharmacophore
(An International Research Journal)Available online at http://www.pharmacophorejournal.com/
Original Research Paper
STABILITY INDICATING HPLC METHOD FOR SIMULTANEOUS
ESTIMATION OF CIPROFLOXACIN AND PHENYLEPHRINE IN
PHARMACEUTICAL DOSAGE FORM
Khushbu B. Patel
*, Krupa C. Thula and Dilip G Maheshwari
Department of Quality assurance, L.J. Institute of Pharmacy, Ahmedabad-382 210, India
ABSTRACT
A simple, specific, accurate, and stability indicating reversed-phase high-performance liquid chromatographic method was developed for the simultaneous determination of ciprofloxacin hydrochloride andphenylephrine hydrochloride using a Zorbax Bonus RP C18 column and a mobile phase composed of Water : Acetonitrile : Triethylamine (85: 15: 0.1, v/v/v), pH 3 adjusted with orthophosphoric acid. The retention times of ciprofloxacin hydrochloride andphenylephrine hydrochloride were found to be 3.71 min and 2.17 min, respectively. Linearity was established for ciprofloxacin hydrochloride and phenylephrine hydrochloride in the range of 150-900 μg/ml and 5-30 μg/ml, respectively. The percentage recoveries of ciprofloxacin hydrochloride andphenylephrine hydrochloride were found to be in the range of 98.04-101.04%. Both the drugs were subjected to acid and base hydrolysis, oxidation, UV and thermal degradation conditions. Degradation peak was well resolved from the main peak of drug. This method can be successfully employed for simultaneous quantitative analysis of ciprofloxacin hydrochloride and phenylephrine hydrochloride in bulk drugs and formulations.
Keywords:
Ciprofloxacin hydrochloride, Phenylephrine hydrochloride, Stability indicating HPLCmethod, Bulk drugs, Formulations, Hydrolysis, Oxidation, Thermal degradation.
INTRODUCTION
Ciprofloxacin hydrochloride (CIP), an antibacterial drug is widely used to treat a number of infections including infections of bones and joints, endocarditis, gastroenteritis, malignant otitis externa, respiratory tract infections, cellulitis, urinary tract infections, prostatitis, anthrax, chancroid among others [1-3]. Chemically it is the monohydrochloride monohydrate salt of 1-cyclopropyl-6-fluoro-1, 4-dihydro-4-oxo-7-(1-piperazinyl)-3-quinolinecarboxylic acid. Various analytical methods have been reported for the assay of CIP alone or in combination with other antibacterial agents in pharmaceutical formulations. They include UV spectroscopy4,5, high performance liquid chromatography.6-9 The chemical structure of ciprofloxacin hydrochloride
Literature search reveals that various analytical methods like UV-visible spectrophotometry, HPLC have been reported for estimation of CIP and PHE individually. Literature survey describes that there is no reported method for degradation studies of CIP and PHE combination in various stress condition like alkaline, acidic, oxidative, UV and thermal degradation by RP-HPLC method. Therefore it was thought of interest to study the stability of CIP and PHE in various stress conditions like alkaline, acidic, oxidative, UV and thermal by RP-HPLC method. Because analytical methods must be validated before use by the pharmaceutical industry, the proposed method was validated in accordance with International conference in Harmonization ICH Q2 (R1) guidelines18 by assessing its linearity, accuracy, precision, limit of detection and limit of quantification.
MATERILAS AND METHODS
ApparatusThe chromatography was performed on a RP-HPLC instrument equipped with PDA detector and Zorbax Bonus RP C18 column (250 mm × 4.6 mm, 5μm) was used as stationary phase. Shimadzu-AUX 220 analytical balance, Elico-L1 127 pH meter from Lab India, an ultrasonic cleaner (Frontline FS 4, Mumbai, India), Hot air oven (Lab India), UV stability chamber were used in the study.
Reagents and Materials
Ciprofloxacin hydrochloride and phenylephrine hydrochloride bulk powder were obtained from Cadila healthcare Ltd, Ahmedabad, India. Marketed Product (C-FLOXN Eye drop) was procured from the Calibre pharmaceutical. Label claim of C-FLOXN is ciprofloxacin HCl 0.3% w/v and phenylephrine HCl 0.01% w/v. Acetonitrile, methanol (HPLC grade), orthophosphoric acid (AR grade) were used. Sodium hydroxide, hydrochloric acid, hydrogen peroxide from Merck specialties Pvt Ltd, Mumbai, India were used in the study.
Chromatographic Condition
Separation was achieved by Zorbax Bonus RP C18 column (250mm × 4.6 mm, 5μm) as
stationary phase with water : acetonitrile : triethylamine (85:15:0.1, v/v/v) as a mobile phase and PH of 3.0 adjusted by orthophosphoric acid at a flow rate of 1 ml/min and 10 min run time in isocratic mode. Quantification was achieved of CIP and PHE at 272 nm with PDA detector at 45oC temperature condition and 20 μL injection volume.
Preparation of Stock Solution
Accurately weighed 100 mg of CIP and 100 mg of PHE taken into two different 100 ml volumetric flask and made up volume with water (1000 µg/ml of CIP and PHE).
Preparation of Working Solution
CIP
From stock solution pippeted out 15 ml and diluted up to 100 ml with water (150µg/ml).
PHE
From stock solution pippeted out 1 ml and diluted upto 10 ml with water (100µg/ml). From that pipette out 0.5 ml and diluted up to 10 ml with water (5µg/ml).
Preparation of Calibration Curve
The calibration curves were plotted over a concentration range of 5-30 μg/ml for PHE and 150-900 μg/ml for CIP. Pipetted out 1.5, 3, 4.5, 6, 7.5 and 9 ml from stock solution (1000 μg/ml) of CIP and 0.5, 1, 1.5, 2, 2.5 and 3 ml from stock solution (100 μg/ml) of PHE into 10 ml volumetric flask and made up the volume up to the mark with water to get final concentration range from 150-900 μg/ml respectively for CIP and 5-30 μg/ml respectively for PHE.
Forced Degradation Study
Preparation of solution for acid
degradation
Preparation of solution for basic degradation
Alkali decomposition study was performed by refluxing the working solution of both drugs (1 ml) in 1 ml of 0.1M NaOH for 4 hr at 80 ºC. After 4 hr solution neutralized with 1 ml of same strength of acid and finally made up to 10 ml volume with water, sonicated and filtered through 0.45μm membrane filter paper and injected in to HPLC system.
Preparation of solution for oxidative degradation
Oxidative decomposition study was performed by refluxing the working solution of both drugs (1 ml) in 1 ml 3% H2O2 for 4 hr at 80 ºC. After 4 hr volume made up to 10 ml with water, sonicated and filtered through 0.45μm membrane filter paper and injected into HPLC system.
Preparation of solution for thermal
degradation
Thermal decomposition study was performed by refluxing the working solution of both drugs (1 ml) for 4 hr at 80 ºC. After 4 hr volume made up to 10 ml volume with water, sonicated and filtered through 0.45μm membrane filter paper and injected into HPLC system.
Preparation of solution for UV
degradation
UV degradation was performed by exposing the working solution of both drugs (1 ml) to UV radiation at 254 nm for 2 days. After 2 days volume made up to 10 ml volume with water, sonicated and filtered through 0.45μm membrane filter paper and injected into HPLC system.
METHOD VALIDATION
Linearity and Range
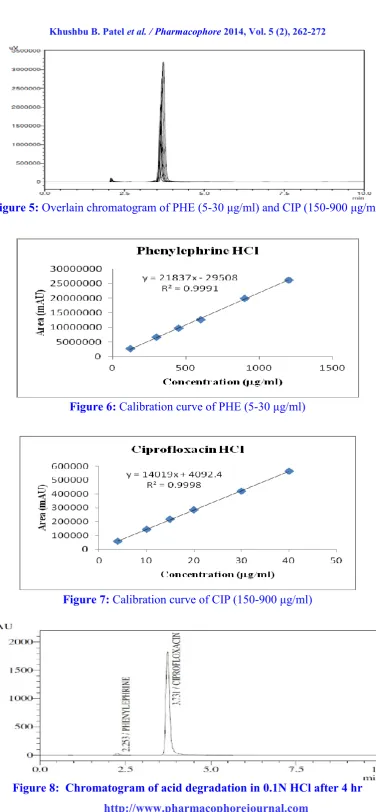
The linearity response was determined by analyzing 6 independent levels of calibration curve in the range of 5-30 μg/ml and 150-900 μg/ml for PHE and CIP respectively. Plot the
calibration curve of area versus respective concentration and find out correlation co-efficient and regression line equation for PHE and CIP (figure 6 and 7).
Precision
Repeatability
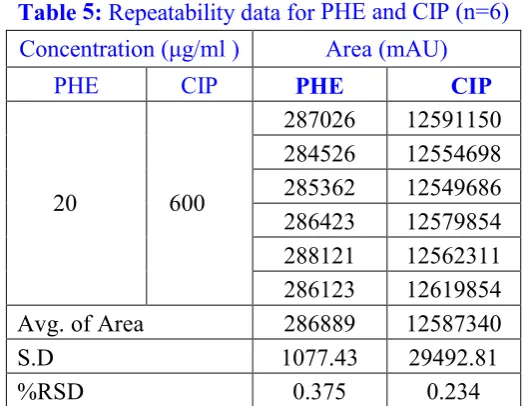
From working solution of PHE and CIP, respectively 2 ml and 6 ml pippeted out and final concentration of PHE (20 μg/ml) and CIP (600 μg/ml) analysed six times in mixture. The areas of six replicate injections were measured and % RSD was calculated.
Intraday precision
From working solution of PHE and CIP, respectively 1.5, 2, 2.5 ml and 4.5, 6, 7.5 ml pippeted out and final concentrations of PHE (15, 20 and 25 μg/ml) and CIP (450, 600 and 750 μg/ml) were analyzed three times on the same day and %RSD was calculated.
Interday precision
From working solution of PHE and CIP, respectively 1.5, 2, 2.5 ml and 4.5, 6, 7.5 ml pippeted out and final concentrations of PHE (15, 20 and 25 μg/ml) and CIP (450, 600 and 750 μg/ml) were analyzed on three different day and %RSD was calculated.
Accuracy
The accuracy of the method was determined by calculating the recoveries of PHE and CIP by the standard addition method. Known amounts of standard solutions of PHE and CIP were at added at 80, 100 and 120 % level to prequantified sample solutions of PHE and CIP (10 and 300 μg/ml respectively). The amounts of PHE and CIP were estimated by applying obtained values to the respective regression line equations, the solution was filtered through 0.45 μ Millipore PVDF filter; filtrate was collected after discarding first few ml. Each sample was prepared in triplicate at each level and injected.
Limit of Detection and Limit of Quantification The limit of detection (LOD) and limit of quantitation (LOQ) of the method were determined by following equations.
LOQ = 10 × σ/S
Robustness
Varying conditions of temperature, pH and mobile phase composition were carried out as per ICH Q2 (R1) guidelines to estimate the effects on the method.
RESULTS AND DISCUSSION
Optimized Chromatogram:Mobile phase
Water: Acetonitrile: Triethylamine (85: 15: 0.1 v/v), pH adjusted to 3.0 with Orthophosphoric acid. Optimized chromatogram is shown in figure 3.
Stability results
The results obtained in acidic degradation, alkaline degradation, oxidative degradation, thermal degradation and UV degradation are depicted as chromatograms and given in figure 8, 9, 10, 11 and 12 respectively.
Specificity
Chromatographic condition of diluent was shown that there is no interference from the diluent (figure 4).
Linearity:
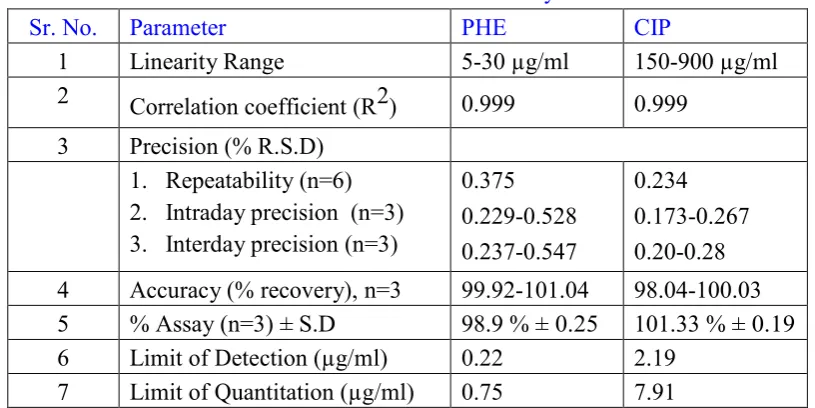
The linearity response was determined by analyzing 6 independent levels of calibration curve in the range of 5-30 μg/ml and 150-900 μg/ml for PHE and CIP respectively. The % RSD was found less than 2. The r2 value was found 0.999 for both the drug (Table 4).
Precision
Repeatability
It was determined by analyzing PHE (20 μg/ml) and CIP (600 μg/ml) six times in mixture. The % RSD was found 0.375 for PHE and 0.234 for CIP (Table 5).
Intraday Precision
For intraday, PHE and CIP in the range of 15-25 µg/ml and 450-750 µg/ml were analyzed three times on the same day. The % RSD was found less than 2 (Table 6).
Interday Precision
For intraday, PHE and CIP in the range of 15-25 µg/ml and 450-750 µg/ml were analyzed on three
different days. The % RSD was found less than 2 (Table 7).
Accuracy
The accuracy of the method was determined by calculating the recoveries of PHE and CIP by the standard addition method at three concentration levels (80, 100 and 120%). The percentage recoveries of PHE and CIP were found to be in the range of 98.04-101.04% (Table 8).
LOD and LOQ
LOD was found to be 0.22 μg/ml and 2.19 μg/ml for PHE and CIP respectively. LOQ was found to be 0.75 μg/ml and 7.91 μg/ml for PHE and CIP respectively (Table 9).
Robustness
Varying conditions of temperature, pH and mobile phase composition were carried out and % RSD was found less than 2% (Table 10).
Applicability of the Method
Applicability of the proposed method was tested by analysing the commercially available Eye drops formulation C-FLOXN (Ciprofloxacin HCl 0.3% and Phenylephrine HCl 0.01%). 1 ml of eye drop solution was taken from 5 ml eye drop formulation and diluted with water upto 10 ml which gives 3000 μg/ml of CIP and 100 μg/ml PHE (Table 11).
CONCLUSION
A simple, accurate and precise stability indicating RP-HPLC assay method was developed for simultaneous estimation of Phenylephrine HCl and Ciprofloxacin HCl in pharmaceutical dosage form. No significant degradation was observed in acidic, basic, UV and thermal condition. Major degradation was observed in oxidative condition. Validation parameters prove that method is repeatable, sensitive and selective for the analysis of Phenylephrine HCl and Ciprofloxacin HCl in formulation. Based on this evidence the method can be stated as highly economical and it is recommended for routine use in quality control laboratories.
The authors are thankful to Cadila HealthCare, Ahmedabad, Gujarat, India for providing a sample for research. The authors are highly thankful to Dr. K. Pundarikakshudu (Principal of
L.J. Institute of Pharmacy, Ahmedabad) who provide me all facilities to complete this project for supporting to carry out the work.
Figure 1: Chemical structure of ciprofloxacin hydrochloride
Figure 2: Chemical structure of phenylephrine hydrochloride
Figure 3: Optimized chromatogram of standard CIP (150 µg/ml) and PHE (5 µg/ml)
Figure 5: Overlain chromatogram of PHE (5-30 μg/ml) and CIP (150-900 μg/ml)
Figure 6: Calibration curve of PHE (5-30 μg/ml)
Figure 7: Calibration curve of CIP (150-900 μg/ml)
Figure 9: Chromatogram of alkali degradation in 0.1N NaOH after 4 hr
Figure 10: Chromatogram of oxidative degradation in 3% H2O2 after 4 hr
Figure 11: Chromatogram of thermal degradation at 0 C after 4 hr
Table 1: System suitability parameters
Parameters CIP PHE
Retention time (min) 3.71±0.092 2.17±0.102 Theoretical plate 7356 6794 Tailing factor 1.73 1.49 Area (µv*sec) 14836037 298907 Resolution 5.1
Table 2: Stability study results of PHE
Conditions Conc. (µg/ml) Time period Peak area % Degradation Before After
Acid degradation 20 4 hr 298907 251192 15.96
Base degradation 20 4 hr 298907 276863 7.38
Oxidative degradation 20 4 hr 298907 277789 7.07 Thermal degradation 20 4 hr 298907 276036 7.69
UV degradation 20 2 day 298907 287868 3.7
Table 3: Stability study results of CIP
Conditions Conc. (µg/ml) Time period Peak area % Degradation Before After
Acid degradation 600 4 hr 14836037 13771294 7.18 Base degradation 600 4 hr 14836037 11728982 20.95 Oxidative degradation 600 4 hr 14836037 11473473 22.67 Thermal degradation 600 4 hr 14836037 14710806 0.85 UV degradation 600 2 day 14836037 12208955 17.71
Table 4: Linearity data of PHE and CIP (n = 3)
Sr. No. Conc. (μg/ml) Mean Area. (mAU) ± S.D. % RSD
PHE CIP PHE CIP PHE CIP
Table 5: Repeatability data for PHE and CIP (n=6) Concentration (μg/ml ) Area (mAU)
PHE CIP PHE CIP
20 600
287026 12591150 284526 12554698 285362 12549686 286423 12579854 288121 12562311 286123 12619854 Avg. of Area 286889 12587340
S.D 1077.43 29492.81
%RSD 0.375 0.234
Table 6: Intraday precision data for PHE and CIP (n=3)
Conc. (μg/ml) Area (mAU) ± S.D. % RSD
PHE CIP PHE CIP PHE CIP
15 450 218417.3±501.54 9771117.6±20793.60 0.229 0.212 20 600 287036±1516.02 12603776±21889.66 0.528 0.173 25 750 422352.3±969.52 19908600.6±53306.03 0.231 0.267
Table 7: Interday precision data for PHE and CIP (n=3)
Conc. (μg/ml) Mean Area (mAU) ± S.D. % RSD
PHE CIP PHE CIP PHE CIP
15 450 218961±519.38 9769784.3±22796.7 0.237 0.233 20 600 287306±1572.80 12600442.6±25278.2 0.547 0.2 25 750 421239.3±1047.5 19905267.3±56997.8 0.248 0.286
Table 8: Accuracy data of PHE and CIP
Sample Concentration level Average area ± S.D % Recovery
PHE
80% 256739 ± 1688.26 99.92 100% 301792 ± 715.19 99.98 120% 355648 ± 1684.16 101.04
CIP
80% 11325896 ± 48937.98 100.03 100% 14201569 ± 58045.13 98.04 120% 17451236 ± 91509.73 99.98
Table 9: LOD and LOQ for PHE and CIP
Parameter PHE CIP
Table 10: Robustness study of PHE and CIP (n=3)
Condition Variation PHE CIP
Mean Area ± S.D. % R.S.D Mean Area ± S.D. % R.S.D
Temp. (45±5°C) 40°C 287372.6±1484.6 0.516 12603109.3±22489.7 0.178 50°C 287409.3±1437.8 0.5 12604409.3±21361.7 0.169 Mobile phase
composition ( 1 ± 0.1 mL/min)
0.9 ml/min 287339.3±1528.2 0.531 12618776±24051.2 0.19 1.1 ml/min 287416±1429.4 0.497 12609776±18453.4 0.146
pH(3.0 ± 0.1) pH 3.1 287372.6±1484.6 0.519 12613109.3±19654.2 0.155 PH 2.9 287359.3±1502.4 0.522 12614109.3±20182.6 0.160
Table 11: Analysis of market formulation (n=3) Eye drops
Formulation
Label claim Amount found (mg) % Assay± S.D C-FLOXN PHE CIP PHE CIP PHE CIP
0.1 mg 3 mg 0.099 3.04 98.9±0.25 101.33±0.1 9
Table 12: Validation summary
Sr. No. Parameter PHE CIP
1 Linearity Range 5-30 µg/ml 150-900µg/ml 2 Correlation coefficient (R2) 0.999 0.999
3 Precision (% R.S.D) 1. Repeatability (n=6) 2. Intraday precision (n=3) 3. Interday precision (n=3)
0.375 0.229-0.528 0.237-0.547
0.234 0.173-0.267 0.20-0.28 4 Accuracy (% recovery), n=3 99.92-101.04 98.04-100.03 5 % Assay (n=3) ± S.D 98.9 % ± 0.25 101.33 % ± 0.19 6 Limit of Detection (µg/ml) 0.22 2.19
7 Limit of Quantitation (µg/ml) 0.75 7.91
REFERENCES
1. Satoskar, RS; Bhandarkar, SD and Ainapure, SS (2003), “Pharmacology and Pharmacotherapeutics”, 18, Popular Prakashan, Mumbai, 1009.
2. Hardman, JG and Limbird, LE (2001), “Goodman and Gilman’s, The Pharmacological Basis of Therapeutics”, 10, McGraw Hill Medical Publishing Division, 1821.
3. Ritter, JM; Lewis, LD; Ferro, A; “A Textbook of Clinical Pharmacology and Therapeutics”, 5, Hodder Arnold Publication, 423-429.
4. Manoranjan, S; Sharda, N and Venkateshwarlu, G (2012), “A New analytical method development and validation for estimation of Ciprofloxacin in bulk and pharmaceutical dosage form”, Asi J. Pharm. Ana, Vol.2(4), 116-117.
6. Wu, S; Chein, C and Wen, Y (2008), “Analysis of Ciprofloxacin by a simple High performance liquid chromatography method”, Journal of Chromatographic Science, Vol. 46, 490-495.
7. Kulsum, S; Reddy, R and Durga, Padmalatha M (2012-13), “A simple and validated RP-HPLC method for the simultaneous estimation of Tinidazole and Ciprofloxacin in bulk and pharmaceutical dosage forms”, International Journal of Research and Development in Pharmacy and Life Sciences, Vol. 2(1), 238-243.
8. Desai, U; Patwari, A; Suhagia, B and Maradiya, J (2013), “RP-HPLC method for simultaneous estimation of Ciproflopxacin and Dexamethasone in Eye/Ear drops”, International Journal of Pharmaceutical Sciences and Drug Research, Vol. 5(2), 62-66.
9. Kassab, N; Singh, A; Kedor-Hackmam, E and Miritello, SM (2005), “Quantitative determination of Ciprofloxacin and Norfloxacin in pharmaceutical praparations by high performance liquid chromatography”, Brazilian Journal of Pharmaceutical Sciences, Vol. 41(4), 507-513.
10.Wagh, R; Hajare, R; Tated, A and Chandewar, A (2011), “Absorption correction method and simultaneous equation method for the simultaneous estimation of Ebastine and Phenylephrine hydrochloride in bulk and in combined tablet dosage form”, International Journal of Research in Pharmacy and Chemistry, 2003, Vol. 1(4), 812-819.
11.Patel, M; Patel, B and Parmar, S (2013), “Simultaneous estimation of Ibuprofen and Phenylephrine hydrochloride in bulk and combined dosage form by first derivative UV spectrophotometry method”, Journal of Spectroscopy, 1-5.
12.Suma, C; Vasantha, K; Reddy, A and Nalluri, B (2013), “Simultaneous estimation of Phenylephrine hydrochloride and Guaifenesin in bulk drug and pharmaceutical dosage forms by RP-HPLC-PDA method”, Journal of Chemical and Pharmaceutical Researc, Vol. 5(8), 188-194.
13.Sanchaniya, P; Mehta, F and Uchadadiya, N (2013), “Development and validation of RP-HPLC method for estimation of Ibuprofen and Phenylephrine hydrochloride in combined pharmaceutical dosage form”, Inventi Journals, 1(5), 10-12.
14.Tuljapure, D; Gowekar, N; Yadav, S and Mogale, A (2014), “Development and validation of RP-HPLC method for simultaneous estimation of Levocetirizine dihydrochloride and Phenylephrine in bulk and in tablet dosage form”, American Journal of PharmTech Research, Vol. 2(4), 1-3.
15.(2010),“Indian Pharmacopoeia”, Government of India Ministry of Health & Family Welfare, The Indian Pharmacopoeia Commission, Ghaziabad, India, 1090-1095, 1899-1900.
16.(2010),“United State Pharmacopoeia 30” National Formulary 25,1755-1760, 2931-2933.
17.(2009), “British Pharmacopoeia”, Published by the stationary office on behalf of Medicines and Healthcare products Regulatory agency, 1381-1385, 4683-4690.
18.(2005), “ICH, Q2 (R1): Validation of Analytical Procedures: Text and Methodology”,
International Conference on Harmonization, IFPMA, Geneva, Switzerland.
Correspondence Author:
Khushbu B. Patel
Department of Quality assurance, L.J. Institute of Pharmacy, Ahmedabad-382 210, India