Pharmacophore 2016, Vol. 7 (6), 458-471 USA CODEN: PHARM7 ISSN 2229-5402
Pharmacophore
(An International Research Journal)
Available online at http://www.pharmacophorejournal.com/
Original Research Paper
FORMULA OPTIMIZATION FOR RAPID DISSOLUTION OF EFAVIRENZ
FROM DOSAGE FORM
Smita Nayak
*, Shivali Singh and Vaidhun Bhaskar
Department of Quality Assurance, Gahlot Institute of Pharmacy, Koparkhairane, Navi
Mumbai-400709, Maharashtra, India
ABSTRACT
The formulation of poorly soluble drug for oral delivery is one of the biggest challenges for formulation scientists. Efavirenz, a non-nucleoside reverse transcriptase inhibitor is used as a part of highly active antiretroviral therapy treatment of a human immunodeficiency virus type I. It exhibits poor dissolution characteristics when administered in conventional oral dosage form with a bioavailability of just 40-45%. The objective of this study is to evaluate the effects of novel excipients such as Soluplus®, dioctyl sulphosuccinate and various superdisintegrants in increasing the dissolution efficiency of Efavirenz. Physical mixtures of Efavirenz with one or more of these excipients was used in different ratios for formula optimization to increase the dissolution rate of Efavirenz. Analytical techniques such as Fourier Transform Infra red spectroscopy (FTIR) and differential scanning calorimetry (DSC) were used to confirm compatibility of efavirenz with the excipients. Preliminary trials along with factorial studies were performed for finalization of formula. Dissolution studies performed revealed improvement in release profile as compared to conventional tablet. Short-term stability studies were performed on the optimized formula. Optimized formulation was subjected to analytical studies to confirm stability of formulation. Evaluation by X-ray diffraction (XRD), DSC and FTIR techniques revealed that the formulation was stable. Techniques such as solid dispersion of drug in solubilizing agent can be tried to bring about further enhancement in extent of drug release.
Keywords:
Contour plots, Design of Experiment, Differential Scanning Calorimetry, Dioctyl sulphosuccinate, Efavirenz, Soluplus®INTRODUCTION
Dissolution of drug from dosage form is the rate determining step for oral absorption and affects the in vivo absorption of drug. Currently only 8-10% of new drug candidates have both high solubility and permeability.1 It is now possible to increase the solubility of poorly soluble drugs with the help of various techniques that have been well documented in literature.1 Efavirenz, which belongs to BCS Class II, is a non-nucleoside reverse transcriptase inhibitor (NNTRI). It is synthetic purine derivative that is used as part of highly active antiretroviral therapy for treatment of a human immunodeficiency virus (HIV) type
I.1, 2 Efavirenz is also used in combination with other antiretroviral agents as part of an expanded post exposure prophylaxis regimen to prevent HIV transmission for materials associated with a high risk for HIV transmission (infected blood and body fluids). For HIV infection that has not been treated, efavirenz and lamivudine in combination with zidovudine or tenofovir is the preferred NNRTI-based regimen.3
of formulations with improved dissolution characteristics.In the present study, polyvinyl caprolactum-polyvinyl acetate-poly ethylene glycol graft copolymer(Soluplus®), an amphiphilic polymer with amphiphilic properties whichshows excellent solubilizing properties for BCS class II substances and offers the possibility of producing solid solutions was used to enhance dissolution of efavirenz from the formulation.4,5 Varying ratios of drug andSoluplus®were mixed and evaluated to deduce the possible interactions, their physical mixtures were also formulated along with other excipients like superdisintegrant, dioctyl sulphosuccinate (DOSS) acting as plasticizer and sodium lauryl sulphate (SLS) and subjected to drug-excipient compatibility studies. The objective of this study was to develop an optimized formulation of efavirenz that could overcome the drawbacks of conventional therapy. The optimized formulation will be subjected to stability studies as per ICH guidelines.3
MATERIALS AND METHODS
Materials
Gift sample of Efavirenz was provided by Lee Pharma (Hyderabad, India). Other excipients were procured as gift samples from BASF India limited and Signet Chemical Corporation Pvt. Ltd. All other chemicals and solvents used were of Analytical grade.8, 9, 10
Analytical Method Development of Efavirenz UV analysis
Various solvents such as 0.1 N HCl, NaOH,
methanol, distilled water were used to dissolve
the drug. Spectrophotometric scanning of the drug was carried out by UV spectrophotometer in the range of 200-400 nm.
Calibration curves
Calibration curve was drawn within the range 6-18µg/ml and coefficient of correlation was estimated.
Drug excipient compatibility studies
The drug was mixed with various excipients in the ratio 1:5 and 10:1 and exposed to 25°C, 40°C temperature, UV light for 24 hrs and observed visually for any physical changes.11
Drug content
Ten tablets were crushed in mortar and 5 mg of powder was transferred to volumetric flask. To the flask, methanol (10 mL) was added and sonicated for 5 minutes. Then volume was made up to 25 ml with distilled water (stock solution). The stock solution was diluted suitably to get a sample having concentration of 10µg/ml. This procedure was repeated six times. The
absorbances were recorded
spectrophotometrically at 247 nm and
concentrations derived using standard equation.12
Dissolution studies
In vitro dissolution study was performed in a USP Type II dissolution test apparatus (Lab India)
using 900 ml of1 % SLS at 37±0.5°C.13 Aliquot
of 5 ml was withdrawn at predetermined time intervals and equal amount of fresh medium was replaced to maintain sink conditions and sample was analyzed at 248 nm spectrophotometrically. The resultant concentration was calculated from standard equation.
Instrumental techniques of evaluation
Fourier-Transform Infrared Spectroscopy (FTIR) Fourier-transform infrared (FTIR) spectrum of Efavirenz and final formulation was obtained using an IR spectrophotometer. The samples were scanned over the wave number range of 4000 to 650 cm–1.
Differential Scanning Calorimetry Studies (DSC) The DSC patterns were recorded by a heat flow method. Efavirenz was heated in crimped aluminum pans with a pierced lid at a scanning
rate of 10 oC/ min in an atmosphere of nitrogen
gas purge (20ml/min). The DSC was calibrated for baseline using empty pans, and for
temperature and enthalpy using indium.14
X-ray Powder Diffraction Analysis (XPRD) The XRPD patterns of solid samples of efavirenz were recorded on X-ray diffractometer. The study was carried out on API as well as on stability samples of formulation to evaluate the
effect of processing parameters on the drug.15
Formulation trials and evaluation of tablets
excipient with reported application in increasing solubility of drug was selected to improve the dissolution rate of efavirenz along with other ingredients like DOSS, superdisintegrant sodium
starch glycolate.17 Wetting agent sodium lauryl
sulphate (SLS) was used intragranularly as well as extragranularly. PVP K30 acted as a binder. The granules were subjected to size reduction and were lubricated with 1% w/w magnesium stearate. Factorial design was applied to optimize tablet formulations while taking intragranular
SLS and Soluplus® as independent variables at
three different levels under investigations as
mentioned in Table1.18 3-D contour plots were
drawn to visualize the impact of changing variables at a glance. Formula of all nine factorial batches is shown in Table 2. Tablets containing equivalent to 50 mg of Efavirenz were prepared by non aqueous granulation method. The granules were then compressed on 8 station rotary compression machine using 11 mm flat faced punch. The formulations were evaluated for physical parameters as per Pharmacopoeial monograph.
In Vitro Drug Release Study
In vitro release test was performed using USP Type II dissolution test apparatus (Lab India) using 900 ml of 1 % SLS at 37±0.5°C, paddle speed –50 rpm. Aliquots of 5 ml were withdrawn at predetermined time intervals, and replaced with an equal volume of the fresh medium to maintain the total volume constant. Samples were filtered through Whatman filter paper no. 41 and assayed by UV spectrophotometry at 248 nm after suitable dilution. The cumulative percentage of drug released from the tablets was calculated and plotted as a function of time. The dissolution profile data was fitted to different kinetic models to determine the best fit model.
Stability Studies
Stability studies were performed according to
ICH guidelines[3]. The effects of temperature,
humidity and time on the physical characteristics and chemical properties of the tablet were evaluated for assessing the stability of the optimized formulations. The different parameters that were studied include dissolution test,
hardness, thickness, friability, drug content as per ICH guidelines.
RESULTS AND DISCUSSION
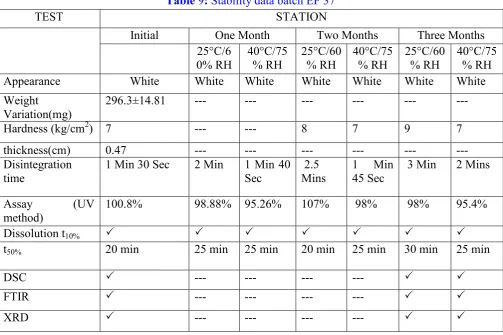
Drug Content
Drug content was evaluated and was found to be in acceptable range indicating suitability of developed method (Table3).
Analytical Method Development of Efavirenz UV analysis
UV spectrometric scanning showed absorption maxima at 247 nm and coincides with value reported in literature. Calibration curve was drawn within range 6-18 μg/ml. Spectra of
efavirenz in distilled water is shown in(Fig.
1).Optical characteristics are reported in Table 4.
Dissolution studies
The dissolution data of formulated tablets is presented in (Fig.2). Conventional tablets (B No. EF13) demonstrated 29.5 % release of efavirenz after 30 min. As against this, tablets containing
physical mixture of efavirenz with Soluplus®
showed statistically significant increase in dissolution over the entire duration of the study. Factorial Batches (EF28-EF36) were superior as compared conventional batch and released around 75% drug in 30 minutes.
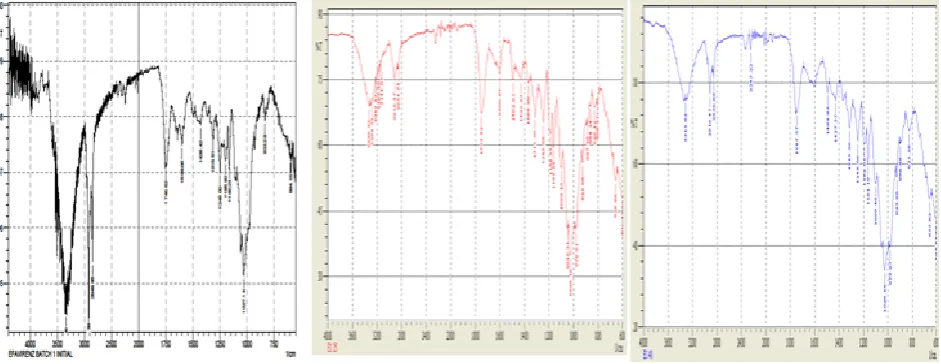
Fourier-transform infrared spectroscopy (FTIR)
The spectra were compared for characteristic peaks of efavirenz molecule and their presence or absence in physical mixture tablets were noted and are depicted in (Fig.3 and 4) respectively. The FTIR spectra of efavirenz and physical mixture of efavirenz and Soluplus®, showed identical peaks indicating that overall symmetry of the molecule was not significantly affected. This indicates that there was no chemical interaction between the drug and the excipients used in efavirenz formulation. Spectra of stability batches after 3 months at accelerated conditions were compared with those of pure drug and initial tablet sample. No change in peaks was seen indicating no change in chemical composition.
DSC has been shown to be a powerful tool in characterization of solid state interactions between drug and polymer. Thermal analysis of Efavirenz by Differential Scanning Calorimetry showed a characteristic sharp endothermic peak at 136.7°C indicating the melting point of the drug. This fact confirmed that the API was pure and crystalline in nature (Fig.5). DSC thermogram of efavirenz-Soluplus® mixture showed a decrease in the glass transition temperature indicating that the drug has undergone transition from crystalline to amorphous state.Overlay of DSC scans of efavirenz with individual excipients confirmed absence of drug-excipient interaction (Fig.6)
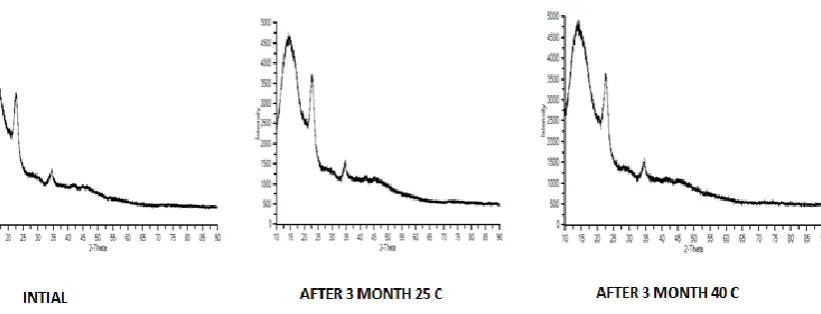
X-ray powder diffraction analysis (XPRD)
XPRD was used to determine the crystallinity of drug in optimized formulation. The XPRD diffractogram of API showed numerous sharp, intense and narrow peaks reflecting high crystallinity. From (Fig. 7) it is observed that peak intensity of optimized formulation batches is lower and fewer number of peaks were seen. This confirms the hypothesis that amorphization of efavirenz has taken place due to processing with Soluplus®.
Optimization and evaluation of efavirenz formulation
Optimization of formula
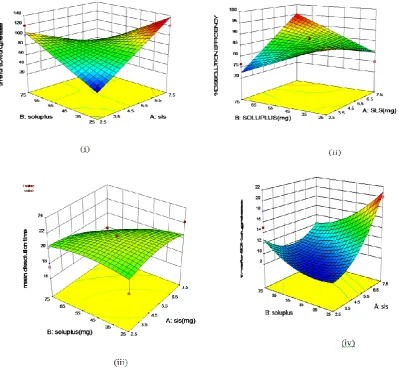
Optimization of formula was done by Design of Experiment (DOE)technique. A full factorial design with two independent variables namely Soluplus® and SLS at three different levelswas drawn. The dependent variables that were evaluated include drug release in 1 hour, time for 50%drug release, time for 90% drug release, dissolution efficiency (DE) and mean dissolution time (MDT). Effect of change in levels of the independent variables was assessed by drawing 3D contour plots. (Fig.8). It was seen that as concentration of Soluplus® increased from 25 mg to 75 mg, with increase in SLS concentration from 2.5 to 7.5 mg, the amount of drug released in 1 hr increased. Thus increase in concentration of both lead to improved dissolution profile. At the same time, minimum time for 50% drug release was seen at Soluplus® concentration of 25 mg and SLS concentration of 5 mg.It is seen that
90% of drug released in minimum time when Soluplus® concentration is 75 mg and extragranular agent SLS 7.5 mg/tab. Thus, highest concentration of both give a release profile that shows minimum time for 90% release of the drug. Also, Dissolution efficiency is highest with lowest concentration of Soluplus® concentration 25 mg and extragranular agent SLS concentration 2.5 mg/tab. It was observed that mean dissolution time was independent of concentration of Soluplus® and SLS. Hence a somewhat flat plot obtained. Three of the batches that showed good release (EF28, EF32 and EF33) were subjected to evaluation by doing similarity and difference tests as per U.S.P (Table5). Based on results of the tests, the three batches do not vary with respect to dissolution profile. However, EF28 has minimum concentration of Soluplus® and SLS (Table 2) and was finalized for scaleup for stability studies. Amongst the different kinetic models applied to dissolution data, Korsmeyer-peppas was found to be the best fit model (Table 6). Also EF28 has highest value of dissolution efficiency justifying its selection as the finalized formula.
Evaluation of optimized formulation of efavirenz
The stability batches were evaluated for precompression and post compression parameters as per Indian Pharmacopoeia 2010 and results are reported in Table 7 and 8. Thus, tablets tested for
weight variation, uniformity of content, hardness and disintegration time showed results within pharmacopeial limits.
Dissolution Data of optimized formulation
In vitro dissolution study of optimized formulation showed faster drug release, with minimum disintegration time, good mechanical strength. Drug release was in compliance with the Pharmacopeia for release obtained within 30 minutes and around 98 % drug was released at the end of 120 min. (Fig9 and 10).
Stability study
as per stability protocol as shown in Table 9 and 10. The blend was evaluated for pre compression parameters as shown in Table 6 and7. In vitro dissolution was within acceptable limit as shown in (Fig.9 and 10). It can be concluded that formulation was stable for three months under conditions of accelerated testing. FTIR, DSC and XPRD scans of stability batches are reported in Fig 11, 12 and 13.
CONCLUSION
In present study, we investigated the possibility of preparing tablets using physical mixtures of Soluplus® and efavirenz with other excipients. Drug-excipient compatibility was assessed by exposing physical mixtures of drug and each excipient to higher temperature and UV light. The samples were evaluated by instrumental techniques such as UV, FT-IR, XRD and DSC. No incompatibility was seen. The release profile of compressed tablets indicates that almost 100% of the drug is released in 2 hours. As the final conclusion, it is obvious that the formulation was able to achieve preset goal of increasing the
solubility of Efavirenz. Since physical mixtures with novel excipient (Soluplus®) improved the solubility, the study can be extended further by preparing solid dispersions of efavirenz with Soluplus®. This will aid in dispersing efavirenz at molecular level, further enhancing rate of dissolution of drug as well as dissolution efficiency. Also there is scope for trying out other dissolution enhancing excipients in the formula. This will help in improving bioavailability without incurring cost of investing in specialized equipment as conventional manufacturing equipment can be used in processing of solid dispersions.
ACKNOWLEDGEMENT
The authors are grateful to Gahlot Institute of Pharmacy for providing valuable insights and premises to carry out experimental work. The authors are thankful to BASF India and LEE Pharma for providing excipients and drug sample respectively. The authors also acknowledge IIT Mumbai for providing facilities to carry XPRD studies.
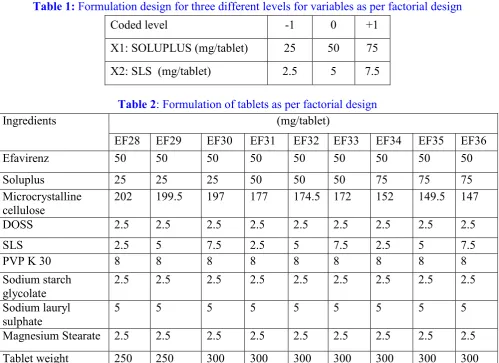
Table 1: Formulation design for three different levels for variables as per factorial design
Coded level -1 0 +1
X1: SOLUPLUS (mg/tablet) 25 50 75
X2: SLS (mg/tablet) 2.5 5 7.5
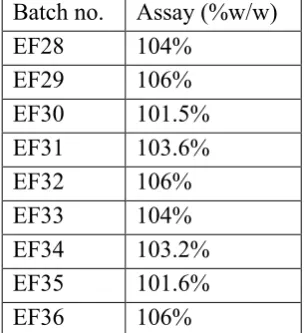
Table 2: Formulation of tablets as per factorial design
Ingredients (mg/tablet)
EF28 EF29 EF30 EF31 EF32 EF33 EF34 EF35 EF36
Efavirenz 50 50 50 50 50 50 50 50 50
Soluplus 25 25 25 50 50 50 75 75 75
Microcrystalline cellulose
202 199.5 197 177 174.5 172 152 149.5 147
DOSS 2.5 2.5 2.5 2.5 2.5 2.5 2.5 2.5 2.5
SLS 2.5 5 7.5 2.5 5 7.5 2.5 5 7.5
PVP K 30 8 8 8 8 8 8 8 8 8
Sodium starch glycolate
2.5 2.5 2.5 2.5 2.5 2.5 2.5 2.5 2.5
Sodium lauryl
sulphate 5 5 5 5 5 5 5 5 5
Magnesium Stearate 2.5 2.5 2.5 2.5 2.5 2.5 2.5 2.5 2.5
Table 3: Drug content of factorial batches
Batch no. Assay (%w/w)
EF28 104%
EF29 106%
EF30 101.5%
EF31 103.6%
EF32 106%
EF33 104%
EF34 103.2%
EF35 101.6%
EF36 106%
Table 4: Optical characteristics of efavirenz
Table 5: Results for similarity and difference factor
Table 6: Fitting of data to kinetic models
Formulation code Zero order 1st order Higuchi Korsmeyer peppas D.E (%) MDT
EF28 0.7272 0.665 0.8478 0.914 91.26 18.48
EF29 0.8327 0.7901 0.9287 0.9755 82.14 20.74
EF30 0.6584 0.5361 0.791 0.8226 75.01 22.19
EF31 0.6506 0.5031 0.7823 0.7909 72.49 23.52
EF32 0.8248 0.7638 0.921 0.9636 87.20 21.033
EF33 0.7659 0.7087 0.8776 0.9284 93.31 16.26
EF34 0.67 0.5807 0.7943 0.8534 76.44 17.59
EF35 0.6266 0.5297 0.758 0.8096 83.66 19.95
EF36 0.6307 0.5445 0.7713 0.8371 91.61 17.87
Parameters Observed values
λmax (nm) 247 nm
Beer’s range (µg/ml) 6-18 µg/ml
Correlation Coefficient (r²) 0.999
Regression equation Y=0.0406x+0.0771
Intercept (a) 0.0771
Slope (b) 0.0406
LOD 3.86
LOQ 11.703
BATCHES SIMILARITY FACTOR(f2) DIFFERENCE FACTOR(f1)
EF28-EF32 58.35% 4.653%
Table 7: Data for pre compression parameters of stability batches
Formulation Code
Bulk density (g/cc)
Tapped density (g/cc)
Compressibility Index
Hausner’s Ratio
Angle of repose(θ)
EF37 0.227 0.263 13.68 1.15 27.52
EF38 0.25 0.277 9.74 1.10 25.87
Table 8: Data for post compression parameters for stability batches
Formulation Code
Assay (%) Weight variation(mg)
Hardness (kg/cm2)
t50%(mins) T90% (mins)
EF37 100.8% 296.3±14.81 7 20 60
EF38 110.4% 297.1±14.85 4 10 30
Table 9: Stability data batch EF 37
TEST STATION
Initial One Month Two Months Three Months
25°C/6 0% RH
40°C/75 % RH
25°C/60 % RH
40°C/75 % RH
25°C/60 % RH
40°C/75 % RH
Appearance White White White White White White White
Weight Variation(mg)
296.3±14.81 --- --- --- --- --- ---
Hardness (kg/cm2) 7 --- --- 8 7 9 7
thickness(cm) 0.47 --- --- --- --- --- ---
Disintegration time
1 Min 30 Sec 2 Min 1 Min 40 Sec
2.5 Mins
1 Min 45 Sec
3 Min 2 Mins
Assay (UV
method)
100.8% 98.88% 95.26% 107% 98% 98% 95.4%
Dissolution t10%
t50% 20 min 25 min 25 min 20 min 25 min 30 min 25 min
DSC --- --- --- ---
FTIR --- --- --- ---
Table10: Stability data batch EF 38
TEST STATION
Initial One Month Two Months Three Months
25°C/60 % RH
40°C/75 %RH
25°C/60 % RH
40°C/75 % RH
25°C/60 % RH
40°C/75 % RH
Appearance White White White White White White White
Weight
Variation (mg)
297.1±14. 85
--- --- --- --- --- ---
Hardness 4 --- --- 6 5 7 4
thickness(cm) 0.47 --- --- --- --- --- ---
Disintegration
time 1 Min 30 Sec 2 Min 1 Min 40 Sec 2 Mins 1 Min 50 Secs 3 Mins 30 Secs 2 Mins
Assay (UV
method) 110% 93% 105.6% 94.4% 103% 110.8% 108%
Dissolution t10%
t50% 10 mins 20 mins 10 mins 20 mins 10 mins 30 mins 10 mins
DSC --- --- --- ---
FTIR --- --- --- ---
XRD --- --- --- ---
Figure 2:Dissolution profile for comparison of conventional and factorial batches (Physical mixtures with Soluplus®) EF13-Conventional batch; EF28-36: Factorial batch
Figure 3: FTIR spectrum of pure drug efavirenz
N-H stretching-3309.85 C=O stretching-1745.8
Figure 4: FTIR spectrum of efavirenz tablet (EF 37)
C=O-147.57
Temp Cel 200.0 250.0 300.0 150.0
100.0 50.0
DS
C m
W
20.00
10.00
0.00
-10.00
-20.00
-30.00
-40.00
DD
SC
m
W/
mi
n
136.7Cel -21.62mW OVERLAY: EFAVIRENZ
135.3Cel 5.47mW
208.5Cel -25.91mW 131.4Cel
-7.51mW 257.1Cel-7.78mW
101.7Cel -15.61mW
137.9Cel -29.51mW
Figure 5: DSC scan for pure drug efavirenz
B-40 DRUG+ M.C.C DSC B-40 DRUG+ Mgs DSC B-40 DRUG+ S.S.G DSC B-40 DRUG+ SLS DSC B-40 DRUG+CROSS DSC
Figure 6:Overlay of DSC scan for drug with all excipient
Figure 7 : XRD scan of efavirenz
Temp Cel
300.0 250.0
200.0 150.0
100.0 50.0
DS
C
mW
5.00 0.00 -5.00 -10.00 -15.00 -20.00 -25.00
DD
SC
m
W/
mi
n
136.7Cel -21.62mW 126.7Cel -0.24mW141.8Cel-0.56mW
268.1Cel 1.82mW SAMPLE: 8
Figure 8 : 3D contour plots for factorial batches for selection of best optimized formula
Schematic representation of 3Dcontour plots for (i)time for 90% dissolution, (ii) dissolution efficiency, (iii) mean dissolution time and (iv) time 50% release of drug.
Figure 10: Dissolution data for final formulation along with release for stability batch 38
Figure 11: DSC scans for stability batch (EF 37)
Figure 13: XPRD scans for stability batch (EF 37)
REFERENCES
1. Satish, KP; Kalpesh, SW; Venkatesh, BP; Anup, MA and Dheeraj, TB (2011),“Strategies for solubility enhancement of poorly soluble drugs”, Int. J. Pharm. Sci. Rev. Res, Vol. 8(2), 74-80. 2. Anonymous (2010), “Indian Pharmacopoeia”, The Indian Pharmacopoeia Commission,
Ghaziabad, 1269-72.
3. Crowley, M; Zang, F and Kolang, J (2002), “Stability of polyethelene oxide in matrix tablets prepared by hot melt extrusion”, Biomaterials, Vol.23, 4241-4248.
4. Sean, Sweetman, C (2011). Editor, “Martindale: The Complete DrugReference,”37th edition, London, England, UK:Pharmaceutical Press, 963-64.
5. "Guidelines for the Use of Antiretroviral Agents in HIV-1-Infected Adults and Adolescents". AIDS info. NIH. Gov. in.
6. Khoo, S.M; Porter, C.H and Charman, W. N (2000),“The formulation of halofantrine as either rnonsolubilisingPEG 6000 or solubilising lipid based solid dispersions: physical stability and absolute bioavailabilityassessment”,Int.JPharm,Vol.205, 65-78.
7. Hasdung, H; Djuric, D and Ali, S (2010), “Combining HME and Solubilization: Soluplus®- the solid solution”, Drug Del. Tech, Vol. 10(3), 20-27.
8. Pradeep, K; Amit, K and Kumar, N (2013),“Development of New UV Spectroscopic Method for the Estimation of Efavirenz in Bulk and Solid Dosage Forms”, Int. J. Pharm. Sci, Vol. 2 (2), 858-860. 9. Anonymous (2004), “The United States Pharmacopoeia-National Formulary,” General Chapter/
1225>Validation of Compendial Methods,Vol. 27 (22), 2622-2625.
10.Siladitya, B;Subhajit, G; Fahad, A; Saayak, S and Sritoma, B (2012),“UV-VisibleSpectrophotometric Method Development and Validation of Assay of Paracetamol TabletFormulation,”J. Anal. Bioanal. Tech, Vol. 3 (6), 1-6.
11.http://lab-training.com/landing/role-of-preformulation-studies-in-drug-development, Accessed July 2015.
12.Anonymous (2010), “Indian Pharmacopoeia”, The Indian Pharmacopoeia Commission, Ghaziabad, 192-193.
13.Sridhar, B;Danna, K, Guguloth, B, Ramavath, R.and Puttireddy, M. S (2014),“Development and In-Vitro Evaluation of Immediate Release Tablets Of Efavirenz,”Int.J. Pharm. Bio. Chem. Sci,Vol. 3 (3), 56- 65.
15.Anthony L and Young (2012), “Powder X-ray Diffraction and its Application to Biotherapeutic Formulation Development,” The Review of American pharmaceutical business & technology,
Pfizer.
16.Basf, The Chemical Company, Soluplus, Technical Information, (2010).
17.Sridhar, B; Darna, Vijay, K; Guguloth, B; Ramavath, Redya, N; Puttireddy and Malathy, S (2014), “Development and In-Vitro Evaluation of Immediate Release Tablets Of Efavirenz,”Int. J. Pharm.
Bio. Chem. Sci, Vol. 3 (3), 56- 65.
18. Ravi,S.K; Chowdary, K and Sambasiva, R(2015),“Optimization of Efavirenz tablet formulation employing β CD and Soluplus® by 22 factorial Design,” World.J. Pharm. Res, Vol. 4(6), 2018-2026.
Cite This Article:
Smita, Nayak; Shivali, Singh and Vaidhun, Bhaskar (2016), “Formula optimizationfor rapid dissolution of efavirenz from dosage form”, Pharmacophore, Vol. 7 (6), 458-471.
Correspondence Author:
Smita Nayak