Annealing Texture and Microstructure Evolution in Titanium
during Grain Growth in an External Magnetic Field
Dmitri A. Molodov, Christian Bollmann, Peter J. Konijnenberg,
Luis A. Barrales-Mora and Volker Mohles
Institute of Physical Metallurgy and Metal Physics, RWTH Aachen University, D-52056 Aachen, Germany
The impact of a magnetic field (17T) on texture and microstructure evolution in cold rolled (75%) commercially pure titanium was investigated. The specifically oriented titanium sheet specimens were heat treated at 1023 K in a magnetic field of 17 T for 60, 120, 180 and 240 minutes. X-ray diffraction and EBSD measurements were utilized to characterize the crystallographic texture and the grain microstructure. The magnetic annealing resulted in an asymmetry of the two major texture components that constantly increased with annealing time. This effect is attributed to a magnetic driving force for grain growth arising from the anisotropic magnetic susceptibility of titanium. Complementary computer simulations of 2D grain growth were employed to analyze the effect of a magnetic field on texture and microstruture evolution. EBSD measurements as well as the computer simulations revealed that a magnetic field affects the grain growth kinetics. Grains with energetically preferred orientations grow faster and their fraction becomes larger than the fraction of more slowly growing grains with disfavored orientations. [doi:10.2320/matertrans.MI200701]
(Received April 23, 2007; Accepted July 19, 2007; Published September 5, 2007)
Keywords: grain growth, magnetic annealing, titanium, magnetic anisotropy
1. Introduction
The mean grain size as well as the grain growth texture, i.e. the resulting orientation distribution of the grains, determines to a great extent the physical and mechanical properties of polycrystals. Important changes of the grain microstructure and texture of crystalline solids are introduced in the course of recrystallization and grain growth during a heat treatment following plastic deformation.
Grain growth proceeds by the motion of grain boundaries. As was shown theoretically1,2)and proved by experiment,3–6)
the rate of boundary migrationvis proportional to the acting driving forcep
v¼mp; ð1Þ
wheremis referred to as the grain boundary mobility. Polycrystals are always liable to grain growth owing to a driving force arising from the curvature of the grain boundaries. This driving force is caused by the free energy of the boundary itself since grain boundary motion towards its center of curvature leads to a reduction of grain boundary area. Each boundary segment with the energyand the local curvatureexperiences a force per unit area
pbc¼ ð2Þ
When a magnetically anisotropic crystalline solid with susceptibility1is exposed to a uniform magnetic field an additional magnetic driving force pb
marises owing to the
difference of the magnetic energy density ! in adjacent grains7)
pbm¼!1!2 ¼
0H2
2 ð12Þ
¼1
20H
2ðcos2
1cos22Þ; ð3Þ
where0 is the magnetic constant,His the magnetic field strength, 1 and 2 are the magnetic susceptibilities of adjacent grains 1 and 2 along the field direction,is the
difference of the susceptibilities parallel k and
perpendic-ular?to the principal (orc) axis of the crystal,1and2are the angles between thec-axes in both neighboring grains and the magnetic field direction. In contrast to the curvature driving force, the magnetic one does not depend on the boundary properties, i.e. on its energy and shape, but is determined by the magnetic anisotropy of the material (), the strength of the applied magnetic field and its orientation with respect to the two grains.
An effective magnetic driving force for each grain in a polycrystal can be expressed as the difference between the magnetic free energy density of this grain!and an average magnetic free energy density!!of its neighboring grains that according to eq. (3) can be written as
pm¼!!!¼ 0H2
2
1 n
Xn
j j
!
¼1
20H
2 cos2
Xn
j cos2j
n
0 B @
1 C A
ð4Þ
whereandjare the angles between the field direction and principal axes of the considered grain and itsnneighboring grains. For instance, if >0 and for the grain and its surrounding the condition cos21=nPn
j cos
2
j<0 is
completed, the magnetic energy density in this grain is lower than the average energy density of the adjacent grains (! <!!) and the magnetic driving force (pm<0) favors the
growth of this grain. Thus for each grain in the polycrystal depending on particular grain orientation with regard to its nearest neighbors and field direction, the magnetic force can act on its boundaries both with and against the curvature forces.
The orientation dependence of the magnetic driving force provides an opportunity to influence and, therefore, to control development of the grain orientation distribution in a polycrystal, i.e. crystallographic texture during grain growth, by means of magnetic annealing. Experimentally this was Special Issue on Structural and Functional Control of Materials through Solid-Solid Phase Transformations in High Magnetic Fields
first demonstrated for grain growth in diamagnetic zinc.8)
More recent experiments revealed that texture development in paramagnetic titanium can also be substantially affected by annealing in a high magnetic field.9,10)In the current study
further experimental and computational investigations into the magnetically affected microstructure evolution during grain growth in titanium were conducted.
2. Applied Methods
2.1 Specimens and magnetic annealing
Commercially pure (cp) titanium with a chemical compo-sition and an initial microstructure given in Ref. 9) was used in the experiment. A sheet (4.4 mm in thickness) of this material was rolled at room temperature to a final thickness of 1.1 mm, equivalent to a reduction of 75%. The cold rolled specimens were annealed at 1023 K in a magnetic field of 17 T for 60, 120, 180 and 240 minutes. Prior to the application of the magnetic field all specimens were annealed for 15 min at 1023 K to allow for complete recrystallization and to make sure that the application of a magnetic field occurred at an advanced stage of conventional grain growth. Reference specimens were annealed at the same temperature for the same time without any magnetic field. Also, some specimens were annealed for 15 min at 1023 K at zero field to characterize the microstructure of the specimens just prior to the application of the magnetic field. To avoid an oxidation, the specimens were encapsulated in a vacuum of2105Pa in quartz tubes before annealing. A platinum resistance temperature detector placed outside the tube in close vicinity to the specimens was utilized for temperature control.
In order to affect the texture and microstructure evolution by a magnetic field, the specimens were oriented during magnetic annealing as shown in Fig. 1. The rolling direction was oriented perpendicular to the field, whereas the trans-verse direction was tilted around the rolling direction by 32
with respect to the field direction. A tilt angle of 32 makes one of the two texture components to have the c-axis perpendicular to the field direction.9)
The experiments were carried out using a direct current resistive 20 T Bitter magnet with a 195 mm bore diameter at the National High Magnetic Field Laboratory in Tallahassee, Florida, USA.
2.2 Texture measurements and grain microstructure
characterization
Texture and microstructure were characterized by X-ray diffraction and orientation imaging microscopy (EBSD with HKL Channel 5 software in a FEG-SEM). The orientation distribution functions (ODFs) were determined from a set of six incomplete pole figuresf0002g,f10110g,f11220g,f10111g,
f10112gandf10113gmeasured with Co Kradiation by means
of a fully automated texture goniometer in back reflection mode. The ODFs were computed by using the series expansion method with positivity criterion.11,12)The sample symmetry was regarded triclinic to account for asymmetric textures after annealing in the magnetic field. Details concerning the sample preparation for macrotexture meas-urements are given elsewhere.9) The samples for EBSD
measurements were additionally electrolytically polished in a solution of 300 ml CH3OH, 180 ml C6H14O2, 30 ml HClO4 and 1 ml Vogel-Sparbeize (proprietary product of Buehler company).
2.3 2D modeling of grain growth
We employed complementary computer simulations of 2D grain growth to analyze the effect of a magnetic field on texture and microstruture evolution in titanium. The simu-lation algorithm is based on vertex and front-tracking models which are most appropriate for curvature driven grain growth.13–16) The grain structure in this algorithm is repre-sented by differently oriented grains, separated by boundaries that intersect at triple junctions (real vertices). The grain boundaries in turn consist of points (virtual vertices) along the boundary length according to the boundary curvature.17)
During grain growth without an external field all virtual vertices move under the local curvature driving force p¼
pc¼perpendicular to the boundary. In the presence of a
magnetic field the kinetic equation of boundary motionv¼ mbp is solved for all virtual vertices with a driving forcep
equal to the sum of curvature and magnetic driving forces
p¼pcþpm, where pmis calculated according to eq. (3).17)
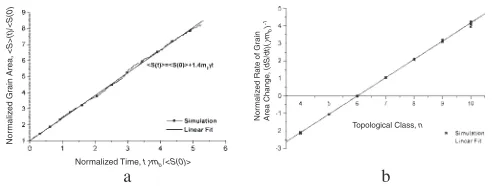
Figure 2 depicts the simulated grain size evolution of a 2D polycrystal at zero field, i.e. under a pure curvature driving force. Figure 2(a) shows the computed time dependence of the normalized mean grain area. The mean grain area is seen to increase linearly with annealing time (Fig. 2(a)). This
TD RD
32°
90°
H
ND
Fig. 1 Orientation of specimens during magnetic annealing with respect to the field direction H. The rolling direction (RD) is oriented normal to the magnetic field; the transverse direction (TD) is tilted by 32about RD to
have in one of the two texture components thec-axis perpendicular to the field direction.
Nor
maliz
ed Gr
ain Area,
<S>(t)/<S(0)
Normalized Time, tγmb/<S(0)>
Topological Class, n
Nor
m
aliz
ed Rate of Gr
ain
Area Change
,
(dS/dt)(
γ
mb
)
-1
a b
[image:2.595.304.550.71.164.2] [image:2.595.121.218.74.249.2]behavior is characteristic for curvature driven normal grain growth in homogeneous systems (constant grain boundary energy and mobility). Furthermore, it was assessed whether the model reproduces the topological microstructure evolu-tion according to the von Neumann-Mullins relaevolu-tion,18)
which connects the rate of grain area change dS=dt to the topological class n of a grain (Fig. 2(b)). The agreement between the classical relation18)
dS
dt ¼
mb
3 ðn6Þ 1:047mbðn6Þ ð5Þ
and the linear fit of the simulated results dS=dt¼ 1:044mbðn6:0029Þis excellent. The results convincingly demonstrate the capability of the used simulation model to study grain growth in homogeneous 2D systems.
3. Magnetically Affected Texture and Grain Structure
Evolution
3.1 Texture evolution during grain growth in magnetic
field
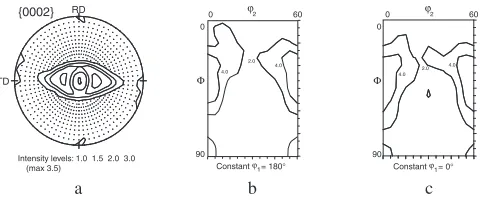
The cold-rolling texture with two symmetrical peaks in the (0002) pole figure (Fig. 3) measured after 75% reduction is very similar to those already reported in literature for low alloyed titanium.19,20)As seen in the’
1¼0and’1 ¼180 ODF sections (Figs. 3(b), (c)), two major ODF peaks are widely spread around the orientations (’1,,’2) = {(0,35,0) and (180,35,0)} in Euler space.
The grain growth texture after 15 min and subsequent 60 min annealing at 750 is characterized by the highest ODF density at (0,35,30) and (180,35,30) (Fig. 4). The ODF sections ’1¼0 and ’1¼180 depict, however, that the ODF density remains high in the entire angular range of’2. It is worth noting that a similar texture was also measured for the reference specimen annealed at 1023 K for 15 min.
With the progressing grain growth at 1023 K (120 and 180 min) the (0002) pole figure remains nearly symmetrical (Fig. 5 and 6) with the major ODF peaks shifted towards (0,35,40) and (180,35,40).
The application of a magnetic field of 17 T after 15 min conventional annealing dramatically affects the texture evolution during grain growth. As also observed in our previous experiments,9)the peaks in the (0002) pole figures do not remain symmetrical anymore. After magnetic anneal-ing for 60 min the ODF intensity at (180,35,30) exceeds the corresponding intensity after annealing at zero field by a factor of 1.34, whereas the intensity at (0,35,30) decreases to
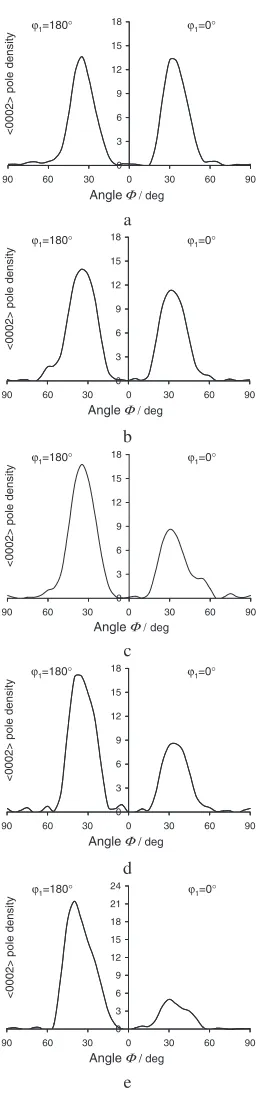
about 65% of the zero field intensity. The texture asymmetry continuously increases with annealing time. After magnetic annealing for 240 min the intensity ratio of both major ODF peaks amounts to 3.5 (Fig. 7). However, since a magnetic field affects the intensity of all orientations with ’1 ¼0/ 180 and ¼35 in the entire interval of ’
2, a more appropriate way to reveal the magnetically induced texture anisotropy and its increase with annealing time is to compare the (0002) pole density of both major peaks centered around (0,35,’2) and (180,35,’2) (Fig. 8).
The development of an asymmetrical texture during magnetic annealing is obviously caused by the additional magnetic driving force during grain growth. During magnetic annealing the specimens were oriented in such a manner that thec-axes of the grains which compose a texture peak around the orientations (180,35,’2) were aligned perpendicular to the field direction. With the difference in magnetic suscepti-bility parallel and perpendicular to the c-axis >0 for
Intensity levels: 1.0 1.5 2.0 3.0 (max 3.5)
RD
TD
{0002} 0 ϕ2 60
Constant ϕ1= 180°
Φ 0 90 4.0 2.0 4.0 ϕ2 0 60
Constant ϕ1= 0°
Φ 0 90 4.0 2.0 4.0
a b c
Fig. 3 Texture of investigated titanium after 75% reduction by rolling: (a) (0002) pole figure, ODF sections at (b)’1¼180and (c)’1¼0.
Intensity levels: 1.0 3.0 6.0 9.0 (max 13.6) 12.0
RD
TD
{0002} 0 ϕ2 60
Constant ϕ1= 180°
Φ 0 90 4.0 2.0 7.0 12.0 ϕ2 0 60
Constant ϕ1= 0°
Φ 0 90 4.0 2.0 7.0 12.0
Intensity levels: 1.0 3.0 6.0 9.0 (max 14.0) 12.0
RD
TD
{0002} 0 ϕ2 60
Constant ϕ1= 180°
Φ 0 90 4.0 2.0 7.0 12.0 20.0 ϕ2 0 60
Constant ϕ1= 0°
Φ 0 90 4.0 2.0 7.0 12.0
a b c
Fig. 4 (a) (0002) pole figures and ODF sections at (b)’1¼180and (c) ’1¼0for specimens annealed at 1023 K for 75 min (top) and for 15 min
at zero field plus 60 min in a magnetic field of 17 T (bottom).
Intensity levels: 1.0 3.0 6.0 9.0 (max 12.9) 12.0
RD
TD
{0002} 0 ϕ2 60
Constant ϕ1= 180°
Φ 0 90 4.0 2.0 7.0 12.0 12.0 ϕ2 0 60
Constant ϕ1= 0°
Φ 0 90 4.0 2.0 7.0 12.0
Intensity levels: 1.0 3.0 6.0 9.0 (max 16.8) 12.0 15.0
RD
TD
{0002} 0 ϕ2 60
Constant ϕ1= 180° Φ 0 90 4.0 2.0 7.0 12.0 20.0 ϕ2 0 60
Constant ϕ1= 0°
Φ 0 90 4.0 2.0 7.0 12.0
a b c
Fig. 5 (a) (0002) pole figures and ODF sections at (b)’1¼180and (c) ’1¼0for specimens annealed at 1023 K for 135 min (top) and for 15 min
[image:3.595.50.290.73.173.2] [image:3.595.306.549.73.258.2] [image:3.595.308.548.325.508.2]titanium, the magnetic free energy density of these grains attains a minimum that results in an additional driving force for their growth (pm<0).
As seen in Fig. 8, an increase of the (180,35,’2) peak intensity during magnetic annealing corresponds to a de-crease of the intensity of the (0,35,’2) peak. This means that on average grains close to the energetically favorable orientations (180,35,’2) (pm<0) grow at the expense of
grains close to (0,35,’2), whose free energy is increased in a magnetic field by the amountpm>0(eq. (3)). Accordingly,
[image:4.595.362.492.65.612.2]grains with the (180,35,’2) orientations can be expected to grow significantly larger than grains comprising the other peak.
Figure 9 shows the texture development in a 2D-poly-crystal as obtained by computer simulations of 2D grain growth. These simulations made use of the actual exper-imental conditions. The initial microstructure and texture was reconstructed from individual orientation data (EBSD map-ping) measured on a Ti specimen annealed for 15 min at 1023 K (Table 1). Grain boundary energy and mobility were assumed to be uniform. The magnetic energy density was computed for each grain and the condition that the magnetic field was applied perpendicular to the rolling direction of the specimen and inclined 32 from the transverse direction, as indicated by a cross in the pole figure in Fig. 9(c). Therefore,
depending on their surroundings, grains close to (180,
35,’
2) will experience an additional force to grow (pm<0),
since their c-axes are aligned nearly normal to the field direction and thus, contain the smallest magnetic energy density.
The results of simulations quantitatively agree with experimental observations. After annealing at zero field the simulated texture remains symmetrical (Fig. 9(b)), whereas after magnetic annealing the (180,35,’2) texture peak with
Intensity levels: 1.0 3.0 6.0 9.0 (max 11.9)
RD
TD
{0002} 0 ϕ2 60
Constantϕ1= 180°
Φ
0
90
4.0 2.0
7.0 12.0 12.0
ϕ2
0 60
Constantϕ1= 0°
Φ
0
90
4.0 2.0 7.0
12.0
Intensity levels: 1.0 3.0 6.0 9.0 (max 17.6) 12.0 15.0 17.0
RD
TD
{0002} 0 ϕ2 60
Constantϕ1= 180°
Φ
0
90
4.0 2.0
7.0 12.0 20.0
ϕ2
0 60
Constantϕ1= 0°
Φ
0
90
4.0 2.0 7.0 12.0
a b c
Fig. 6 (a) (0002) pole figures and ODF sections at (b)’1¼180and (c) ’1¼0for specimens annealed at 1023 K for 195 min (top) and for 15 min
at zero field plus 180 min in a magnetic field of 17 T (bottom).
Intensity levels: 1.0 3.0 6.0 9.0 12.0 (max 21.4) 15.0 18.0 21.0
RD
TD
{0002} 0 ϕ2 60
Constantϕ1= 180° Φ
0
90
4.0 2.0 7.0 12.020.0
30.0
ϕ2
0 60
Constantϕ1= 0°
Φ
0
90
4.0 2.0
7.0
a b c
Fig. 7 (a) (0002) pole figures and ODF sections at (b)’1¼180and (c) ’1¼0for specimens annealed at 1023 K for 15 min at zero field and
240 min in a magnetic field of 17 T.
0 3 6 9 12 15 18
90 60 30 0 30 60 90
AngleΦ/ deg
<0002> pole density
ϕ1=180° ϕ1=0°
a
0 3 6 9 12 15 18
90 60 30 0 30 60 90
AngleΦ/ deg
<0002> pole density
ϕ1=180° ϕ1=0°
b
0 3 6 9 12 15 18
90 60 30 0 30 60 90
Angle Φ/ deg
<0002> pole density
ϕ1=180° ϕ1=0°
c
0 3 6 9 12 15 18
90 60 30 0 30 60 90
Angle Φ/ deg
<0002> pole density
ϕ1=180° ϕ1=0°
d
0 3 6 9 12 15 18 21 24
90 60 30 0 30 60 90
AngleΦ/ deg
<0002> pole density
ϕ1=180° ϕ1=0°
e
[image:4.595.50.295.74.258.2] [image:4.595.52.292.329.426.2]c-axes perpendicular to the field becomes much stronger than the other peak (Fig. 9(c)).
The ability of a magnetic field to produce preferred orientations in a polycrystal during grain growth is perfectly captured by computer simulations, where a magnetic field was applied to a 2D polycrystal with initially random orientation distribution (Fig. 10(a)). The initial grain micro-structure for these simulations was generated by means of Voronoi tesselation and consisted of 20000 grains with normally distributed grain size. To prove that the produced texture was caused exclusively by the magnetic field, the simulations were performed for two different specimen orientations. First, the magnetic field was applied parallel to
the sheet normal (ND). In this case grains withc-axis parallel to the (’1,90,’2) orientations (i.e. withc-axes perpendicular to ND) possess a minimum magnetic free energy and therefore experience an additional driving force for their growth (pm<0). This results in a texture with maximum
(0002) pole intensity at (’1,90,’2) and minimum at (’1,0,’2) (Fig. 10(b)). Second, a magnetic field was directed parallel to the rolling direction (RD). Correspondingly, a maximum magnetic energy was generated in grains with the c-axis aligned along (90,90,’2) (i.e. RD), and the magnetic driving force promoted their shrinkage (pm>0), whereas in grains
with the c-axis perpendicular to RD (i.e. aligned along (0/ 180,,’2)) this force favored their expansion (pm<0). As a
consequence, a texture with a maximum intensity at (0/ 180,,’2) developed (Fig. 10(c)). The simulations substan-tiate that the texture evolution during grain growth in a magnetic field of magnetically anisotropic titanium is due to an additional orientation dependent magnetic driving force.
3.2 Grain microstructure development during grain
growth in a magnetic field
The magnitude of the texture peaks obtained by X-ray diffraction is determined by the total area of grains having a respective orientation. Macrotexture measurements therefore do not render information on the grain microstructure with respect to grain size and number of grains making up different texture components. This information can, however, be obtained by orientation imaging with EBSD. Since the
a b c
[image:5.595.48.290.66.176.2]Fig. 9 (a) (0002) pole figure of a 75%-rolled Ti sheet sample after annealing at 1023 K for 15 min; (b) and (c) - simulated pole figures after subsequent 10 min annealing for a 2D Ti-polycrystal without field (b) and in a magnetic field of 17 T (c) (field direction is indicated by a white cross).
Table 1 Mean grain size, number of grains and fraction of different grain subsets as obtained by orientation microscopy (EBSD in a SEM).
Time Field Total number of
grains Subset
Mean grain size,
mm
Number of grains
Grain fraction
both 39 8207 0,98
15 min 0 T 8648 {0,35,8’
2} 39 4321 0,50
{180,35,8’
2} 40 3981 0,46
both 83 6371 0,98
(15)
0 T 6532 {0,35,8’
2} 82 3276 0,50
+ {180
,35,8’
2} 83 3095 0,48
60 min both 87 5619 0,98
17 T 5919 {0,35,8’
2} 85 2598 0,44
{180,35,’
2} 88 3021 0,54
both 103 4268 0,98
(15)
0 T 4407 {0,35,8’
2} 104 2328 0,54
+ {180
,35,8’
2} 102 1940 0,43
120 min both 109 3337 0,98
17 T 3539 {0,35,8’
2} 102 1369 0,34
{180,35,8’
2} 116 1968 0,64
both 118 2898 0,98
(15)
0 T 3026 {0,35,8’
2} 117 1704 0,57
+ {180
,35,8’
2} 118 1194 0,41
180 min both 126 2447 0,99
17 T 2569 {0,35,8’
2} 116 992 0,33
{180,35,8’
2} 135 1455 0,66
(15) both 139 1850 0,98
+ 17 T 1976 {0,35,8’
2} 126 593 0,24
240 min {180,35,8’
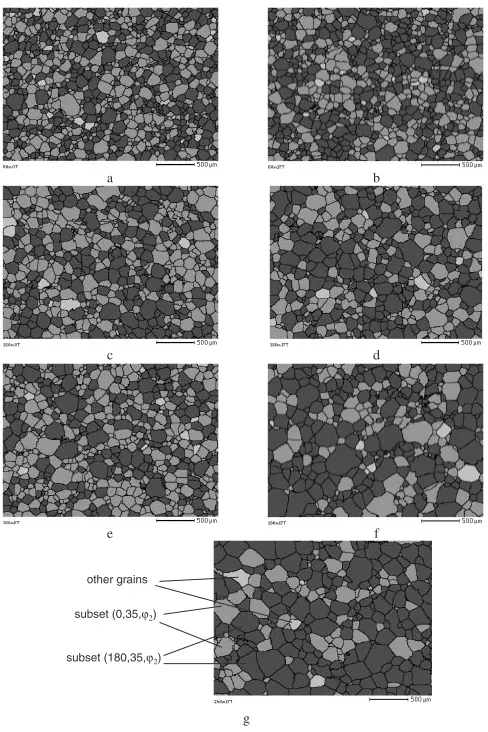
[image:5.595.49.548.456.784.2]observed textures in the current experiments were charac-terized by a high ODF density at the (0/180,35,’2), it is reasonable to subdivide the whole set of grains into two subsets with orientations around (0,35,’2) and (180,35,’2). These two subsets represent the two texture peaks in the (0002) pole figures in Figs. 4–8. For an assignment of the grains to one of the two subsets a cut-off radius of 35 per
subset was applied. An overlapping of subsets was avoided by the restrictive condition that each orientation can belong to only one, the nearest, subset. The result is given in Table 1 and Fig. 11. Since the observed texture is rather sharp a threshold grain misorientation of 3 was used to delimitate
different grains.
The results reveal that the overall growth kinetics of all grains (Fig. 12), are enhanced by a magnetic field. In the entire investigated annealing time interval the mean grain size after magnetic annealing was found to be slightly but distinctly larger than after annealing at zero field. In both cases the growth kinetics follows a relationd¼ktn, whered
and t denote the mean grain size and the annealing time, respectively. The magnitude of the exponentnfor magnetic annealing at 17T,n17T¼0:39, was obtained by a linear fit of
the diagram in Fig. 12 and was found to be slightly higher than the exponent n0T¼0:37 for zero field annealing. As
seen in Table 1, there is no difference in the growth kinetics for grains in different grain subsets in specimens annealed without field. By contrast, as expected from results of macrotexture measurements (Fig. 8), in specimens annealed in a magnetic field the mean size of grains in the subset (180,35,’2) was larger than in the subset (0,35,’2). Figure 12(b) illustrates that the growth kinetics in the grain subset (180,35,’2) are faster (n
ð180;35;’2Þ
17T ¼0:44) than the
average kinetics of all grains, whereas growth is retarded for grains in the subset (0,35,’2) (n
ð0;35;’2Þ
17T ¼0:32).
A qualitatively very similar behaviour, i.e. that a magnetic field slows down or increase the growth rate of differently oriented grains, is also obtained by a computer simulation of magnetically affected grain growth in a 2D polycrystal (Fig. 13).
However, the observed texture anisotropy after magnetic annealing can not be completely justified by this relatively slight difference in the mean size of grains in different grain subsets. For instance, the ratio of the mean grain area in both subsets after 240 min magnetic annealing is d2
ð180;35;’2Þ=
d2
ð0;35;’2Þ¼1:45, whereas the ratio of the pole intensity for
both texture components in Fig. 8(e) amounts to 4.3. As given in Table 1 and illustrated in Fig. 14, a magnetic annealing also results in a substantial change of the number of grains in both grain subsets. The two major texture peaks in the (0002) pole figures after annealings without field are not completely symmetric (Figs. 4–6) which is reflected by the non-equal number of grains in the respective subsets: the grain fraction in subset (0,35,’2) was slightly larger than this in subset (180,35,’2) (Table 1). However, after magnetic
[image:6.595.305.549.70.436.2]a b c
Fig. 10 Simulated texture development during grain growth in a 2D Ti-polycrystal in a magnetic field. (0002) pole figures for the specimen (a) with an initially random texture and for the same specimen after 25 min annealing in a magnetic field of 20 T parallel to (b) the sheet normal (ND) and (c) the rolling direction (RD).
a b
c d
e f
subset (180,35,ϕ2) other grains
subset (0,35,ϕ2)
g
Fig. 11 Grain microstructures obtained by orientation imaging with EBSD after annealing at 1023 K for (a) 75 min, (c) 135 min and (e) 195 min at zero field and for 15 min at zero field and (b) 60 min, (d) 120 min, (f) 180 min and (g) 240 min in a magnetic field of 17 T.
60 90 120 150 180 210 240 270 300 60
80 100 120 140 160 180
Time, t / min
Mean Gr
ain Siz
e
,
<D>
/
µ
m
60 90 120 150 180210 240 270 300 60
80 100 120 140 160 180
(180,35,ϕ2)
(0,35,ϕ2)
all grains
Time, t / min
Mean Gr
ain Siz
e
,
<D>
/
µ
m
a b
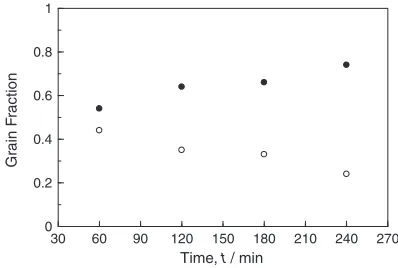
[image:6.595.49.290.70.178.2] [image:6.595.307.548.507.608.2]annealing the grains in the energetically favored subset (180,35,’2) substantially outnumber the grains in the disfavored subset (0,35,’2) (Fig. 14).
The same behaviour is also captured by computer simulations. As shown in Fig. 15(a)–(b), the fraction of the energetically favored grain subset (180,35,’2) (pm <0)
increases during the annealing in the field, whereas the fraction of the (0,35,’2) grain subset decreases. If a magnetic field is applied parallel to the sheet normal (ND) (see Fig. 10) and therefore grains with ¼90 have the minimum
magnetic free energy, similar results are obtained for the change of grain fractions in (’1,90,’2) and (all other grains) subsets (Fig. 15(c)–(d)).
Therefore, the analysis of individual orientation measure-ments and the results of computer simulations reveal that a magnetic field affects the grain growth kinetics in such a way that the growth of grains with energetically favored orienta-tions is enhanced, whereas the growth of grains with disfavored orientations is retarded. Moreover, grains with energetically preferred orientations do not only grow faster, but their number fraction is larger than half of all grains and continuously rises during magnetic annealing, while the fraction of grains with disfavored orientations decreases. It is worth noting that this result provides a possible explanation for the magnetic enhancement of the growth kinetics averaged over all grains: the faster growth rate in a larger and constantly rising grain fraction necessarily results in an increased average growth rate.
The observed difference in the number of grains
compris-ing both texture peaks in the (0002) pole figures after magnetic annealing (Figs. 4–7) can be attributed to magneti-cally shifted grain growth kinetics. As shown in our previous study,21) the Hillert relation22)for the growth rate of grains
with size R in the presence of a magnetic field can be extended to
dR
dt ¼mbð
1
R R
1
RÞ mbpm ð6Þ
where andmbare the grain boundary energy and mobility
(equal for all grain boundaries), and is a dimensionless constant. In contrast to the classical Hillert approach, the mean grain size RR is not the critical size of grains which neither grow nor shrink anymore. If grain growth occurs in a magnetic field, the threshold grain sizeRthcan be expressed
as21)
Rth¼
R R
1
R Rpm
ð7Þ
Due their ‘‘high energy’’ orientations, grains comprising the (0,35,’2) texture peak on average experience a positive magnetic driving force, pm>0, while for ‘‘low energy’’
grains of the (180,35,’2) peak a magnetic driving force is negative, pm <0. Therefore, according to eq. (7), the
threshold grain size for shrinkage or growth of high energy grains increases, whereas it decreases for low energy grains. Correspondingly, more high energy grains shrink and disappear and, on the other hand, more low energy grains grow than it would be the case at zero field. Obviously this should result in an increase or decrease of the number fractions of the differently oriented grains as observed in the current experiment and simulations.
Time, t / s
Gr
ain F
raction
Time, t / s
Gr
ain F
raction
a b
Time, t / min
Gr
ain F
raction
Time, t / min
Gr
ain F
raction
[image:7.595.70.275.69.190.2]c d
Fig. 15 Computed grain fractions in different grain subsets vs. annealing time at zero field and in a field of 17 T. (a) and (b) – grain subsets (180,35,’2) and (0,35,’2), respectively; initial grain structure –
micro-structure after 15 min annealing of the 75%-rolled Ti sheet at 1023 K; the magnetic field was directed as shown in Fig. 9. (c) and (d) – grain subsets (’1,90,’2) and (all other grains); magnetic field was directed along the
sheet normal and applied to the grain structure with random orientation distribution.
30 60 90 120 150 180 210 240 270
Time, t / min
Gr
ain F
raction
[image:7.595.305.547.73.276.2]0 0.2 0.4 0.6 0.8 1
Fig. 14 Grain fractions in the (180,35,’2) (solid symbols) and (0,35,’2)
(open symbols) subsets after anealing at 1023 K in a magnetic field of 17 T.
Time, t / s
Mean Gr
ain Siz
e
,
<D>
/
µ
[image:7.595.68.267.251.385.2]m
The results of simulations also revealed that the magneti-cally affected grain growth kinetics is consequentially reflected in the behaviour of the grain size distribution for differently oriented grains. Figure 16 depicts these distribu-tions for energetically favored and disfavored grains before and after the magnetic annealing. The magnetic annealing is seen to result in a distinct shift of grain size distributions to smaller and larger grain sizes for high and low energy grains, respectively.
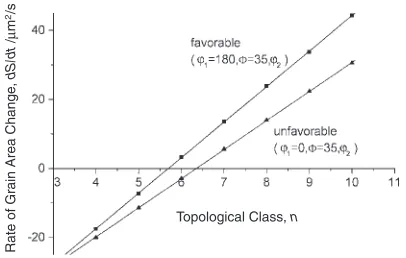
An application of a magnetic field during annealing results not only in the change of the growth rate of differently oriented grains, but substantially alters the final distribution of the grains of different topological classes (Fig. 17). As seen in Fig. 18, in the presence of a magnetic field the computed dependence of the rate of the grain area change
dS=dton the topological classnof the grain does not intersect the n-axis at n¼6 (see Fig. 2). Rather this dependence
moves in opposite directions for grains with energetically favored and disfavored orientations. In Ref. 23), where the von Neumann-Mullins approach was extended to account the influence of a magnetic field, was shown that the topological class of the stable grains can be expressed as
nth¼6 1þ
Rthpm
ð8Þ
According to eq. (8), the topological class of the stable grains in preferred energetic configurations (pm<0), is reduced to
nth<6 and raised to nth>6 for grains in unfavored
configurations (pm>0). This practically means that grains
with topological class 6 do not remain stable anymore in the magnetic field, but either grow or shrink, that results in a significant decrease of the fraction of grains withn¼6in a 2D-polycrystal after magnetic annealing (Fig. 17(b)).
Obviously, a magnetic field in the current experiment and simulations could facilitate the observed changes in the orientation distribution of grains and growth kinetics of differently oriented grains since the magnitude of the generated magnetic driving force during grain growth was comparable to curvature forces. Indeed, for normal (contin-uous) grain growth eq. (2) can be re-written as
pc¼ 2
r ; ð9Þ
whereris the radius of curvature, which usually scales with the grain size but exeeds it by about an order of magnitude. For a mean grain size of about 40mmthat corresponds to the grain structure in the investigated titanium before the application of a magnetic field (see Table 1), the curvature force amounts to about 2 kJ/m3 and then decreases with a rising mean grain size during the annealing. In contrast, according to eq. (3) the maximum magnetic driving force in the current experiment (Ti ¼1:18105,24) field
strength H¼1:35107A/m, c-axes of grains oriented close to (180,35,’2) are almost normal to the field direction) remains constant during annealing. It is equal to the differ-ence of the magnetic energy density between grains with ideal orientations (0,35,’2) and (180,35,’2) and amounts to about pmaxm ¼1:5kJ/m3.
Apparently, for fine-grained structures the magnetic driv-ing force generated by a magnetic field of the same strength is much smaller than the curvature force and, therefore, is unlikely to cause measurable texture anisotropy during the annealing. It is worth noting, however, that the impact of a magnetic field on grain growth is not only confined to a change of the net driving force for grain boundary motion. As was observed recently in experiments with 78%-cold rolled titanium,25)grain growth at its early stage during annealing at
803 K (mean grain sizes in the range between 2 and 3mm) was found to be distinctly enhanced by a magnetic field of 19T that was attributed to the magnetically accelerated grain boundary mobility.25)
4. Summary
The effect of a magnetic field on texture and grain microstructure evolution during grain growth in titanium was addressed. Annealing of 75% rolled titanium sheet specimens
Gr
ain F
raction
Topological Class, n
Gr
ain F
raction
Topological Class, n
[image:8.595.49.291.71.150.2]a b
Fig. 17 Computed grain fractions vs. topological class (a) in subsets with energetically favored and disfavored grain orientations after magnetic annealing at 17 T for 10 min; (b) for all grains after the annealing at zero field and at 17 T; the magnetic field was directed along the sheet normal (ND) and applied to the grain structure with random orientation distribution.
Rate of Gr
ain Area Change
,
dS/dt
/
µ
m
2/s
Topological Class, n
Fig. 18 Computed rate of grain area change for differently oriented grains after 10 min annealing in a field of 17 T.
[image:8.595.49.294.223.304.2]a b
Fig. 16 Computed grain size distributions for grains with low (’1,90,’2)
[image:8.595.68.271.402.531.2]in a specific inclined configuration at 1023 K in a magnetic field of 17 T for 60, 120, 180 and 240 minutes results in an increasing asymmetry of the usually symmetrical texture. The intensity of the texture peak composed by orientations close to (180,35,’2) rises, while the intensity of the (0,35,’2) peaks decreases. Obviously, this behaviour is due to the additional driving force for grain growth arising in a magnetic field and caused by the anisotropy of the magnetic susceptibility of paramagnetic titanium. The remarkable property of a magnetic field to produce preferred orientations in a magnetically anisotropic material was further analyzied by computer simulations of 2D grain growth.
EBSD measurements as well as simulations revealed that the grain growth kinetics in titanium become orientation dependent in a magnetic field. The growth of grains with energetically favored orientations is enhanced, whereas the growth of grains with disfavored orientations is retarded. However, grains with energetically preferred orientations not only grow faster, but their fraction is larger than a half of the total grains number and continuously rises during magnetic annealing, while the fraction of slower growing grains with disfavored orientations decreases. Furthermore, as shown by computer simulations, the application of a magnetic field during annealing results not only in the change of the growth rate of differently oriented grains, but distinctly alters the final distribution of the grains of different topological classes.
Acknowledgements
The authors express their gratitude to the Deutsche Forschungsgemeinschaft for financial support (Grant MO 848/6-2). Part of this work was performed at the National High Magnetic Field Laboratory, which is supported by NSF Cooperative Agreement No. DMR-0084173, by the State of Florida and by the DOE. The help of Dr. Bruce Brandt and his team (DC Field Facility of NHMFL) in performing magnetic annealing experiments is gratefully acknowledged.
REFERENCES
1) R. Smoluchowski: Phys. Rev.83(1951) 69–74. 2) D. Turnbull: J. Metals3(1951) 661–667.
3) R. A. Vandermeer: Trans. AIME233(1965) 266–271.
4) V. Y. Aristov, V. E. Fradkov and L. S. Shvindlerman: Phys. Met. Metall.45(1979) 83–87.
5) D. A. Molodov, G. Gottstein, F. Heringhaus and L. S. Shvindlerman: Acta Mater.46(1998) 5627–5632.
6) D. A. Molodov, V. A. Ivanov and G. Gottstein: Acta Mater.55(2007) 1843–1848.
7) W. W. Mullins: Acta Metall.4(1956) 421–432.
8) A. D. Sheikh-Ali, D. A. Molodov and H. Garmestani: Scripta Mater.46
(2002) 857–862.
9) D. A. Molodov and A. D. Sheikh-Ali: Acta Mater.52(2004) 4377– 4383.
10) D. A. Molodov, P. J. Konijnenberg, N. Bozzolo and A. D. Sheikh-Ali: Mater. Letters59(2005) 3209–3213.
11) M. Dahms and H. J. Bunge: J. Appl. Cryst.22(1989) 439–447. 12) M. Dahms: Appl. Cryst.25(1992) 259–267.
13) K. Kawasaki, T. Nagai and K. Nakashima: Phil. Mag.60(1989) 399– 421.
14) D. Weigand, Y. Brechet and J. Lepinoux: Phil. Mag.B 78(1998) 329– 352.
15) H. J. Frost, C. V. Thompson, C. L. Howe and J. Whang: Scripta Metall. Mater.22(1988) 65–70.
16) W. Fayad, C. V. Thompson and H. J. Frost: Scripta Mater.40(1999) 1199–1204.
17) L. A. Barrales-Mora, V. Mohles, P. J. Konijnenberg and D. A. Molodov: Comp. Mater. Sci.39(2007) 160–165.
18) W. W. Mullins: J. Appl. Phys.27(1956) 900–904.
19) A. K. Singh and R. A. Schwarzer: Z. Metallk.91(2000) 702–716. 20) F. Wagner, N. Bozzolo, O. Van Landuyt and T. Grosdidier: Acta Mater.
50(2000) 1245–1259.
21) D. A. Molodov and P. J. Konijnenberg: Scripta Mater.54(2006) 977– 981.
22) M. Hillert: Acta Metall.13(1965) 227–238.
23) D. A. Molodov, P. J. Konijnenberg, L. A. Barrales-Mora and V. Mohles: J. Mater. Sci.41(2006) 7853–7861.
24) N. V. Vol’kenshtein, E. V. Galoshina and E. B. Panikovskaya: Sov. Phys. JETP40(1975) 730–734.
25) D. A. Molodov, Chr. Bollmann and G. Gottstein: Mater. Sci. Eng. A