Large-scale SNP analysis reveals
clustered and continuous patterns
of human genetic variation
Mark D. Shriver,
1*Rui Mei,
2Esteban J. Parra,
3Vibhor Sonpar,
1Indrani Halder,
1Sarah A. Tishkoff,
4Theodore G. Schurr,
5Sergev I. Zhadanov,
5,6Ludmila P. Osipova,
6Tom D. Brutsaert,
7Jonathan Friedlaender,
8Lynn B. Jorde,
9W. Scott Watkins,
9Michael J. Bamshad,
9,10Gerardo Gutierrez,
1Halina Loi,
2Hajime Matsuzaki,
2Rick A. Kittles,
11George Argyropoulos,
12Jose R. Fernandez,
13Joshua M. Akey
14and Keith W. Jones
21Penn State University, University Park, Pennsylvania, USA 2Affymetrix, Inc., Santa Clara, California, USA
3University of Toronto at Mississauga, Mississauga, Ontario, Canada 4University of Maryland, College Park, Maryland, USA
5Pennsylvania University, Philadelphia, Pennsylvania, USA
6The Institute of Cytology and Genetics, Siberian Branch of the Russian Academy of Sciences, Novosibirsk, Russia 7State University of New York at Albany, New York, USA
8Temple University, Philadelphia, Pennsylvania, USA
9Department of Human Genetics, University of Utah, Salt Lake City, Utah, USA 10Department of Pediatrics University of Utah, Salt Lake City, Utah, USA 11National Human Genome Center, Howard University, Washington DC, USA 12Pennington Center for Biomedical Research, Baton Rouge, Louisiana, USA 13University of Alabama at Birmingham, Birmingham, Alabama, USA 14Fred Hutchinson Cancer Research Center, Seattle, Washington, USA
*Correspondence to: Tel:þ1 814 863 1078; Fax:þ1 814 863 1474; E-mail: [email protected]
Date received (in revised form): 8th February 2005
Abstract
Understanding the distribution of human genetic variation is an important foundation for research into the genetics of common diseases. Some of the alleles that modify common disease risk are themselves likely to be common and, thus, amenable to identification using gene-association methods. A problem with this approach is that the large sample sizes required for sufficient statistical power to detect alleles with moderate effect make gene-association studies susceptible to false-positive findings as the result of population stratifi-cation.1,2Such type I errors can be eliminated by using either family-based association tests or methods that sufficiently adjust for population
stratification.3 – 5These methods require the availability of genetic markers that can detect and, thus, control for sources of genetic
stratification among populations. In an effort to investigate population stratification and identify appropriate marker panels, we have analysed 11,555 single nucleotide polymorphisms in 203 individuals from 12 diverse human populations. Individuals in each population cluster to the exclusion of individuals from other populations using two clustering methods. Higher-order branching and clustering of the populations are consistent with the geographic origins of populations and with previously published genetic analyses. These data provide a valuable resource for the definition of marker panels to detect and control for population stratification in population-based gene identification studies. Using three US resident populations (European-American, African-American and Puerto Rican), we demonstrate how such studies can proceed, quantifying proportional ancestry levels and detecting significant admixture structure in each of these populations.
Keywords:population genetics, population genomics, human evolution, migration, admixture, population stratification
Introduction
Substantial progress has been made using genetic markers to elucidate the evolutionary histories of populations, yet this
patterns of population stratification.8,9Such studies can facilitate the exploration of the genetic structure that may exist among and within populations and also provide a valuable source of ancestry informative markers (AIMs) to quantify and adjust for this structure in gene-identification studies.
Results
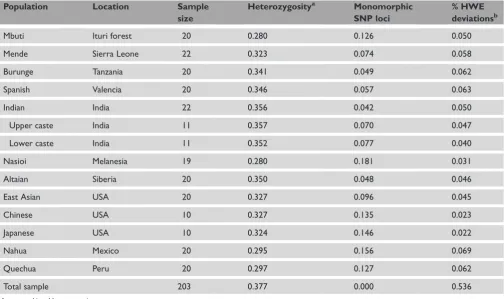
Here, we analysed 11,555 single nucleotide polymorphism (SNP) markers in 12 population samples using a new microarray-genotyping platform called Whole Genome Sampling Amplification (WGSA; Affymetrix, Santa Clara, CA). Populations were selected to represent a broad spectrum of world variation (Table 1). Four populations stand out as having similarly elevated heterozygosity (Burunge, Spanish, Indian and Altaian). Four groups (Nahua, Quechua, Nasioi and Mbuti) have lower levels of variability, while the two East Asian populations and the Mende are intermediate. These results are largely consistent with expectations for populations known to have experienced restrictions in population size (eg Mbuti, Nasioi, Nahua and Quechua), reducing levels of genetic variability relative to other populations;9,10 however, ascertainment bias in terms of the population(s) in which
markers were first discovered precludes making strong statements about differences in variability using SNP data.11 In addition, ascertainment bias — such as that resulting from both a limited representation of populations and small numbers of individuals in discovey panels — can lead to deviations in linkage disequilibrium estimates,12 artefactually elevated FSTlevels (see Ronald and Akey in this issue of
Human Genomics) and higher derived allele frequencies in non-African than in non-African populations.13Despite the
general importance of considering ascertainment bias on a number of population genetic parameter estimates, there is no evidence or theory that predicts problems from ascertainment bias on estimates of measures of individual relatedness or deviations from Hardy–Weinberg equilibrium (HWE). Randomly mating populations are expected to show genotype frequencies that are consistent with HWE expectations. The results of tests for HWE are presented as the proportion of loci that have deviations from equilibrium expectations (Table 1). Some populations show slightly higher or lower proportions of significant results. The most notable deviation is seen when all the populations are combined, at which point over half (56 per cent) of the SNPs show significant HWE deviations. These deviations highlight the importance of taking population structure into account in gene-association
Table 1. Populations and summary statistics for autosomal single nucleotide polymorphism (SNP) loci.
Population Location Sample
size
Heterozygositya Monomorphic
SNP loci
% HWE deviationsb
Mbuti Ituri forest 20 0.280 0.126 0.050
Mende Sierra Leone 22 0.323 0.074 0.058
Burunge Tanzania 20 0.341 0.049 0.062
Spanish Valencia 20 0.346 0.057 0.063
Indian India 22 0.356 0.042 0.050
Upper caste India 11 0.357 0.070 0.047
Lower caste India 11 0.352 0.077 0.040
Nasioi Melanesia 19 0.280 0.181 0.031
Altaian Siberia 20 0.350 0.048 0.046
East Asian USA 20 0.327 0.096 0.045
Chinese USA 10 0.327 0.135 0.023
Japanese USA 10 0.324 0.146 0.022
Nahua Mexico 20 0.295 0.156 0.069
Quechua Peru 20 0.297 0.127 0.062
Total sample 203 0.377 0.000 0.536
aAverage unbiased heterozygosity.
studies. Extensive admixture structure is created by combining these samples, leading to HWE deviations and, presumably, allelic associations among unlinked markers at loci showing large frequency differences across populations.3
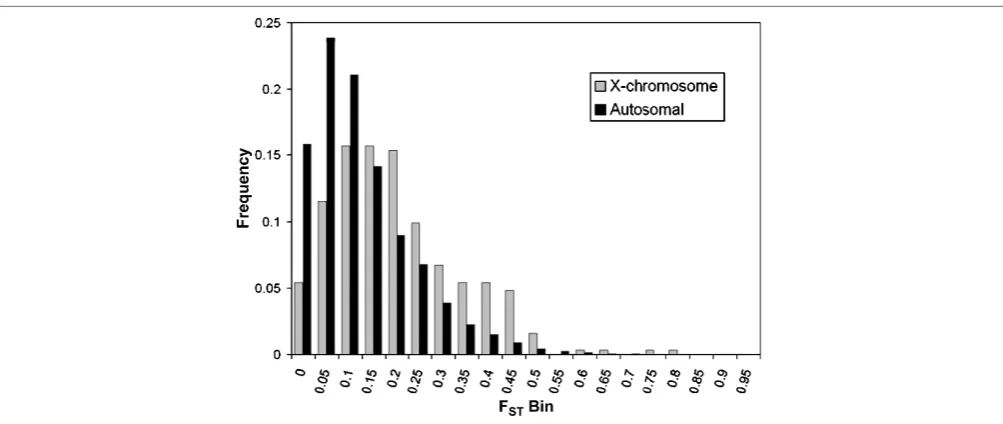
The proportion of the total genetic variation due to differences among populations was estimated using FST. Figure 1 shows a histogram of the FST distribution, with the autosomal SNPs plotted separately from the X-linked SNPs. The average level of FSTfor autosomal SNPs (0.148) is within the range of previously published FSTestimates (5–15 per cent), confirming the well-known fact that most variability in human populations is observed within populations.4 – 6,14,15 The average FSTobserved for the X-chromosomal SNPs (0.224) is substantially higher than that for the autosomal SNPs
ðp,0:0001Þ;which is consistent with both the smaller effective population size and the higher levels of natural selection for X-chromosome genes.16 – 18It is also notable that these distributions are not described well by averages, since they are highly skewed and have long tails, highlighting the fact that unlinked loci can have different evolutionary histories.19
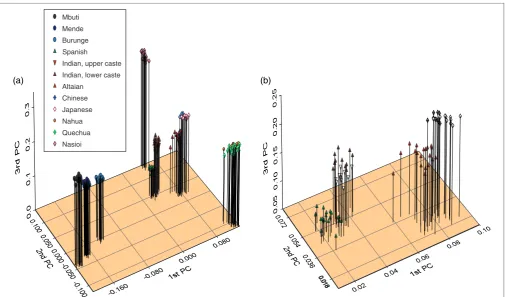
For calculating heterozygosity and FST, population divisions were assumed to be known and individuals were grouped using ethnic and geographical information. Given the large number of markers in our dataset, population genetic analyses can be performed at the level of the individual, making no presumption of group membership.18,20Two methods were used to investi-gate clustering among individuals: neighbour-joining trees21 and principal coordinates (PCs) analysis, using the allele-sharing distance (ASD)22for all pairwise combinations of individuals. Figure 2 shows a neighbour-joining tree of individuals, con-structed with the ASD measure matrix, using 11,078 autosomal
SNPs. The root of the tree, based on the combined ape out-group, is located between the Mende and Mbuti. This sup-ports an African origin for modern humans. The next group to diverge from the main trunk is the East African Burunge. Most populations have population-specific branches of substantial length, the largest being the Melanesians and the indigenous Americans. In addition to the Burunge, the South Asian Indians and the Altaians have relatively short population-specific branches, consistent with gene flow between these groups and other populations. The largest internal branch separates the three African from the non-African populations, and the next group to diverge is the Spanish, followed by the South Asian Indians. No clear separation of the upper and lower caste populations is seen here (but see Figure 3).
Although trees provide a useful means of illustrating relationships among populations or individuals, they are limited by the assumption of bifurcating topologies. PC analysis is an alternative analytical method, which lacks this assumption. Figure 3a shows the first three PC axes for all populations. As with the tree, individuals from one population cluster tightly, to the exclusion of individuals from other populations. The first PC axis shows a separation of the African and non-African populations, with the Burunge being closer to the non-Africans than either of the other two African populations. The second PC axis shows the indigen-ous Americans and Melanesians to be on opposite sides of the axis. On the tree, the two indigenous American popu-lations are separated into monophyletic clusters, while the PC analysis shows overlapping clusters. When focusing on the Eurasian populations (Figure 3b), there is a clinal relationship across all three PC axes for these populations, which is Figure 1.Distribution of locus-specific FSTfor autosomal (n¼11,078, grey bars) and X-linked (n¼313, black bars) single nucleotide
consistent with their geographic positions from Spanish in the lower left to Japanese in the upper right. Notable are the near separation of the Indian sample into lower and upper caste, with the upper caste individuals positioned closer to the Spanish.23,24Additionally, the Altaians are intermediate between the East Asians and the Europeans, a finding that is consistent with Y-chromosomal studies showing Central Asian origins for components of the European gene pool.25
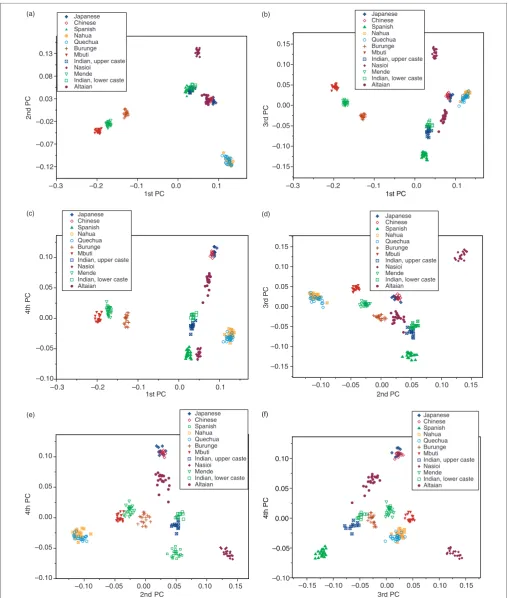
Another way of exploring the PC analysis results is to examine the pairwise plots of the PC components. As the first four components were significant using the broken stick test, not all can be plotted in three-dimensional space. The six possible pairwise plots are presented in Figures 4a–f.
In addition to these 12 geographically well-defined population samples, we have analysed three cosmopolitan samples collected in the USA (African-Americans, European-Americans and Puerto Ricans). These populations are known to have been subject to both within-continent and among-continent admixture in the recent past. We estimated the individual biogeographical ancestry levels for each person in these three samples. These maximum likelihood estimates of proportional ancestry (Figure 5) show a greater tendency for the European-American subjects to cluster together, by comparison with the other two population samples. The African-Americans and Puerto Ricans both show relatively high levels of variability in individual ancestry
Jp8 Jp9 Jp5 Jp10 Jp7 Jp2 Jp3 Jp6 Jp4 Ch1Jp1 Ch2 Ch9 Ch10 Ch8 Ch3 Ch5 Ch7 Ch4 Ch6 Alt15Alt23 Alt16Alt17 Alt2 Alt10Alt7 Alt13Alt22 Alt25 Alt4 Alt11 Alt18Alt19 Alt5 Alt12Alt9 Alt8Alt1Alt20 Nah17Nah18Nah2
Nah3Nah10 Nah8Nah5Nah9
Nah7Nah20
Nah12Nah6Nah16
Nah13Nah14Nah19Nah1 1 Nah15Nah4Nah1Qech8
Qech20Qech1
1
Qech18Qech16 Qech6 Qech10 Qech5 Qech2 Qech14 Qech17 Qech19 Qech13 Qech15 Qech4 Qech3 Qech1 Qech12
Qech7 Qech9 Bgvl1 Bgvl8 Bgvl2 Bgvl3 Bgvl5
Bgvl7 Bgvl4 Bgvl9 Bgvl15 Bgvl17
Bgvl18 Bgvl12 Bgvl1
1 Bgvl6 Bgvl13 Bgvl10
Bgvl16 Bgvl14 Bgvl19 Indl1Indu2 Indl8 Indl9Indu3 Indl6Indu7 Indu9 Indu6Indu4 Indu5 Indl4Indl2 Indu12 Indl5 Indu1Indu11 Indu8 Indl10 Indl11 Indl3 Indl7 Sp17 Sp19 Sp20 Sp3 Sp13 Sp2 Sp9 Sp10 Sp1 Sp18 Sp5 Sp14 Sp15 Sp16 Sp4 Sp8 Sp6 Sp12 Sp7 Sp1 1 Brng1 Brng5 Brng14 Brng15 Brng17 Brng19 Brng7 Brng16 Brng8 Brng13 Brng18 Brng4 Brng10 Brng9 Brng3 Brng1 1 Brng6 Brng20 Brng2 Brng12 MBti1 1 MBti4 MBti5 MBti3 MBti2 MBti10 MBti20 MBti14 MBti12 MBti16 MBti8 MBti13 MBti9 MBti18MBti6 MBti1MBti7 MBti19 MBti15 MBti17 ROOT Mende16 Mende20 Mende10 Mende18 Mende21 Mende8 Mende1 1 Mende12 Mende15 Mende6 Mende17 Mende2 Mende14 Mende3 Mende9 Mende4 Mende5 Mende19 Mende1 Mende22 Mende7 Mende13 0.05
levels, with most of the non-African ancestry in the African-Americans being from Europe. The Puerto Ricans show some individuals with more indigenous American ancestry, as well as substantial West African ancestry.
Another test for the presence of admixture structure is based on correlations in individual ancestry indices calculated from independent (unlinked) panels of markers.26 We tested for significant correlations using two types of individual indices, PCs (Table 2) and biogeographical ancestry (Table 3), calculated separately from the even and odd chromosomal SNPs. To do this, we divided the SNPs into two groups; all of the SNPs on even chromosomes in one group and all of the SNPs on odd chromosomes in the other group. Unless there is structure which is related to the axes of ancestry measured by these indices within a population, no significant relationship between the two estimates is expected.25 The correlation results on the PC components show that only three (upper caste Indian, Altaian and Nasioi) of the 12 world populations show evidence of population structure. The combined Indian sample (upper caste and lower caste together) also shows significant correlations, while the combined East Asian (Japanese and Chinese) population does not. Alternatively, all three cosmopolitan samples tested (African-American,
European-American and Puerto Rican) show significant correlations between the even and odd chromosome PC analyses. Significant correlations are also seen for the estimates of biogeographical ancestry in these three populations (Table 3). It is notable that, not only are there high correlations in the African-American and Puerto Rican samples, but also in the European-American sample, indicating the presence of admixture structure in a population generally assumed to be homogeneous.27
Discussion
The large number of markers used in these analyses has provided an opportunity to assess genetic variation at the level of the individual in a number of populations from around the world. These multilocus genotype data on a large panel of SNPs provide a new level of resolution in the distribution of variation within and among populations. Individuals cluster into groups comprising other individuals from their own or closely-related populations when diverse groups from around the world are analysed.28,29By contrast, when samples from the more cosmopolitan US resident populations are
Mbuti Mende Burunge Spanish
Indian, upper caste Indian, lower caste Altaian
Chinese Japanese Nahua Quechua Nasioi
–0.3 –0.2 –0.1 0.0 0.1 1st PC –0.12 –0.07 –0.02 0.03 0.08 0.13 2nd PC Japanese Chinese Spanish Nahua Quechua Burunge Mbuti
Indian, upper caste Nasioi
Mende Indian, lower caste Altaian
(a) (b)
(c) (d)
(e) (f)
–0.3 –0.2 –0.1 0.0 0.1
1st PC –0.15 –0.10 –0.05 0.00 0.05 0.10 0.15 Japanese Chinese Spanish Nahua Quechua Burunge Mbuti
Indian, upper caste Nasioi
Mende Indian, lower caste Altaian
3rd
PC
–0.3 –0.2 –0.1 0.0 0.1
1st PC –0.10 –0.05 0.00 0.05 0.10 Japanese Chinese Spanish Nahua Quechua Burunge Mbuti
Indian, upper caste Nasioi
Mende Indian, lower caste Altaian
4th
PC
–0.10 –0.05 0.00 0.05 0.10 0.15
2nd PC –0.15 –0.10 –0.05 0.00 0.05 0.10 0.15 Japanese Chinese Spanish Nahua Quechua Burunge Mbuti
Indian, upper caste Nasioi
Mende Indian, lower caste Altaian
3rd
PC
–0.10 –0.05 0.00 0.05 0.10 0.15
2nd PC –0.10 –0.05 0.00 0.05 0.10 4th PC Japanese Chinese Spanish Nahua Quechua Burunge Mbuti
Indian, upper caste Nasioi
Mende Indian, lower caste Altaian
–0.15 –0.10 –0.05 0.00 0.05 0.10 0.15
3rd PC –0.10 –0.05 0.00 0.05 0.10 4th PC Japanese Chinese Spanish Nahua Quechua Burunge Mbuti
Indian, upper caste Nasioi
Mende Indian, lower caste Altaian
analysed, clustering patterns are less discrete. Substantial levels of variation in ancestry are observed within the African-American and Puerto Rican samples, while smaller, but significant, admixture structure is evident in the European-American sample. Whether the admixture structure in the European-American sample is the result of intra- or intercontinental gene flow is an important outstanding question. Thus, although discrete clustering of individuals may be useful in describing some of the variation in diverse, well-defined population samples, continuous measures — such as biogeographical ancestry or PC indices — are required to describe the same axes of population structure in populations that have experienced recent admixture.
Methods
SNP genotyping
WGSA technology was used to genotype individuals in this study using the GeneMapping 10K Array Xba 131 (Affymetrix Inc., Santa Clara, CA). Details of this method have been published elsewhere;29,30in brief, fractions of the genome are obtained by restriction enzyme (XbaI)
Figure 5.Triangle plot of three populations, illustrating maxi-mum likelihood estimates of individual ancestry. Puerto Ricans (n¼20) are shown as filled circles, African-Americans (n¼42) as grey triangles and European-Americans (n¼41) as open circles. Parental populations in this analysis are the average of the Nahua and Quechua as the indigenous American; Mende as the West African; and Spanish as the European.
Table 2. Correlation coefficients for comparisons between principal components (PC) estimates from the even and odd chromosome marker sets.
Population First PC Second PC Third PC Fourth PC
African-American 0.796 (<0.0001) 0.495 (0.001) 0.125 (NS) 0.219 (NS) European-American 0.498 (0.001) 0.021 (NS) 0.134 (NS) 0.078 (NS) Puerto Rican 0.624 (0.003) 0.761 (<0.0001) 0.417 (NS) 0.412 (NS)
Mbuti 0.098 (NS) 0.004 (NS) 0.014 (NS) 0.41 (NS)
Mende 0.170(NS) 0.236 (NS) 0.353 (NS) 0.302 (NS)
Burunge 0.197 (NS) 0.114 (NS) 0.051 (NS) 0.265 (NS)
Spanish 0.203 (NS) 0.065 (NS) 0.014 (NS) 0.157 (NS)
Indian, all 0.183 (NS) 0.659 (0.001) 0.612 (0.002) 0.483 (NS) Indian, lower caste 0.145 (NS) 0.565 (NS) 0.236 (NS) 0.491 (NS) Indian, upper caste 0.500 (NS) 0.736 (0.01) 0.342 (NS) 0.191 (NS) Altaian 0.136 (NS) 0.784 (<0.0001) 0.108 (NS) 0.448 (NS)
East Asian 0.158 (NS) 0.403 (NS) 0.047 (NS) 0.043 (NS)
Chinese 0.515 (NS) 0.127 (NS) 0.188 (NS) 0.376 (NS)
Japanese 0.503 (NS) 0.539 (NS) 0.049 (NS) 0.24 (NS)
Quechua 0.160 (NS) 0.380 (NS) 0.384 (NS) 0.399 (NS)
Nahua 0.047 (NS) 0.215 (NS) 0.097 (NS) 0.165 (NS)
Nasioi 0.015 (NS) 0.283 (NS) 0.742 (<0.0001) 0.775 (<0.0001)
digestion of genomic DNA, ligated with adaptors and subsequently amplified with a universal primer that is directed to the linker. The amplified target (a smear of polymerase chain reaction products of 400 to 800 base pairs [bps] in length) is fragmented, labelled with terminal transferase and biotin-ddATP and hybridised overnight to synthetic microar-rays.31,32Genotypes are called by interpreting signals from allele-specific probes using a model-based algorithm. The accuracy of this method is in excess of 99.5 per cent. SNPs were chosen from The SNP Consortium (TSC) database on the basis of their predicted location on 400–800 bp fragments generated byin silicodigestion of human genome sequences with various restriction enzymes. Predicted SNPs were then assayed against a panel of 108 individuals from diverse popu-lations. If two individuals were observed with each of the three genotypes, and the clustering patterns were acceptable, the SNP was considered to be confirmed and retained as part of the panel.
Samples
The population samples used in this study were collected under Internal Review Board approvals from the various institutions involved. The Mbuti population samples were collected in the Ituri Forest, the Mende samples from Sierra Leone. The Cushitic-speaking Burunge samples were collected in Tanzania but are thought to be of Ethiopian descent. The Spanish samples were collected in Valencia in Eastern Spain. The Nasioi were collected in Bougainville, Melanesia. The Altaian samples were collected in Siberia, Russia. The upper and lower caste groups were both sampled from Vishakapatnam, Andhra Pradesh, India. The Chinese (NA17011-NA17020) and Japanese (NA17051-NA17060) samples are from US residents, curated at the Coriell Institute. Quechua were sampled in Lima (n¼9) or Cerro de Pasco, Peru, at 4,338 meters (n¼11). In the former case, the subjects were highland natives, as both parents and grandparents were born on the Altiplano. Quechua subjects were selected to represent a subgroup of subjects with the lowest possible European admixture from a larger total sample ofn¼71. Similarly, the Nahua, who were sampled in the city of Tlapa, Guerrero, Mexico, were also selected as a subset of individuals showing low European ancestry, as measured with an inde-pendent set of markers. African-Americans (subset of 42 from
NA17100-17199) and European-Americans (subset of 42 from NA17200-NA17285) are represented by samples curated at the Coriell Institute. For these analyses, one individual initially classified as ‘Caucasian’ (Coriell Institute Cat# NA17205) was excluded from the European-American sample, as he/she clusters with South Asians, which, in combination with the lack of monophyletic clustering of South Asians and Spanish in this study, highlights the inappropriateness of the category ‘Caucasian’ in biomedical research. The Puerto Ricans are women born in Puerto Rico and living in New York City at the time of data collection.
Statistical analyses
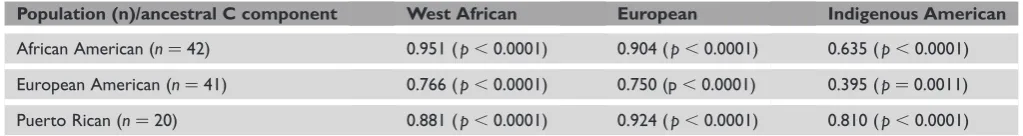
FSTwas calculated using Weir and Cockerham’s unbiased estimator.33Pairwise individual genetic distances were esti-mated using the ASD.22The tree of individuals, based on the ASD distance, was constructed using the neighbour-joining method,21using the Molecular Evolutionary Genetics Analysis software package (MEGA version 2.1).34The PC analysis was carried out using NTSYS software (Rohlf, F. J. [1992], NTSYS-pc version 1.70). The statistical significance of PC axes was determined using the broken stick model, resulting in four significant axes. These axes together explain 23.6 per cent of the total variation (12.6 per cent by the first axis, 5.5 per cent by the second, 3.5 per cent by the third and 1.9 per cent by the fourth). All pairwise PC axis plots for these four axes are presented in the online supplementary information. The STRUCTURE 2.08computer program was used to infer the presence of genetic structure in the sample. The analysis was performed both with and without the admixture model for K¼2 to K¼6, the model previously having been deter-mined to show the highest posterior probabilities for these data. A total of 25,000 simulation iterations were run for the burn-in period; 75,000 additional iterations were run to get parameter estimates. Biogeographical ancestry estimates were calculated for the 42 African-American subjects, the 41 European-American subjects and the 20 Puerto Rican women, using the maximum likelihood algorithm previously described,26whereby the allele frequencies for the three parental populations were taken to be indigenous American (Nahua and Quechua averaged together), West African (Mende) and European (Spanish). For testing the correlation Table 3. Correlation coefficients for comparisons between biogeographical ancestry estimates from the even and odd chromosome marker sets.
Population (n)/ancestral C component West African European Indigenous American
African American (n¼42) 0.951 (p,0.0001) 0.904 (p,0.0001) 0.635 (p,0.0001) European American (n¼41) 0.766 (p,0.0001) 0.750 (p,0.0001) 0.395 (p¼0.0011) Puerto Rican (n¼20) 0.881 (p,0.0001) 0.924 (p,0.0001) 0.810 (p,0.0001)
between subsets of markers, autosomal SNPs were divided by chromosome into those on odd and even chromosomes, respectively. Spearman’s correlation coefficient was then calculated for four significant PCs and the three ancestral components between using the odd and even estimates of these statistics. As has been demonstrated, estimates — even for highly admixed populations — will be uncorrelated unless there is substantial non-random mating in the population that is related to ancestry.35
Acknowledgments
We would like to thank Kateryna Makova, Ken Weiss, Anne Buchanan and S. Malia Fullerton for helpful comments and discussions on this paper. We would also like to acknowledge the trust and generosity of the people and populations who contributed the DNA samples on which this study is based. Additionally, for the collection of the Spanish population sample, we acknowledge Jose Americo Montoro from the blood transfusion centre in Valencia (Servei Valencia de Salut). This work was supported in part by grants: NIH/NHGRI (HG02154) to MDS; NJH/NIA(P30AG/NR15294-01) to JRF; NSF (SBR-9514733 and SBR-9818215) to LBJ;
References
1. Risch, N., Burchard, E., Ziv, E. and Tang, H. (2002), ‘Categorization of humans in biomedical research: Genes, race and disease’,Genome Biol. Vol. 3, pp. 1–12.
2. Kittles, R.A., Chen, W., Panguluri, R.K.et al.(2002), ‘CYP3A4-V and prostate cancer in African Americans: Causal or confounding associa-tion because of populaassocia-tion stratificaassocia-tion?’,Hum. Genet.Vol. 110, pp. 553–560.
3. Hoggart, C.J., Parra, E.J., Shriver, M.D.et al.(2003), ‘Control of con-founding of genetic associations in stratified populations’,Am. J. Hum.
Genet.Vol. 72, pp. 1492–1504.
4. Devlin, B. and Roeder, K. (1999), ‘Genomic control for association studies’,BiometricsVol. 55, pp. 997–1004.
5. Pritchard, J.K., Stephens, M., Rosenberg, N.A. and Donnelly, P. (2000), ‘Association mapping in structured populations’,Am. J. Hum. Genet. Vol. 67, pp. 170–181.
6. Cavalli-Sforza, L.L., Menozzi, P. and Piazza, A. (1994),The History and
Geography of Human Genes, Princeton University Press, Princeton, NJ.
7. Ke, Y., Su, B., Song, X.et al.(2001), ‘African origin of modern humans in East Asia: A tale of 12,000 Y chromosomes’,ScienceVol. 292, pp. 1151–1153.
8. Rosenberg, N.A., Pritchard, J.K., Weber, J.L.et al.(2002), ‘Genetic structure of human populations’,ScienceVol. 298, pp. 2381–2385. 9. Bamshad, M.J., Wooding, S., Watkins, W.S.et al.(2003), ‘Human
popu-lation genetic structure and inference of group membership’,Am. J. Hum.
Genet.Vol. 72, pp. 578–589.
10. Watkins, W.S., Rogers, A.R., Ostler, C.T.et al.(2003), ‘Genetic variation among world populations: Inferences from 100 Alu insertion poly-morphisms’,Genome Res.Vol. 13, pp. 1167–1618.
11. Rodgers, A.R. and Jorde, L.B. (1996), ‘Ascertainment bias in estimates of average heterozygosity’,Am. J. Hum. Genet.Vol. 58, pp. 1033–1041. 12. Nielsen, R. and Signorovitch, J. (2003), ‘Correcting for ascertainment
biases when analyzing SNP data: Applications to the estimation of linkage disequilibrium’,Theor. Popul. Biol.Vol. 63, pp. 245–255.
13. Mountain, J.L. and Cavalli-Sforza, L.L. (1994), ‘Inference of human evolution through cladistic analysis of nuclear DNA restriction poly-morphisms’,Proc. Natl. Acad. Sci. USAVol. 91, pp. 6515–6519.
14. Bowcock, A.M., Ruiz-Linares, A., Tomfohrde, J.et al.(1994), ‘High resolution of human evolutionary trees with polymorphic microsatellites’,
NatureVol. 368, pp. 455–457.
15. Lewontin, R. (1972), ‘The apportionment of human diversity’,Evol. Biol. Vol. 6, pp. 381–398.
16. Charlesworth, B., Coyne, J.A. and Barton, N.H. (1987), ‘The relative rates of evolution of sex chromosomes and autosomes’,Am. Nat.Vol. 130, pp. 113–149.
17. Payseur, B.A. and Nachman, M.W. (2002), ‘Natural selection at linked sites in humans’,GeneVol. 300, pp. 31–42.
18. Shriver, M.D., Kennedy, G.C., Parra, E.J.et al.(2004), ‘The genomic distribution of human population substructure in four populations using 8525 SNPs’,Hum. GenomicsVol. 1, pp. 274–286.
19. Cavalli-Sforza, L.L. (1966), ‘Population structure and human evolution’,
Proc. R. Soc. Lond. B. Biol. Sci.Vol. 164, pp. 362–379.
20. Mountain, J. and Cavalli-Sforza, L.L. (1997), ‘Multilocus genotypes, a tree of individuals and human evolutionary history’,Am. J. Hum. Genet. Vol. 61, pp. 705–718.
21. Saitou, N. and Nei, M. (1987), ‘The neighbor-joining method: A new method for reconstructing phylogenetic trees’,Mol. Biol. Evol.Vol. 4, pp. 406–425.
22. Chakraborty, R. and Jin, L. (1993), ‘A unified approach to study hypervariable polymorphisms: Statistical considerations of determining relatedness and population distances’, in: Pena, S.D.J., Jefferys, A.J., Epplen, J. and Chakraborty, R. (eds.),DNA Fingerprinting: Current State of
the Science, EXS, Vol. 67, Birkhauser, Basel, Switzerland, pp. 153–175.
23. Basu, A., Mukherjee, N., Roy, S.et al.(2003), ‘Ethnic India: A genomic view, with special reference to peopling and structure’,Genome Res. Vol. 13, pp. 2277–2290.
24. Bamshad, M., Kivisild, T., Watkins, W.S.et al.(2001), ‘Genetic evidence on the origins of Indian caste populations’,Genome Res.Vol. 11, pp. 994–1004.
25. Semino, O., Passarino, G., Oefner, P.J.et al.(2000), ‘The genetic legacy of PaleolithicHomo sapiens sapiensin extant Europeans: A Y chromosome perspective’,ScienceVol. 290, pp. 1155–1159.
26. Shriver, M.D., Parra, E.J., Dios, S.et al.(2003), ‘Skin pigmentation, biogeographical ancestry, and admixture mapping’,Hum. Genet.Vol. 112, pp. 387–399.
27. Wacholder, S., Rothman, N. and Caporaso, N. (2002), ‘Counterpoint: Bias from population stratification is not a major threat to the validity of conclusions from epidemiological studies of common polymor-phisms and cancer’,Cancer Epidemiol. Biomarkers Prev.Vol. 11, pp. 513–520.
28. Mountain, J. and Cavalli-Sforza, L.L. (1994), ‘Inference of human evol-ution through cladistic analysis of nuclear DNA restriction polymorph-isms’,Proc. Natl. Acad. Sci.USA Vol. 91, pp. 6515–6519.
29. Wilson, J.F., Weale, M.E., Smith, A.C.et al.(2001), ‘Population genetic structure of variable drug response’,Nat. Genet.Vol. 29, pp. 265–269. 30. Kennedy, G.C., Matsuzaki, H., Dong, S.et al.(2003), ‘Large-scale
genotyping of complex DNA’,Nat. Biotechnol.Vol. 21, pp. 1233–1237. 31. Matsuzaki, H., Loi, H., Dong, S.et al.(2004), ‘Parallel genotyping of over
10,000 SNPs using a one-primer assay on a high-density oligonucleotide array’,Genome Res.Vol. 14, pp. 414–425.
32. Chee, M., Yang, R., Hubbell, E.et al.(1996), ‘Accessing genetic infor-mation with high-density DNA arrays’,ScienceVol. 274, pp. 610–614. 33. Weir, B.S. and Cockerham, C.C. (1984), ‘Estimating F-statistics for
the analysis of population substructure’,EvolutionVol. 38, pp. 1358–1370.
34. Kumar, S., Tamura, K., Jakobsen, I.B. and Nei, M. (2001), ‘MEGA2: Molecular Evolutionary Genetics Analysis software’,BioinformaticsVol. 17, pp. 1244–1245.
35. Parra, E.J., Kittles, R.A. and Shriver, M.D. (2004), ‘Implications of cor-relations between skin color and genetic ancestry for biomedical research’,