M E T H O D O L O G Y
Open Access
Functional networks inference from
rule-based machine learning models
Nicola Lazzarini
1, Paweł Widera
1, Stuart Williamson
2, Rakesh Heer
3, Natalio Krasnogor
1and Jaume Bacardit
1**Correspondence:
[email protected] 1Interdisciplinary Computing and Complex BioSystems (ICOS) research group, School of Computing Science, Newcastle University, Newcastle upon Tyne, UK Full list of author information is available at the end of the article
Abstract
Background: Functional networks play an important role in the analysis of biological processes and systems. The inference of these networks from high-throughput (-omics) data is an area of intense research. So far, the similarity-based inference paradigm (e.g. gene co-expression) has been the most popular approach. It assumes a functional relationship between genes which are expressed at similar levels across different samples. An alternative to this paradigm is the inference of relationships from the structure of machine learning models. These models are able to capture complex relationships between variables, that often are different/complementary to the similarity-based methods.
Results: We propose a protocol to infer functional networks from machine learning models, called FuNeL. It assumes, that genes used together within a rule-based machine learning model to classify the samples, might also be functionally related at a biological level. The protocol is first tested on synthetic datasets and then evaluated on a test suite of 8 real-world datasets related to human cancer. The networks inferred from the real-world data are compared against gene co-expression networks of equal size, generated with 3 different methods. The comparison is performed from two different points of view. We analyse the enriched biological terms in the set of network nodes and the relationships between known disease-associated genes in a context of the network topology. The comparison confirms both the biological relevance and the complementary character of the knowledge captured by the FuNeL networks in relation to similarity-based methods and demonstrates its potential to identify known disease associations as core elements of the network. Finally, using a prostate cancer dataset as a case study, we confirm that the biological knowledge captured by our method is relevant to the disease and consistent with the specialised literature and with an independent dataset not used in the inference process.
Availability: The implementation of our network inference protocol is available at: http://ico2s.org/software/funel.html
Keywords: Machine learning, Biological knowledge extraction, Network inference, Functional networks
Background
The inference of biological networks is a highly relevant and challenging task in systems biology and integrative bioinformatics. Biological networks are graphs in which nodes represent genes or proteins, and a connection between them indicates some kind of bio-logical relationship, e.g. regulatory or functional. The network inference is, in an essence,
an attempt to reverse engineer the biological relationships from the high-throughput biological data [1].
Most biological network inference methods focus on the definition of gene regulatory networks, in which edges represent direct regulatory interactions between genes [2–4]. Far less effort has been put into the design of methods to build functional networks in which a connection indicates a functional relationship, e.g. membership in the same path-way or protein complex. One of the typical uses of these networks is the identification of functional modules (subset of genes with multiple internal connections and a few connec-tions with genes outside the module that describe, explain or predict a biological process or phenotype).
One of the earliest (but still widely used) approach to infer functional networks is the “guilt-by-association” principle [5]. That is, if two genes showsimilarexpression profiles, it is assumed they are also functionally related (via a direct or indirect interaction). Ini-tially, this paradigm was applied to infer networks from transcriptomics data, and this is why in most of the literature it is known as theco-expressionnetwork inference principle. Nevertheless, it is abstract enough to be applied to all kinds of biological data. It has been demonstrated that co-expression networks are able to effectively identify pathways and candidate biomarkers [6] or reveal gene modules representing a biological process per-turbed in a disease [7], just to name a few examples, and the similarity-based approach remains the dominant method of functional network inference today, with many recent examples: [8–12].
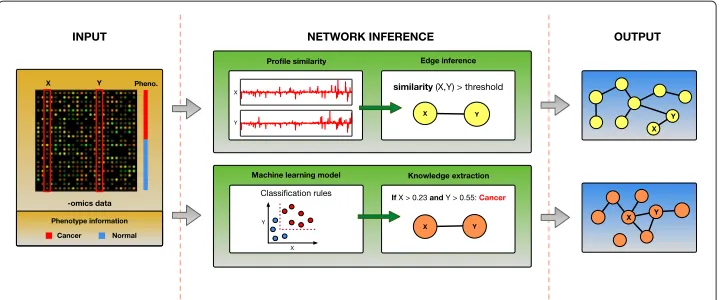
A different approach that is recently gaining popularity, is the use of machine learning techniques to infer biological networks. Due to the wide range of knowledge represen-tations used within machine learning methods (e.g. classification rules, decision trees, artificial neural networks, SVM kernels, etc.), they can discover more complex and diverse relationships, and overcome the limitations of the similarity-based methods. This is pos-sible because within machine learning models the attributes are associated not because they are similar (e.g. have similar expression profiles), but because together they detect strong patterns. In addition, if learning is supervised, it can take advantage of the addi-tional phenotype information (class labels of the samples, e.g. case and control) available with the data. Therefore, by mining the complex machine learning models, it should be possible to uncover new and different (biological) knowledge, that is likely to escape the traditional approaches. Figure 1 illustrates these differences between the two approaches (similarity-based methods vs. knowledge extraction from the machine learning models).
Alternative strategies exist to infer networks using machine learning. One approach is to train machine learning models that directly predict network edges [13], but this pro-cess requires an experimentally verified “ground truth” of known interactions and suitable controls. A different approach, which is the focus of this work, is to generate machine learning models from the biological data and thenminethe structure of the models to infer networks. Several types of machine learning have been successfully applied to this task: unsupervised learning in the form of association rules [14], supervised learning using regression (model trees [15]) or classification (random forest [16]).
Fig. 1Two approaches to functional network inference: one based on the expression profile similarity and the other based on the extraction of knowledge from machine learning models. The similarity-based methods construct a new network edgeX↔Y, when the similarity between the expressions of genesXand
Yacross the samples is above a threshold. Methods based on machine learning, first build a predictive model, in this example a rule-based model, using the samples phenotype (class labels) information and then construct a network edgeX↔Y, when genesXandYare used together within that model to classify the samples. As these two approaches lead to different functional networks, it is possible that they capture complementary knowledge
permutation test and a 2-phase learning strategy. In our previous works we applied rule-based machine learning to transcriptomics [19, 20], proteomics [21], lipidomics [22] and protein structure data [23]. We formulated a paradigm calledco-prediction(in opposition to the classic co-expression) in which the prediction rules of a classification algorithm, in our case BioHEL [24], are used to identify relationships between genes.
Co-prediction is based on the assumption that attributes (e.g. genes) within the same classification rules, due to their co-operation in predicting the sample class, have an increased likelihood of being functionally related to the biological process in ques-tion (Fig. 2). Differently than co-expression, the co-predicques-tion approach exploits the phenotype information of the data (class labels) to detect functional relations.
However, from a methodological perspective, many questions remained unanswered. Can the co-prediction approach identify known genetic relationships? How can we quan-tify the biological significance of the co-prediction networks? What is the impact of data pre-processing on the generated networks? Is this methodology able to capture knowl-edge that escapes other methods? Are the discovered functional relationships meaningful in the human disease context?
To address these questions, we propose in this article a new network inference protocol, called FuNeL (Functional Network Learning). FuNeL substantially extends our previous work [19] by incorporating: (1) statistical filtering of inferred functional relationships via permutation tests, (2) a multi-stage network generation to maximise the knowl-edge extraction, and (3) a configurable feature selection stage to control the size of the generated networks.
We first tested FuNeL’s ability to correctly identify functional relationships using a set of synthetic datasets. Then, we evaluated FuNeL on 8 real-world transcriptomics datasets related to different types of cancer. For each dataset we tested 4 different configura-tions of the protocol and compared the inferred networks to co-expression networks of equivalent size. In order to have an extensive evaluation of our approach, we employed 3 different methods to generate co-expression networks. We systematically looked at the differences between co-prediction and co-expression networks from two points of view: (1) the enriched biological terms and (2) the relationships between the genes known to be associated with a particular type of cancer. Finally, we used a prostate cancer dataset as a case study and performed a more detailed biological analysis of the enriched terms and the disease related genes. We looked at the largest hubs and the most central nodes in the prostate cancer co-prediction networks and studied their involvement in the disease. We found literature support for the association between these topologically important genes and prostate cancer, and we further confirmed it with an independent transcriptomics dataset (not used as a source in the inference process). Overall, we found that the FuNeL inferred networks: (1) capture relevant biological knowledge that is complementary to the knowledge captured by different co-expression networks, and (2) more adequately represent the relationships between genes associated with the disease targeted by each dataset.
Materials and methods
In this section we describe the proposed network inference protocol, the datasets from which we inferred the networks and the experimental design we used to evaluate it.
The functional network inference protocol
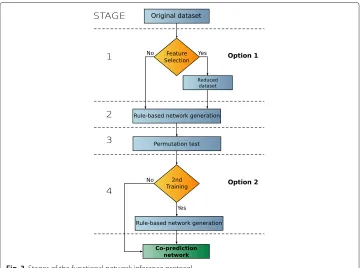
The stages of the co-prediction inference protocol are illustrated in Fig. 3. Two of these stages are optional (1 and 4), they lead to a total of 4 different protocol configurations. If the first optional stage (feature selection) is performed, the original dataset is reduced to the most relevant attributes. In the second stage a rule-based machine learning is used to infer a network. This network is statistically refined in Stage 3, in which a per-mutation test is used to filter out non-significant nodes. The final stage, in which the network generation is repeated for the second time, is again optional. A complete time complexity analysis of the FuNeL protocol is available in Section 2 of the Additional file 1: Supplementary Material.
Fig. 3Stages of the functional network inference protocol
the SVM algorithm with a linear kernel as our preliminary studies suggested that it can eliminate as much as 90 % of the original dataset attributes, without losing much of the classification accuracy (see Section 1 in Additional file 1: Supplementary Material).
Rule-based network inference (stage 2) To infer the rule-based classification models we used BioHEL [24]. It generates sets of classification rules using a genetic algorithm and is able to work with large datasets. Due to the stochastic nature of BioHEL’s learning process, each of its runs generates a different rule set. We leverage this fact by creating a large number of alternative hypotheses of functional relationships via multiple runs of the algorithm. For each dataset we run BioHEL 10,000 times and infer the network from theconsensusof all the generated rule sets. To do that, we use all the pairs of attributes that appear together in the same classification rule as the network edges (co-prediction paradigm). Then, we score each network node (attribute) by counting how many times it has been used in the rules (node score).
truly represents functional relationships. To decide if a node is statistically significant we use a typicalα=0.05 threshold.
After preliminary experiments we realised, that using significant nodes alone leads to small and dense networks. To counter that, we relaxed the node pruning to also keep all direct neighbours of the significant nodes.
Network construction (stage 4) There are two ways to interpret the result of the statis-tical test (option 2 in Fig. 3). The first approach is to use the significant nodes as a filter for the inferred relationships (edges) and remove all the edges between two non-significant nodes. The second approach is to use the permutation test as a further feature selection and build a new rule-based machine learning model using only the significant nodes. This second run of the learning algorithm is then focused only on the statistically important genes and creates the final network.
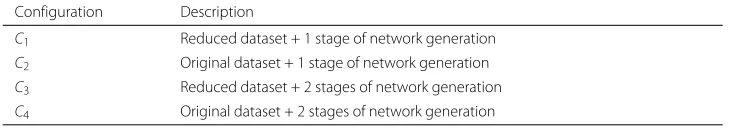
Protocol configurations As a result of two independent optional stages in the FuNeL protocol, there are 4 different configurations that it can run with (see Table 1). We decided to test them all and infer four networks from each dataset, one per configuration.
Datasets
Synthetic datasets
To verify if FuNeL is able to correctly identify functional relationships we tested it on a set of synthetic datasets. Although there are several generators that model expression data with genetic relationships, such as GNW used in several DREAM challenges [26], they generate unlabeled samples (without phenotype information, e.g. case vs. control) and the class labels are necessary to perform the supervised learning at the core of FuNeL.
For that reason, we decided to use GAMETES instance generator [27], designed to cre-ate genetic datasets with multi-locus disease associations, where no fewer thannloci can predict a phenotype (disease status). GAMETES generates genotype data (rather than gene expression data) based on models with specific genetic constraints, e.g. different heritabilities or frequencies of the SNPs.
To generate the synthetic datasets, we used a set of 2-locus configurations similar to what was employed in a recent work of Li et al. [28] to evaluate permuted random forest networks of gene interactions. Specifically, the genetic models varied in terms of heri-tability (0.001–0.4) and number of attributes (5–25), with fixed allele frequency of 0.2 and 2000 samples per dataset. For each configuration, we selected from 100 000 random mod-els, two models with extreme value of the ease of detection metric (EDM) (the least and the most difficult). Finally, for each selected model we generated 50 datasets, obtaining 4000 datasets in total.
Table 1Protocol configurations used in the experiments Configuration Description
C1 Reduced dataset + 1 stage of network generation
C2 Original dataset + 1 stage of network generation
C3 Reduced dataset + 2 stages of network generation
Real-world datasets
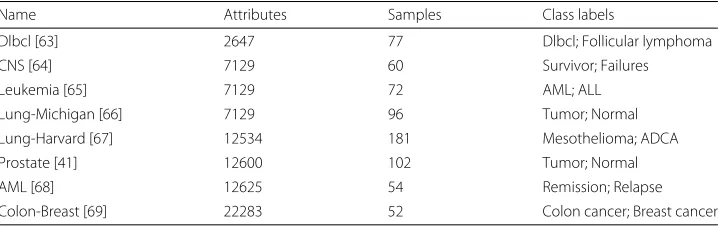
We used 8 publicly available human cancer microarray datasets (see Table 2). These datasets represent a broad range of characteristics in terms of biological information (different types of cancers), number of samples (patients) and number of attributes (genes). For each dataset the attributes were defined by the probes used in the microar-ray experiment. Generally, a gene can be represented by more than one probe and extra post-processing step is needed to merge the information and generate networks where nodes truly represent genes. We used MADGene [29] to map the Affymetrix probe IDs into HUGO gene IDs, then for all probes mapped to the same gene, we merged the probes and their connections. If a probe was unmapped it was removed from the network.
While in this instance we focused on transcriptomics datasets only, the FuNeL pro-tocol is general and can be applied to other types of biological data too (proteomics, lipidomics, etc.).
Co-expression networks
In this paper we are comparing our FuNeL networks against co-expression networks. The co-expression paradigm identifies similarity of gene expression pattern under dif-ferent experimental conditions. Co-expression edges are an abstraction of functional relationships between genes and do not represent physical binding as in protein inter-action or gene regulatory networks. Two genes are considered to be functionally related (co-expressed), if their transcript levels are similar across a set of samples.
In here we employed three well known methods to infer co-expression networks, each one uses a different metric to assess gene expressions similarity: Pearson correlation coef-ficient, ARACNE [2] and MIC [30]. In the following subsections we briefly present those methods, for more details check the cited original papers.
Pearson correlation coefficient
Pearson’s correlation coefficient (PCC) is a well known measure of linear dependence between two variables. Applied to gene expression profiles, it measures the similarity in the direction of gene response across samples. Its main disadvantages are the lack of distributional robustness (it assumes data normality) and the sensitivity to outliers. We generated the PCC-based co-expression networks using theSciPyPython library [31].
ARACNE: algorithm for the reconstruction of gene regulatory networks
The ARACNE method [2] measures the dependence between two gene expression pro-files using mutual information. Mutual informationI(X;Y)estimates entropy to quantify
Table 2Description of the source datasets used to infer networks
Name Attributes Samples Class labels
Dlbcl [63] 2647 77 Dlbcl; Follicular lymphoma
CNS [64] 7129 60 Survivor; Failures
Leukemia [65] 7129 72 AML; ALL
Lung-Michigan [66] 7129 96 Tumor; Normal
Lung-Harvard [67] 12534 181 Mesothelioma; ADCA
Prostate [41] 12600 102 Tumor; Normal
AML [68] 12625 54 Remission; Relapse
the amount of information that Y contains aboutX(measured in bits). In contrast to correlation, it is able to detect non-linear dependencies. ARACNE calculates I(X;Y) for every pair of gene expression profiles X and Y, and applies the data processing inequality to remove the majority of indirect dependencies. For each tripletX,Y and Z the weakest link is removed, e.g. the edge betweenXandY is removed ifI(X;Y) ≤ min(I(X;Z), M(Z;Y))− . The tolerance threshold is used to adjust for the vari-ance of the mutual information estimator. To generate the ARACNE based networks we used theminetR package [32] with the following parameters:estimator=mi.empirical, dis=equalwidthand=0.
MIC: maximal information coefficient
The MIC [30] is a recently proposed measure of the strength of association between two variables, closely related to mutual information. Instead of using a single discretisation strategy to bin the compared variables, it chooses individual bins for each variable, such that value of mutual informationI(X;Y)is maximised. Compared to standard estimation ofI(X;Y)value used in ARACNE, the optimised estimation provided by MIC is able to detect a wider range of non-linear associations. To generate MIC based networks we used theminepyPython library [33] with the following parameters:α=0.6 andc=15. Inference of the co-expression networks counterparts
To fairly compare the co-prediction and co-expression networks generated from the same data, we had to make sure they match in size. To do that, for every co-prediction network Cwithmedges andnnodes, we created two co-expression counterparts:
• SE(C): co-expression network withm edges
• SN(C): co-expression network withn nodes
Pearson and MIC methods directly compute the pairwise similarity between the gene expressions. Given that, we generatedSE(C)usingmgene pairs with the highest similarity coefficient. To buildSN(C)we used as many top gene pairs as needed, to reach at leastn nodes (as we included all pairs tied on the similarity value, sometimes we end up with a few nodes more).
ARACNE uses a pruning procedure and generates a weighted network, not a list of pairwise similarities. When the resulting network was smaller thanmedges ornnodes, we increased the default tolerance thresholdto obtain a large enough network. This was the case for theCNS( = 0.002) and theDlbcldatasets ( = 0.043). Then we used the edge weights to select top gene pairs, as in the case of Pearson and MIC methods.
Several examples of inferred co-prediction networks and corresponding co-expression networks are visualised in Section 7 of the Additional file 1: Supplementary Material and are accompanied, in there, by an initial analysis of selected topological properties in Section 3. All generated networks are provided in the Additional file 2.
Enrichment analysis
correction for multiple testing withα = 0.05. We searched for two categories of bio-logical knowledge: Gene Ontology (GO) terms and PANTHER pathways (176 primarily signalling pathways). From the set of GO term, we selected only the manually curated annotations that were supported by experimental evidence.
Disease association analysis
To evaluate the predictive power of the generated networks, and to assess their rel-evance within a cancer-related context, we analysed the relationships between known disease-associated genes. We used two sources for the disease associations: Malacards (a meta-database of human maladies consolidated from 64 independent sources) [35] and the union of several manually curated databases (OMIM [36], Orphanet [37], Uniprot [38] and CTD [39]). A complete list of disease-associated genes is provided in the Additional file 3.
We looked at two properties: (1) the proximity of the disease-associated genes within a network and (2) the number of triangles in a network, containing one or more disease-associated genes. Higher proximity represents stronger functional relationship between genes involved in the disease. Triangles represent groups of attributes used together across different prediction rules, and therefore indicate strong mutual relation-ship between the genes (useful in the discovery of potential new disease associations). Triangles are also the smallest non-trivial motifs that can be found in a complex network and over-represented motifs usually identify functional units of biological processes in cells [40].
The proximity of disease-associated genes was measured using the average shortest path length (SPL). The proximity was defined as a ratio of two distances: average SPL between all pairs of the non-associated genes and average SPL between all pairs of disease-associated genesA:
1 n
n
i=1
wi
SPL(CCi\A)
SPL(A) , wherewi=
|CCi|
n j=1|CCj|
As the generated networks often were disconnected (had more than 1 connected com-ponent), we introduced a weight wi that represents the relative size of a connected
componentCCi. Components with less than 3 nodes or disease-associated genes were
not used in the calculation.
Results
The main results described in this section are based on the analysis of 8 real-world datasets. The only exception is the subsection below, which reports the test results on synthetic datasets.
Identification of predefined relationships in synthetic datasets
for each model is reported in Table 3. We counted as success the presence of an edge between the interacting pair of SNPs in the inferred network.
As expected a higher success rate was obtained for models where relationships were easy to detect (H-EDM). The performance increased with higher values of heritabil-ity and 100 % success rate was obtained for heritabilheritabil-ity values above 0.05 regardless of model difficulty. The overall results are similar to those reported in [28], or even slightly better, as FuNeL’s success rate was unaffected by the increase in the number of SNPs.
Complementarity of the enriched terms
To test how unique are the biological terms (GO terms and pathways) over-represented in the inferred FuNeL networks, we measured an overlap between terms found for each type of network. We defined the overlap between terms enriched for networks inferred using configurationsCaandCbas:
O(Ca,Cb)=
c ua+ub+c
wherecis the number common terms,uais the number of unique terms forCaandub
is the number of unique terms forCb(see Additional file 4 for a complete list of enriched
terms).
Table 4 summaries the pair-wise overlap between the 4 different FuNeL configurations. For GO terms we reported the average overlap between the biological process, cellular component and molecular function categories. Although configurations that operate on the same dataset (C1–C3 andC2–C4) shared the most terms/pathways, the overlap is quite far from 100 %. Thus the remaining difference is a result of the second training stage. Configurations used on different datasets (i.e. different set of attributes) resulted in networks sharing less than 40 % GO terms and 20 % pathways.
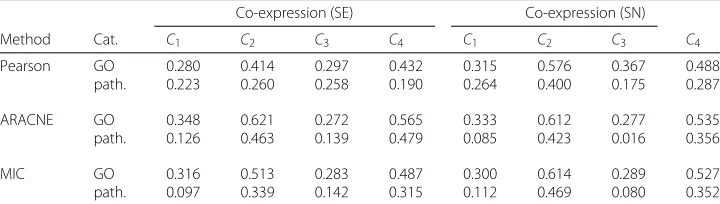
Similarly, we analysed the term overlap between co-prediction and co-expression by comparing theCinetworks with their co-expression counterpartsSE(Ci) andSN(Ci)
gen-erated with different approaches (see Table 5). We found the percentage of overlap to be similar across the different inference methods. The overlap in enriched terms was never higher than 62 % (still leading to a difference around 40 %) and was the largest for con-figuration not using feature selection (C2andC4). In general the percentages were lower for biological pathways with a minimum of only 10 % of shared terms. Low values of
Table 3FuNeL success rate in identification of disease-predicting SNPs
5 SNP 10 SNP 15 SNP 20 SNP 25 SNP
Her. L-EDM H-EDM L-EDM H-EDM L-EDM H-EDM L-EDM H-EDM L-EDM H-EDM
0.001 6 % 16 % 8 % 18 % 4 % 10 % 4 % 12 % 12 % 16 %
0.005 8 % 82 % 0 % 86 % 6 % 80 % 2 % 82 % 8 % 72 %
0.01 8 % 96 % 8 % 100 % 8 % 100 % 12 % 100 % 14 % 100 %
0.05 14 % 100 % 60 % 100 % 42 % 100 % 34 % 100 % 34 % 100 %
0.1 100 % 100 % 100 % 100 % 100 % 100 % 100 % 100 % 100 % 100 % 0.2 100 % 100 % 100 % 100 % 100 % 100 % 100 % 100 % 100 % 100 % 0.3 100 % 100 % 100 % 100 % 100 % 100 % 100 % 100 % 100 % 100 % 0.4 100 % 100 % 100 % 100 % 100 % 100 % 100 % 100 % 100 % 100 %
Table 4Average overlap of enriched GO terms and pathways between different FuNeL configurations. The overlap was averaged across all 8 datasets
Gene Ontology Pathways
C1 C2 C3 C4 C1 C2 C3 C4
C1 — 0.353 0.749 0.405 — 0.186 0.513 0.183
C2 — 0.321 0.701 — 0.095 0.591
C3 — 0.364 — 0.104
C4 — —
terms overlap indicate that the co-prediction and the co-expression approaches can be seen as complementary. Despite starting from the same dataset, they generate networks expressing different biological information.
Quantifying the amount of captured biological knowledge
The amount of biological knowledge (number of enriched terms) captured by a network is related to its size (number of nodes). To fairly compare the networks of different sizes we used the normalised Enrichment Score (ES):
ES= number of enriched terms number of nodes
The score assesses if a network contains biologically related nodes. The higher it is, the larger is a biological similarity between the nodes of a network. All computed score values are available in the Additional file 5.
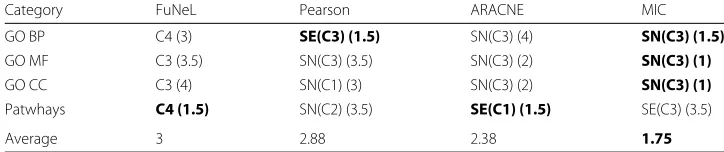
To have a global view of the performances of each inference method in term of ES, we performed a two-step analysis for each enrichment category. First, using the ES, we ranked the networks generated by each method in order to identify the best perform-ing one. See Section 4 of the Additional file 1: Supplementary Material for the complete analysis.
Once we identified the best network for each method, we ranked them together by ES and calculated their average rank across the datasets. The results of this analysis are reported in Table 6. MIC performed best when ES was calculated using the GO terms (it was ranked first in each of those categories). When ES was calculated using the biological pathways,C4and ARACNESE(C1)shared the highest rank.
Table 6 shows that the best performing networks for each method were mostlyC3 co-expression counterparts, in particularSN(C3). This is consistent with the result of the topological analysis in Section 3 of the Additional file 1: Supplementary Material were
Table 5Average overlap of enriched GO terms and pathways between the co-prediction and co-expression networks
Co-expression (SE) Co-expression (SN)
Method Cat. C1 C2 C3 C4 C1 C2 C3 C4
Pearson GO 0.280 0.414 0.297 0.432 0.315 0.576 0.367 0.488
path. 0.223 0.260 0.258 0.190 0.264 0.400 0.175 0.287
ARACNE GO 0.348 0.621 0.272 0.565 0.333 0.612 0.277 0.535
path. 0.126 0.463 0.139 0.479 0.085 0.423 0.016 0.356
MIC GO 0.316 0.513 0.283 0.487 0.300 0.614 0.289 0.527
path. 0.097 0.339 0.142 0.315 0.112 0.469 0.080 0.352
Table 6Average ranks based on the Enrichment Score for the best performing networks of each inference method
Category FuNeL Pearson ARACNE MIC
GO BP C4 (3) SE(C3) (1.5) SN(C3) (4) SN(C3) (1.5)
GO MF C3 (3.5) SN(C3) (3.5) SN(C3) (2) SN(C3) (1)
GO CC C3 (4) SN(C1) (3) SN(C3) (2) SN(C3) (1)
Patwhays C4 (1.5) SN(C2) (3.5) SE(C1) (1.5) SE(C3) (3.5)
Average 3 2.88 2.38 1.75
For each category and for each method, we report the network used in the analysis. The ranks (in brackets) were averaged across all 8 datasets, and the highest ranks are shown with bold font. The last row reports the average ranks across all the biological categories. The following abbreviations were used for GO categories: biological process (BP), molecular function (MF) and cellular component (CC)
these networks were found to have the lowest number of nodes, and suggests that smallest networks tend to be more enriched. The difference in performance between the FuNeL configurations is mainly a result of the application of the second machine learning phase (the best networks wereC3andC4).
In Additional file 1: Table S9 we reported the results of a similar analysis where we com-pared the similarity-based inference methods against FuNeL (ranks in there range from 1 to 12: 4Ci+ 4SE(Ci) + 4SN(Ci). In this pairwise analysis, FuNeL networks performed
similarly to Pearson and ARACNE. We did not observe any consistent winner across all the enrichment categories. MIC seems to have better results than FuNeL only for GO cat-egories, as emerged from Table 6, while FuNeL networks tend to be more enriched for biological pathways.
Evaluation of the networks in a disease context
To verify if the topology of the inferred networks is biologically meaningful, we analysed how it defines the relationships between genes that are known to be associated with a disease targeted by each dataset. We expected the disease-associated genes to be more closely connected than other genes and to be present in functional units, such as triangle motifs. We measured the proximity of the disease-associated genes (i.e. how closely con-nected they are compared with non-disease-associated genes) and counted the number of triangular relationships present in each network (i.e. the percentage of triangles con-taining one, two or three disease-associated genes). We repeated the two-step analysis as presented in SectionQuantifying the amount of captured biological knowledgeby using the gene-disease metrics for the ranking. The results are reported in Table 7. The detailed results for each inference method are available in Section 5 of the Additional file 1: Supplementary Material.
The average ranks, for both sources of disease associations, suggest that co-prediction outperforms the other inference paradigms. The proximity of the disease-associated genes was in general higher inC2 network. Therefore, the co-prediction paradigm has identified the core elements of the network more accurately. This result highlights the benefits of including functional information, whenever these are available, in the network inference process (FuNeL is using the class labels assigned to the samples of the dataset), in contrast to the co-expression approach solely based on gene expression similarity (unsupervised).
Table 7Average ranks based on the disease-associations for the best performing networks of each inference method
Source Category FuNeL Pearson ARACNE MIC
Curated 1A C2 (1) SN(C2) (4) SN(C3) (2.5) SN(C2) (2.5)
2A C3 (1) SN(C3) (2) SE(C2) (3) SN(C2) (4)
3A C1 (2) SN(C1) (3) SE(C4) (4) SE(C2) (1)
Proximity C2 (1) SN(C3) (2.5) SE(C4) (2.5) SE(C2) (4)
Average 1.25 2.88 3 2.88
Malacards 1A C2 (1) SN(C2) (4) SN(C4) (3) SE(C4) (2)
2A C2 (1.5) SN(C4) (4) SE(C4) (1.5) SN(C2) (3)
3A C3 (2) SN(C4) (3) SE(C2) (4) SN(C2) (1)
Proximity C2 (1) SE(C4) (4) SE(C4) (3) SE(C2) (2)
Average 1.78 3.75 2.88 2
For each category and for each method we report the network used for the analysis. The ranks (in brackets) were averaged across all 8 datasets, and the highest ranks are shown with bold font. TheAveragerow reports the average ranks across all the categories. The number of disease-associated genes participating in a triangle is denoted as 1A, 2A and 3A
that there were not many triangles with disease-associated genes, many ties affected the ranks in this category. Overall, these results demonstrate the higher predictive potential of the FuNeL networks in identifying new disease associations.
Prostate cancer case study: enriched terms
To compare in detail the difference in biological knowledge captured by the co-prediction and co-expression networks, we followed our global analysis with a case study focused on a dataset targeting a single disease — prostate cancer [41]. We were especially interested in specific knowledge captured by one paradigm but not the other.
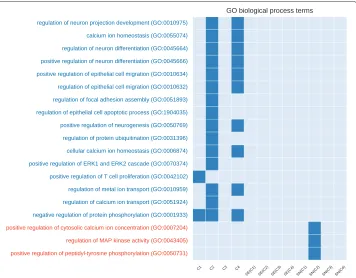
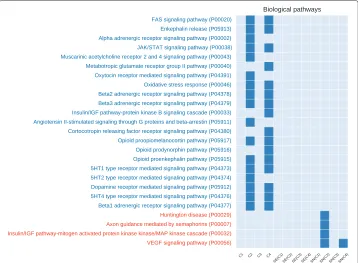
In Figs. 4 and 5 we compared the co-prediction and Pearson co-expression networks inferred from the prostate cancer dataset. We focused on unique GO terms and pathways, enriched only in one type of networks. For the sake of readability we filtered out the generic GO terms (with depth<9 in the GO hierarchical structure).C2was the network with the largest number of unique terms, followed byC4andSN(C2). We found 16 GO terms and 21 pathways unique to co-prediction networks and only 3 GO terms and 4 pathways unique to expression networks. A similar disproportion in favour of the co-prediction networks was found in comparison with MIC and ARACNE networks (see Additional file 1: Figures S2 and S3).
We found several of the unique GO terms enriched in the co-prediction networks to be related to prostate cancer. The role of theProtein ubiquinationin prostate cancer was recently analysed and showed an impact for its treatments [42].ERK pathway is involved in the motility of prostate cancer cells [43]. Prostate cancer cells seems to alter the nature of theircalcium influx to promote growth and acquire apoptotic resistance [44]. Fur-thermore, the role ofcalcium homeostasisin the majority of the cell-signaling pathways involved in carcinogenesis has been well established, prostate cancer included [45].
Fig. 4Number of unique enriched GO terms (biological process) for each network configuration (generated from the prostate cancer dataset). On the x-axis we show the 12 investigated networks. On the y-axis we show the names of enriched terms unique to co-prediction or Pearson co-expression networks.Redterms are associated with co-expression networks,bluewith co-prediction.Empty columnsindicate networks with no unique terms
Finally,FAS(also called Apo1 or CD95) plays a central role in the physiological regula-tion of programmed cell death and has been implicated in the pathogenesis of various malignancies and diseases of the immune system including prostate cancer [50].
We also performed an additional analysis of the biological terms related to the hubs (highly connected nodes) of the inferred networks. A node vwas considered to be a hub if its degree was at least one standard deviation above the mean network degree. To compare the networks, we used the 10 most frequent Gene Ontology terms (biological processes with at least depth 10) shared among each network’s hubs. When considering Pearson inference approach for co-expression we found 16 unique terms for co-prediction networks, 19 unique terms for co-expression networks and 11 common terms. The results further highlight biological terms exclusively associated either with co-prediction and co-expression networks. The complete analysis (method by method) is available in the Additional file 1: Supplementary Material (Figures S4, S5 and S6).
Fig. 5Number of unique enriched biological pathways for each network configuration (generated from the prostate cancer dataset). On the x-axis we show the 12 investigated networks. On the y-axis we show the names of enriched terms unique to co-prediction or Pearson co-expression networks.Redterms are associated with co-expression networks,bluewith co-prediction.Empty columnsindicate networks with no unique terms
In total 122 common GO terms were found between all the methods, while there was only 1 common pathway. Figure 6 further highlights the complementarity between the co-prediction and co-expression approaches in terms of captured biological knowledge.
Prostate cancer case study: disease associations
We searched the literature and the public cancer databases (not used in the inference process), to verify if key nodes in the generated networks are associated with prostate
cancer. As a measure of node importance we used the node degree (number of connec-tions) and the betweenness centrality (number of shortest paths between all pair of nodes pass through a given node).
Literature analysis We picked the top 3 most connected nodes (hubs) for each of the four co-prediction networks. The set contained six genes:GSTM2,NELL2,CFD,PTGDS, PAGE4andLMO3. All the genes from this set, exceptLMO3, were also found to be the most central nodes (with highest betweenness centrality).
Almost all these genes are related with prostate cancer:
• NELL2 contributes to alterations in epithelial-stromal homeostasis in benign prostatic hyperplasia and codes for a novel prostatic growth factor [51], and is also an indicator of expression changes in cancer samples [52],
• CFD (adipsin gene) is over expressed in PP periprostatic adipose tissue of prostate cancer patients [53],
• PTGDS (and other 2 genes) are expressed at consistently lower levels in clinical prostate cancer tissues and form a signature that predicts biochemical relapse [54],
• PAGE4 modulates androgen receptor signaling, promoting the progression to advanced lethal prostate cancer [55], and has a significantly lower expression level in patients with prostate recurrent disease [56],
• LMO3 interacts with p53, a well known gene tumour suppressor in prostate cancer [57].
The only gene without literature support wasGSTM2. It might represent a good target for further experimental verification.
Validation on independent data To further validate the biological significance of the inferred networks, we used an independent prostate cancer dataset [58] from the cBio-Portal for Cancer Genomics [59]. We analysed the top 10 hubs (nodes with highest degree) and the top 10 central nodes (with highest betweenness centrality) in the co-prediction network that better performed in the gene-disease association analysis using the curated databases:C2(see Additional file 1: Table S14). The genes with highest degree were:PTGDS,PAGE4,NELL2,GSTM2,PARM1,MAF,LMO3,COL4A6,RBP1andABL1. For the betweenness centrality, the set was almost identical, onlyRBP1was replaced by MYH11. On average the expression in samples was altered in 31.8 % cases for hubs and in 35.6 % cases for central nodes. The most altered genes were found to be downregulated at the mRNA level:COL4A6(65 %),MYH11(58 %),PARM1(53 %) andGSTM2(52 %). In addition, genomic alterations in several key genes have been found to be strongly co-occurent (e.g.PTGDS–GSTM2,PAGE4–COL4A6,PAGE4–RBP1, etc.).
Fig. 7Distribution of the percentage genomic alteration in the samples of an independent dataset for top 10 hubs and central nodes. The topologically important genes were selected from the best performing networks in the disease-association analysis on curated datasets
co-prediction network represent genes more strongly related to the prostate cancer, with over two times more frequent genomic alterations.
The detailed list of genomic alterations for top 10 hubs and top 10 central nodes for each analysed network is shown in Section 6 of the Additional file 1: Supplementary Material (Figures S7–S14).
Discussion
We proposed FuNeL, a protocol to infer functional networks based on theco-prediction paradigm where the structure of a rule-based machine learning model (in this paper the rules of a classification algorithm called BioHEL) is used to identify relationships between genes. We tested FuNeL on synthetic datasets and obtained a high success rate in identify-ing pairwise relationships between attributes. Encouraged by this result, we hypothesised that a rule-based machine learning model, with its complex knowledge representation, might be used to identify biologically meaningful relationships that escape the standard inference methods.
To test this hypothesis, we evaluated 4 different configurations of the inference pro-tocol using 8 cancer-related transcriptomics datasets. We compared FuNeL with other 3 co-expression inference methods by using networks of matching size generated from the same data. We looked at the differences, between co-prediction and co-expression, from three points of view: basic topological properties, enriched biological terms and relationships between known disease-associated genes.
Table 8Average percentage of genomic alteration for top hubs and central nodes in the independent dataset
Genes FuNeL Pearson ARACNE MIC
Hubs 31.8 % 14.2 % 12.3 % 15.2 %
The comparison of networks topology (see Section 3 of the Additional file 1: Sup-plementary Material) revealed the influence of the protocol options. Not surprisingly, both the feature selection and the second training phase reduced the size of the net-works, but at the same time, increased the clustering coefficient and the number of connections. The clustering coefficient was found to be lower in almost all the ARACNE networks, probably due to the pruning procedure, it was also lower in many MIC networks. Moreover, when feature selection was applied, the resulting networks had higher clustering coefficient than Pearson co-expression networks with the same num-ber of edges. Interestingly, all co-expression networks were less compact, with up to 3 times higher diameter for Pearson and ARACNE and up to 7 times higher for MIC.
The differences in networks topology translated to differences in contained biologi-cal information. The overlap between enriched GO terms and pathways across protocol configurations was generally low, indicating that different configurations infer net-works that capture different biological knowledge. The same terms overlap between the co-prediction networks and their equivalent co-expression counterparts was even lower, never exceeding 62 %. We interpret that as evidence, that the biological knowl-edge captured by the two paradigms is not completely redundant, but in a large part complementary.
The most apparent differences between the networks were observed during the analysis of the connections between genes known to be related to a specific disease. The disease-associated genes were more closely connected (higher proximity) in the co-prediction networks, which means that the disease-related nodes of the network were closer to its core. We also found that the number of functional units (triangle motifs), that can iden-tify new gene-disease associations, was higher in the co-prediction networks. Therefore, we conclude that the co-prediction networks better capture the abstract concept of functional relationship.
The prostate cancer case study further confirmed this conclusion. We found enriched GO terms and biological pathways, unique to the co-prediction networks, to be reported in the literature as related to prostate cancer. Furthermore, FuNeL generated networks enriched with knowledge totally missed by all the co-expression networks when using the prostate cancer dataset. We also found that genes corresponding to the topologically important nodes in the co-prediction networks: (1) were altered in a high percentage of tumour samples in an independent cancer transcriptomic study, and (2) were already associated with prostate cancer according to the specialised literature. Therefore, the co-prediction networks not only capture biological knowledge complementary to the co-expression networks, but also highlights better the important genes involved in the disease process.
Given that our co-prediction networks were found to be not only biologically mean-ingful, but also complementary to similarity-based functional networks, we believe that network inference based on machine learning models deserves to be studied in more detail in the future. In here we only touched the subject of feature selection and network post-processing, and although we now know they indeed influence the network topology and its biological interpretation, there are many strategies to choose from in that respect. At the same time, the machine learning step in the FuNeL protocol does not have to be limited to the rule-based machine learning methods. We can imagine unsupervised methods, such as the Apriori algorithm for association rule learning, or other super-vised methods, such as decision tree algorithms (e.g. C4.5 or random forest), replacing BioHEL in the FuNeL protocol. Some adjustment would be necessary to extract the knowledge from a different model representation, but the rest of the protocol could remain unchanged. For example in the case of the decision trees, relationships could be inferred between attributes that share the same path from the root to the leaves of a tree. This potential flexibility in the choice of a learning algorithm, together with the ability to apply the protocol to different types of data, becomes important in the context of results correctness. As has been discussed to a great length in [60], when methods or data used in the network inference process are tightly controlled, some results will replicate more easily than others not because they are correct, but due to a replicable bias. Therefore a diversity in methods and data is a necessary condition to be able to converge on the scientific truth.
Finally, in terms of testing new functional networks, there is a limit of how thorough and complete a manual literature analysis can be, which leads to a great need of synthetic or experimentally validated benchmarks, similar to those proposed for protein-protein inter-action networks or gene regulatory networks. Although we understand that this would be a difficult and challenging task, we see this as a necessary step on the way to refining the functional inference methods.
Conclusions
We presented FuNeL: a protocol for the inference of functional networks from rule-based machine learning models. FuNeL is based on the co-prediction paradigm, which hypoth-esises that genes used together with a rule-based machine learning model, are more likely to be functionally related. We verified that FuNeL correctly identifies relationships in synthetic datasets and we thoroughly compared FuNeL to three co-expression inference methods: Pearson correlation coefficient, ARACNE and MIC, on 8 real-world datasets. We contrasted the different approaches by looking at the inferred networks topology, enriched biological terms and the relationships between genes associated with cancer. We found that FuNeL networks capture relevant biological knowledge that is comple-mentary to what is captured by the co-expression approaches, and demonstrated that FuNeL networks are better at identifying relationships between genes with known disease associations.
Additional files
Additional file 1:Supplementary Material. Supporting information and detailed results referenced in the main text.
(PDF 5550 kb)
Additional file 2:Networks. All networks used in the analysis given as a list of edges. (XZ 11980 kb)
Additional file 3: Disease-associated genes. Complete list of the disease-associated genes for each dataset. (XZ 46 kb)
Additional file 4:Enriched terms. Complete list of enriched terms for each dataset and network. (XZ 3041 kb)
Additional file 5: Enrichment Score. Complete list of Enrichment Score values for each dataset and network. (XZ 4 kb)
Acknowledgements
We thank Joseph Mullen for the help provided in finding the gene-disease associations. This work made use of the facilities of N8 HPC Centre of Excellence, provided and funded by the N8 consortium and EPSRC [EP/K000225/1]. The Centre is co-ordinated by the Universities of Leeds and Manchester.
Funding
This work was supported by the Engineering and Physical Sciences Research Council [EP/L001489/2, EP/J004111/2, EP/I031642/2, EP/N031962/1, MR/N005872/1]. The funding agency was not involved with the design of the study, analysis and interpretation of data or in the writing of the manuscript.
Availability of data and materials
The datasets used for the analysis were derived from the following public domain resources: Dlbcl http://ico2s.org/datasets/microarray.html
CNS http://datam.i2r.a-star.edu.sg/datasets/krbd/NervousSystem/NervousSystem.html Leukemia http://datam.i2r.a-star.edu.sg/datasets/krbd/Leukemia/ALLAML.html
Lung-Michigan http://datam.i2r.a-star.edu.sg/datasets/krbd/LungCancer/LungCancer-Michigan.html Lung-Harvard http://datam.i2r.a-star.edu.sg/datasets/krbd/LungCancer/LungCancer-Harvard2.html Prostate http://datam.i2r.a-star.edu.sg/datasets/krbd/ProstateCancer/ProstateCancer.html AML http://www.biolab.si/supp/bi-cancer/projections/info/AMLGSE2191.htm Colon-Breast http://www.biolab.si/supp/bi-cancer/projections/info/BC_CCGSE3726_frozen.htm The FuNeL software is publicly available:
Project name: FuNeL
Project home page: http://ico2s.org/software/funel.html
Archived version: 10.5281/zenodo.49297
Operating system(s): GNU/Linux
Programming language: Python, R
License: GPLv3
Authors’ contributions
NL, PW, NK and JB designed the experiments. NL and PW performed the experiments. NL, PW, NK and JB analysed the data. RH and SW contributed to the biological validation of the results. NL, PW, NK and JB wrote the paper. All authors read and approved the final manuscript.
Competing interests
The authors declare that they have no competing interests.
Consent for publication
Not applicable.
Ethics approval and consent to participate
Not applicable.
Author details
1Interdisciplinary Computing and Complex BioSystems (ICOS) research group, School of Computing Science, Newcastle
University, Newcastle upon Tyne, UK.2Clinical and Experimental Pharmacology Group, Cancer Research UK Manchester
Institute, University of Manchester, Manchester, UK.3Northern Institute for Cancer Research, Medical School, Newcastle
University, Newcastle upon Tyne, UK.
Received: 11 March 2016 Accepted: 11 August 2016
References
1. Bansal M, Belcastro V, Ambesi-Impiombato A, di Bernardo D. How to infer gene networks from expression profiles. Mol Syst Biol. 2007;3(1). doi:10.1038/msb4100120.
2. Margolin A, Nemenman I, Basso K, Wiggins C, Stolovitzky G, Dalla Favera R, Califano A. Aracne: An algorithm for the reconstruction of gene regulatory networks in a mammalian cellular context. BMC Bioinforma. 2006;7(Suppl 1). doi:10.1186/1471-2105-7-S1-S7.
4. Huynh-Thu VA, Irrthum A, Wehenkel L, Geurts P. Inferring regulatory networks from expression data using tree-based methods. PLoS ONE. 2010;5(9):12776.
5. Childs KL, Davidson RM, Buell CR. Gene coexpression network analysis as a source of functional annotation for rice genes. PLoS ONE. 2011;6(7):22196. doi:10.1371/journal.pone.0022196.
6. Presson AP, Sobel EM, Papp JC, Suarez CJ, Toni W, Rajeevan MS, Vernon SD, Horvath S. Integrated weighted gene co-expression network analysis with an application to chronic fatigue syndrome. BMC Syst Biol. 2008;2(1):1–12. doi:10.1186/1752-0509-2-95.
7. Ray M, Jianhua R, Weixiong Z. Variations in the transcriptome of alzheimer’s disease reveal molecular networks involved in cardiovascular diseases. Genome Biol. 2008;9(10):148. doi:10.1186/gb-2008-9-10-r148.
8. Ransbotyn V, Yeger-Lotem E, Basha O, Acuna T, Verduyn C, Gordon M, Chalifa-Caspi V, Hannah MA, Barak S. A combination of gene expression ranking and co-expression network analysis increases discovery rate in large-scale mutant screens for novel arabidopsis thaliana abiotic stress genes. Plant Biotechnol J. 2015;13(4):501–13. doi:10.1111/pbi.12274.
9. Yang Y, Han L, Yuan Y, Li J, Hei N, Liang H. Gene co-expression network analysis reveals common system-level properties of prognostic genes across cancer types. Nat Commun. 2014;5. doi:10.1038/ncomms4231.
10. Kommadath A, Bao H, Arantes A, Plastow G, Tuggle C, Bearson S, Luo Guan L, Stothard P. Gene co-expression network analysis identifies porcine genes associated with variation in salmonella shedding. BMC Genomics. 2014;15(1). doi:10.1186/1471-2164-15-452.
11. Wei SN, Zhao WJ, Zeng XJ, Kang YM, Du J, Li HH. Microarray and co-expression network analysis of genes associated with acute doxorubicin cardiomyopathy in mice. Cardiovasc Toxicol. 20151–17.
doi:10.1007/s12012-014-9306-7.
12. Silva AT, Ribone PA, Chan RL, Ligterink W, Hilhorst HW. A predictive co-expression network identifies novel genes controlling the seed-to-seedling phase transition in arabidopsis thaliana. Plant Physiol. 2016;170(4):2218–31. doi:10.1104/pp.15.01704.
13. Mordelet F, Vert JP. Prodige: Prioritization of disease genes with multitask machine learning from positive and unlabeled examples. BMC Bioinforma. 2011;12(1):389. doi:10.1186/1471-2105-12-389.
14. Martínez-Ballesteros M, Nepomuceno-Chamorro IA, Riquelme JC. Inferring gene-gene associations from quantitative association rules. In: ISDA; 2011. p. 1241–6. doi:10.1109/ISDA.2011.6121829.
15. Nepomuceno-Chamorro IA, Aguilar-Ruiz JS, Riquelme JC. Inferring gene regression networks with model trees. BMC Bioinforma. 2010;11(1):517. doi:10.1186/1471-2105-11-517.
16. Yoshida M, Koike A. Snpinterforest: a new method for detecting epistatic interactions. BMC Bioinforma. 2011;12(1): 469. doi:10.1186/1471-2105-12-469.
17. Urbanowicz RJ, Granizo-Mackenzie A, Moore JH. An analysis pipeline with statistical and visualization-guided knowledge discovery for michigan-style learning classifier systems. IEEE Comp Int Mag. 2012;7(4):35–45. doi:10.1109/MCI.2012.2215124.
18. Urbanowicz RJ, Andrew AS, Karagas MR, Moore JH. Role of genetic heterogeneity and epistasis in bladder cancer susceptibility and outcome: a learning classifier system approach. J Am Med Inform Assoc : JAMIA. 2013;20(4):603–12. 19. Bassel GW, Glaab E, Marquez J, Holdsworth MJ, Bacardit J. Functional network construction in arabidopsis using
rule-based machine learning on large-scale data sets. Plant Cell Online. 2011;23(9):3101–16. doi:10.1105/tpc.111.088153.
20. Glaab E, Bacardit J, Garibaldi JM, Krasnogor N. Using rule-based machine learning for candidate disease gene prioritization and sample classification of cancer gene expression data. PLoS ONE. 2012;7(7):39932.
doi:10.1371/journal.pone.0039932.
21. Swan AL, Hillier KL, Smith JR, Allaway D, Liddell S, Bacardit J, Mobasheri A. Analysis of mass spectrometry data from the secretome of an explant model of articular cartilage exposed to pro-inflammatory and anti-inflammatory stimuli using machine learning. BMC Musculoskelet Disord. 2013;14(1):349. doi:10.1186/1471-2474-14-349. 22. Fainberg HP, Bodley K, Bacardit J, Li D, Wessely F, Mongan NP, Symonds ME, Clarke L, Mostyn A. Reduced
neonatal mortality in meishan piglets: A role for hepatic fatty acids? PLoS ONE. 2012;7(11):49101. doi:10.1371/journal.pone.0049101.
23. Bacardit J, Widera P, Marquez-Chamorro A, Divina F, Aguilar-Ruiz JS, Krasnogor N. Contact map prediction using a large-scale ensemble of rule sets and the fusion of multiple predicted structural features. Bioinformatics.
2012;28(19):2441–448. doi:10.1093/bioinformatics/bts472.
24. Bacardit J, Burke E, Krasnogor N. Improving the scalability of rule-based evolutionary learning. Memet Comput. 2009;1(1):55–67. doi:10.1007/s12293-008-0005-4.
25. Guyon I, Weston J, Barnhill S, Vapnik V. Gene selection for cancer classification using support vector machines. Mach Learn. 2002;46(1–3):389–422. doi:10.1023/A:1012487302797.
26. Schaffter T, Marbach D, Floreano D. Genenetweaver: in silico benchmark generation and performance profiling of network inference methods. Bioinformatics. 2011;27(16):2263–270. doi:10.1093/bioinformatics/btr373.
27. Urbanowicz RJ, Kiralis J, Sinnott-Armstrong NA, Heberling T, Fisher JM, Moore JH. Gametes: a fast, direct algorithm for generating pure, strict, epistatic models with random architectures. BioData Min. 2012;5(1):1–14.
doi:10.1186/1756-0381-5-16.
28. Li J, Malley JD, Andrew AS, Karagas MR, Moore JH. Detecting gene-gene interactions using a permutation-based random forest method. BioData Min. 2016;9(1):1–17. doi:10.1186/s13040-016-0093-5.
29. Baron D, Bihouee A, Teusan R, Dubois E, Savagner F, Steenman M, Houlgatte R, Ramstein G. Madgene: retrieval and processing of gene identifier lists for the analysis of heterogeneous microarray datasets. Bioinformatics. 2011;27(5):725–6. doi:10.1093/bioinformatics/btq710.
30. Reshef DN, Reshef YA, Finucane HK, Grossman SR, McVean G, Turnbaugh PJ, Lander ES, Mitzenmacher M, Sabeti PC. Detecting novel associations in large data sets. Science. 2011;334(6062):1518–24.
32. Meyer PE, Lafitte F, Bontempi G. minet: A r/bioconductor package for inferring large transcriptional networks using mutual information. BMC Bioinforma. 2008;9(1):1–10. doi:10.1186/1471-2105-9-461.
33. Albanese D, Filosi M, Visintainer R, Riccadonna S, Jurman G, Furlanello C. minerva and minepy: a c engine for the mine suite and its r, python and matlab wrappers. Bioinformatics. 2013;29(3):407–8. doi:10.1093/bioinformatics/bts707. 34. Thomas PD, Campbell MJ, Kejariwal A, Mi H, Karlak B, Daverman R, Diemer K, Muruganujan A, Narechania A.
Panther: A library of protein families and subfamilies indexed by function. Genome Res. 2003;13(9):2129–41. doi:10.1101/gr.772403.
35. Rappaport N, Nativ N, Stelzer G, Twik M, Guan-Golan Y, Iny Stein T, Bahir I, Belinky F, Morrey CP, Safran M, Lancet D. Malacards: an integrated compendium for diseases and their annotation. Database. 2013;2013:.
doi:10.1093/database/bat018.
36. Hamosh A, Scott AF, Amberger JS, Bocchini CA, Mckusick VA. Online Mendelian Inheritance in Man (OMIM), a knowledgebase of human genes and genetic disorders. Nucleic Acids Res. 2005;33(suppl 1):D514–D517. doi:10.1093/nar/gki033.
37. Orphanet: an online database of rare diseases and orphan drugs. Copyright, INSERM 1997. http://www.orpha.net. Accessed 20 Aug 2016.
38. Magrane M, Consortium U. Uniprot knowledgebase: a hub of integrated protein data. Database. 2011. doi:10.1093/database/bar009.
39. Davis AP, Grondin CJ, Lennon-Hopkins K, Saraceni-Richards C, Sciaky D, King BL, Wiegers TC, Mattingly CJ. The comparative toxicogenomics database’s 10th year anniversary: update 2015. Nucleic Acids Res. 2014.
doi:10.1093/nar/gku935.
40. Tran NH, Choi KP, Zhang L. Counting motifs in the human interactome. Nat Commun. 2013;4:. doi:10.1038/ncomms3241.
41. Singh D, Febbo PG, Ross K, Jackson DG, Manola J, Ladd C, Tamayo P, Renshaw AA, D’Amico AV, Richie JP, Lander ES, Loda M, Kantoff PW, Golub TR, Sellers WR. Gene expression correlates of clinical prostate cancer behavior. Cancer Cell. 2002;1(2):203–9. doi:10.1016/S1535-6108(02)00030-2.
42. Chen Z, Lu W. Roles of ubiquitination and sumoylation on prostate cancer: Mechanisms and clinical implications. Int J Mol Sci. 2015;16(3):4560. doi:10.3390/ijms16034560.
43. McCubrey JA, Steelman LS, Chappell WH, Abrams SL, Wong EWT, Chang F, Lehmann B, Terrian DM, Milella M, Tafuri A, Stivala F, Libra M, Basecke J, Evangelisti C, Martelli AM, Franklin RA. Roles of the raf/mek/erk pathway in cell growth, malignant transformation and drug resistance. Biochim Biophys Acta (BBA) - Mol Cell Res. 2007;1773(8): 1263–84. doi:10.1016/j.bbamcr.2006.10.001. Mitogen-Activated Protein Kinases: New Insights on Regulation, Function and Role in Human Disease.
44. Monteith GR. Prostate cancer cells alter the nature of their calcium influx to promote growth and acquire apoptotic resistance. Cancer Cell. 2014;26(1):1–2.
45. Flourakis M, Prevarskaya N. Insights into ca2+ homeostasis of advanced prostate cancer cells. Biochim Biophys Acta (BBA) - Mol Cell Res. 2009;1793(6):1105–9. doi:10.1016/j.bbamcr.2009.01.009. 10th European Symposium on Calcium. 46. Kwon EM, Holt SK, Fu R, Kolb S, Williams G, Stanford JL, Ostrander EA. Androgen metabolism and jak/stat pathway
genes and prostate cancer risk. Cancer Epidemiol. 2012;36(4):347–53. doi:10.1016/j.canep.2012.04.002. 47. Barton BE, Karras JG, Murphy TF, Barton A, Huang HF-S. Signal transducer and activator of transcription 3 (stat3)
activation in prostate cancer: Direct stat3 inhibition induces apoptosis in prostate cancer lines. Mol Cancer Ther. 2004;3(1):11–20. http://mct.aacrjournals.org/content/3/1/11.full.pdf+html.
48. Minelli A, Bellezza I, Conte C, Culig Z. Oxidative stress-related aging: A role for prostate cancer? Biochim Biophys Acta (BBA) - Rev Cancer. 2009;1795(2):83–91. doi:10.1016/j.bbcan.2008.11.001.
49. Khandrika L, Kumar B, Koul S, Maroni P, Koul HK. Oxidative stress in prostate cancer. Cancer Lett. 2009;282(2): 125–36. doi:10.1016/j.canlet.2008.12.011.
50. Drewa T, Wolski Z, Skok Z, Czajkowski R, Wi´sniewska H. The fas-related apoptosis signaling pathway in the prostate intraepithelial neoplasia and cancer lesions. Acta Pol Pharm. 2006;63(4):311–5.
51. DiLella AG, Toner TJ, Austin CP, Connolly BM. Identification of genes differentially expressed in benign prostatic hyperplasia. J Histochem Cytochem. 2001;49(5):669–70. doi:10.1177/002215540104900517.
52. Luo J, Dunn TA, Ewing CM, Walsh PC, Isaacs WB. Decreased gene expression of steroid 5 alpha-reductase 2 in human prostate cancer: Implications for finasteride therapy of prostate carcinoma. Prostate. 2003;57(2):134–9. doi:10.1002/pros.10284.
53. Ribeiro R, Monteiro C, Silvestre R, Castela A, Coutinho H, Fraga A, Príncipe P, Lobato C, Costa C, Cordeiro-da-Silva A, Lopes JM, Lopes C, Medeiros R. Human periprostatic white adipose tissue is rich in stromal progenitor cells and a potential source of prostate tumor stroma. Exp Biol Med. 2012;237(10):1155–62. doi:10.1258/ebm.2012.012131. 54. Thompson VC, Day TK, Bianco-Miotto T, Selth LA, Han G, Thomas M, Buchanan G, Scher HI, Nelson CC,
Greenberg NM, Butler LM, Tilley WD. A gene signature identified using a mouse model of androgen receptor-dependent prostate cancer predicts biochemical relapse in human disease. Int J Cancer. 2012;131(3): 662–72. doi:10.1002/ijc.26414.
55. Sampson N, Ruiz C, Zenzmaier C, Bubendorf L, Berger P. Page4 positivity is associated with attenuated ar signaling and predicts patient survival in hormone-naive prostate cancer. A J Pathol. 2012;181(4):1443–54.
doi:10.1016/j.ajpath.2012.06.040.
56. Shiraishi T, Terada N, Zeng Y, Suyama T, Luo J, Trock B, Kulkarni P, Getzenberg R. Cancer/testis antigens as potential predictors of biochemical recurrence of prostate cancer following radical prostatectomy. J Transl Med. 2011;9(1):153. doi:10.1186/1479-5876-9-153.
57. Larsen S, Yokochi T, Isogai E, Nakamura Y, Ozaki T, Nakagawara A. LMO3 interacts with p53 and inhibits its transcriptional activity. Biochem Biophys Res Commun. 2010;392(3):252–7. doi:10.1016/j.bbrc.2009.12.010. 58. Taylor BS, Schultz N, Hieronymus H, Gopalan A, Xiao Y, Carver BS, Arora VK, Kaushik P, Cerami E, Reva B, Antipin
59. Cerami E, Gao J, Dogrusoz U, Gross BE, Sumer SO, Aksoy BA, Jacobsen A, Byrne CJ, Heuer ML, Larsson E, Antipin Y, Reva B, Goldberg AP, Sander C, Schultz N. The cbio cancer genomics portal: An open platform for exploring multidimensional cancer genomics data. Cancer Discov. 2012;2(5):401–4. doi:10.1158/2159-8290.CD-12-0095. 60. Verleyen W, Ballouz S, Gillis J. Positive and negative forms of replicability in gene network analysis. Bioinformatics.
2016;32(7):1065–73. doi:10.1093/bioinformatics/btv734.
61. Glaab E, Baudot A, Krasnogor N, Schneider R, Valencia A. Enrichnet: network-based gene set enrichment analysis. Bioinformatics. 2012;28(18):451–7. doi:10.1093/bioinformatics/bts389.
62. Glaab E, Baudot A, Krasnogor N, Valencia A. Extending pathways and processes using molecular interaction networks to analyse cancer genome data. BMC Bioinforma. 2010;11(1):597. doi:10.1186/1471-2105-11-597. 63. Shipp MA, Ross KN, Tamayo P, Weng AP, Kutok JL, Aguiar RC, Gaasenbeek M, Angelo M, Reich M, Pinkus GS, Ray
TS, Koval MA, Last KW, Norton A, Lister TA, Mesirov J, Neuberg DS, Lander ES, Aster JC, Golub TR. Diffuse large B-cell lymphoma outcome prediction by gene-expression profiling and supervised machine learning. Nat Med. 2002;8(1):68–74. doi:10.1038/nm0102-68.
64. Pomeroy SL, Tamayo P, Gaasenbeek M, Sturla LM, Angelo M, McLaughlin ME, Kim JYH, Goumnerova LC, Black PM, Lau C, Allen JC, Zagzag D, Olson JM, Curran T, Wetmore C, Biegel JA, Poggio T, Mukherjee S, Rifkin R, Califano A, Stolovitzky G, Louis DN, Mesirov JP, Lander ES, Golub TR. Prediction of central nervous system embryonal tumour outcome based on gene expression. Nature. 2002;415(6870):436–42. doi:10.1038/415436a. 65. Golub TR, Slonim DK, Tamayo P, Huard C, Gaasenbeek M, Mesirov JP, Coller H, Loh ML, Downing JR, Caligiuri
MA, Bloomfield CD, Lander ES. Molecular classification of cancer: Class discovery and class prediction by gene expression monitoring. Science. 1999;286(5439):531–7. doi:10.1126/science.286.5439.531.
66. Beer DG, Kardia SL, Huang C-CC, Giordano TJ, Levin AM, Misek DE, Lin L, Chen G, Gharib TG, Thomas DG, Lizyness ML, Kuick R, Hayasaka S, Taylor JM, Iannettoni MD, Orringer MB, Hanash S. Gene-expression profiles predict survival of patients with lung adenocarcinoma. Nat Med. 2002;8(8):816–24. doi:10.1038/nm733.
67. Gordon GJ, Jensen RV, Hsiao LL, Gullans SR, Blumenstock JE, Ramaswamy S, Richards WG, Sugarbaker DJ, Bueno R. Translation of microarray data into clinically relevant cancer diagnostic tests using gene expression ratios in lung cancer and mesothelioma. Cancer Res. 2002;62(17):4963–967.
68. Yagi T, Morimoto A, Eguchi M, Hibi S, Sako M, Ishii E, Mizutani S, Imashuku S, Ohki M, Ichikawa H. Identification of a gene expression signature associated with pediatric aml prognosis. Blood. 2003;102(5):1849–56.
doi:10.1182/blood-2003-02-0578.
69. Chowdary D, Lathrop J, Skelton J, Curtin K, Briggs T, Zhang Y, Yu J, Wang Y, Mazumder A. Prognostic gene expression signatures can be measured in tissues collected in RNAlater preservative. J Mol Diagn. 2006;8(1):31–9. doi:10.2353/jmoldx.2006.050056.
• We accept pre-submission inquiries
• Our selector tool helps you to find the most relevant journal
• We provide round the clock customer support
• Convenient online submission
• Thorough peer review
• Inclusion in PubMed and all major indexing services
• Maximum visibility for your research
Submit your manuscript at www.biomedcentral.com/submit