R E S E A R C H
Open Access
Prediction of
Drosophila melanogaster
gene
function using Support Vector Machines
Nicholas Mitsakakis
1*, Zak Razak
2, Michael Escobar
3and J Timothy Westwood
2,4**Correspondence: [email protected]; [email protected] 1Toronto Health Economics and
Technology Assessment (THETA) Collaborative, University of Toronto, Toronto, Canada
2Canadian Drosophila Microarray
Centre, University of Toronto at Mississauga, Mississauga, Canada Full list of author information is available at the end of the article
Abstract
Background: While the genomes of hundreds of organisms have been sequenced and good approaches exist for finding protein encoding genes, an important
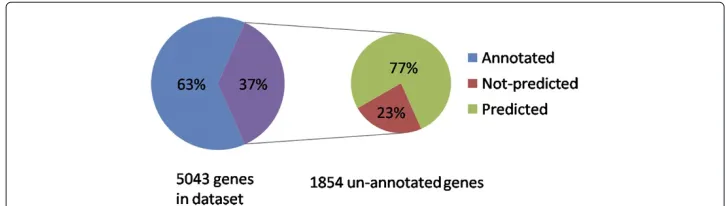
remaining challenge is predicting the functions of the large fraction of genes for which there is no annotation. Large gene expression datasets from microarray experiments already exist and many of these can be used to help assign potential functions to these genes. We have applied Support Vector Machines (SVM), a sigmoid fitting function and a stratified cross-validation approach to analyze a large microarray experiment dataset fromDrosophila melanogasterin order to predict possible functions for previously un-annotated genes. A total of approximately 5043 different genes, or about one-third of the predicted genes in theD. melanogastergenome, are represented in the dataset and 1854 (or 37%) of these genes are un-annotated.
Results: 39 Gene Ontology Biological Process (GO-BP) categories were found with precision value equal or larger than 0.75, when recall was fixed at the 0.4 level. For two of those categories, we have provided additional support for assigning given genes to the category by showing that the majority of transcripts for the genes belonging in a given category have a similar localization pattern during embryogenesis. Additionally, by assessing the predictions using a confidence score, we have been able to provide a putative GO-BP term for 1422 previously un-annotated genes or about 77% of the un-annotated genes represented on the microarray and about 19% of all of the un-annotated genes in theD. melanogastergenome.
Conclusions: Our study successfully employs a number of SVM classifiers,
accompanied by detailed calibration and validation techniques, to generate a number of predictions for new annotations forD. melanogastergenes. The applied probabilistic analysis to SVM output improves the interpretability of the prediction results and the objectivity of the validation procedure.
Keywords: Gene ontology, Support Vector Machines, Drosophila melanogaster, Gene expression data, Gene function prediction
Background
While the genomes of hundreds of organisms have been sequenced and good approaches exist for finding protein encoding genes, an important remaining challenge is predicting the functions of the large fraction of genes for which there is no annotation. For example, forDrosophila melanogaster, approximately 28% of the 14,029 predicted genes have no Gene Ontology (GO) term (either Molecular Function, Biological Process and/or Cellular Component) associated with them (including both curated and electronic annotations)
and only 58% have a GO-BP (Biological Process) term [1]. If one excludes genes that only have an electronic annotation, then only 41% have a GO-BP term [1]. Functional genomic data and in particular microarray mRNA expression data have been used by numerous researchers as a means to help predict the function of un-annotated genes. The analysis of such data is based on the premise that genes involved in a particular biological, molecular, and/or biochemical process are often co-expressed. This co-expression is dependent on the presence of common cis-regulatory elements of the co-regulated genes that bind one or more common transcription factors. A common approach to examine co-expression profiles from microarray experiment data is to use clustering analysis. In this type of anal-ysis, genes are organized and grouped based on their expression profile, with genes having similar expression pattern being “clustered” (grouped) together. The results of clustering analysis depend (a) on the metric used for comparing the expression profiles of genes that are analyzed and (b) on the clustering algorithm used. Euclidean distance and Pear-son’s correlation coefficient are two simple commonly used metrics [2]. Popular clustering algorithms are hierarchical clustering, k-means clustering and Self Organizing Maps [3].
Although clustering provides an insightful way of exploring gene co-expression pat-terns, it does not directly convey any information regarding potential functions of un-annotated genes. For that purpose, researchers have applied a further layer of analy-sis to the results of clustering, making use of additional data containing annotations of genes being analyzed. According to this type of analysis, clusters that are “enriched” for a particular gene function (i.e. they contain a larger than by chance number of genes having that function) are “assigned” that function. Subsequently, and following the “guilt-by-association” principle, all un-annotated genes in that cluster are predicted to have the same function [4-7].
In addition to the clustering analyses of genes in an unsupervised fashion and with-out annotation information, a number of supervised methods have been proposed for predicting gene functions. These methods make use of available information about the annotations of genes in order to discover gene expression patterns that characterize those annotations. Then, functional predictions for un-annotated genes are made based on how well their expression profiles are matched with “annotated” patterns. Perhaps the most popular class of supervised methods are the binary classifiers, where first, expression data are separated into two classes either having or not having a particular annotation, and then un-annotated genes are predicted of having or not having the annotation, based on which class their expression profile falls under. Examples of applications of these meth-ods include Support Vector Machines (SVM) [8,9], random forest [10], neural networks [11], factor analysis [12], logistic regression, linear discriminant and quadratic discrimi-nant analysis [13]. The application of the aforementioned approaches for gene function prediction benefits from the use of large data sets where many different experimental treatments or conditions make up the microarray expression dataset (e.g. developmen-tal time points, mutations, specific tissues, environmendevelopmen-tal conditions, drug treatments, etc.). For the most part, the studies that have tried to do large-scale gene prediction assignment have used well-known model organisms where large microarray datasets were available. These include studies inSaccharomyces cerevisiae[7,14],Arabidiopsis thaliana
network which in turn improves the robustness of the gene function predictions. These include studies inSaccharomyces cerevisiae[16],C. elegans[17],D. melanogaster[10,18] andMus musculus[19].
In this study we focus on the use of SVM for the prediction ofD. melanogastergene functions. SVM is a popular machine learning method for classification and regression. Its proven high performance as well as its solid theoretical basis justify its frequent use in many fields, including bioinformatics and predictions of gene functions. As a two-class classification tool, SVM attempts to separate the data points not in the original feature space but in an “enlarged” higher-dimensional space instead. The seemingly highly com-putationally expensive data transformation is not performed but instead, ingeniously, the separation is performed “implicitly” based on their distances measured with the use of a
kernel function. The SVM algorithm uses optimization techniques to find the surface that gives the optimal margin between the points of the two classes [20,21].
Despite its popularity in bioinformatics along with other research areas, SVM has been used for the prediction of GO-BP annotations for genes of various organisms (such as
S. cerevisiae[8] andM. musculus[9]) but not forD. melanogaster. Our study fills this gap, investigating how well this very popular method works forD. melanogaster gene expression data, in particular when the dataset is of a specific structure imposed by the nature of time-course experiments, as the one we use in our study.
Using microarray data from the life cycle of D. melanogaster[22], and a controlled vocabulary for annotation of biological processes associated withD. melanogastergenes from the Gene Ontology Consortium (GO-BP) [23], in this study we propose a method of predicting gene function of un-annotated genes in theD. melanogastergenome by using Support Vector Machines and a two-level data splitting rotation scheme for validation (double cross-validation). Our prediction method was evaluated also externally with the use of an independent dataset.
Using this approach we have been able to provide a putative GO-BP term for about 77% of the annotated genes represented in the dataset and about 19% of all of the un-annotated genes in theD. melanogastergenome helping to bridge the gap for the large number of genes that have little or no annotation. In addition, this SVM approach pro-vides a precision and probability estimate that can help guide users as to the likelihood a given gene belongs to GO annotation class.
Methods
Microarray data and annotation sources
2006. Only GO-BP categories containing a minimum of 10 and a maximum of 999 genes in the dataset were included, and 788 categories met these criteria. Clones with dupli-catecomputer gene(CG) numbers were purposely not removed as we were interested in investigating the consistency of the predictions across the duplicates.
Support Vector Machines
A Support Vector Machine (SVM) is a classification and regression method originally developed by Vapnik [21]. Given a set ofp-dimensional vector dataxi and their labels yitaking the values{−1,+1}, alinearSupport Vector Machine finds the optimal
hyper-plane that separates the “positive” from the “negative” class. This hyper-plane is maximizing the margin between the two classes. According to the mathematical formulation of the prob-lem, the solution refers to aweightvectorwand a scalarbthat satisfy the optimization problem
min||w||,yi(wTxi+b)≥1,i=1,. . .,N,
whereNis the number of samples.
When classes are overlapping and misclassifications are allowed, the above constraints become
yi(wTxi+b)≥1−ξi,ξi≥0,
(ξi)≤C,
whereξi areslackvariables and Ca constant. Solutions can be generated by using the
“Lagrange” formulation of the problem and its “Wolfe dual” problem. Given the solu-tion, the weight vectorw, for a new pointx, the functionf(x) = wTx+bis calculating the discriminant value for x, which can be used for its classification to the positive or negative class. It turns out that only a number of training points are important for the determination of the solution, thesupport vectors.
This mechanism can be applied to problems ofnon-linearseparation, after mapping the data onto a higher dimensional space, with the use of a mapping . is deter-mined by akernel K(., .)such thatK(x,y) =< (x),(y) >. The optimization problem is similar with the linear separation case, and following the Lagrange formulation and given a solution of Lagrange multipliersαi, the discriminant function is given byf(x) =
Ns
i αiyiK(x,xi)+b, wherexi,i = 1,. . .,Nsare the support vectors. It is important to
note here that the solution and discriminant function depend on the data only through the kernel, and also that the explicit expression of the mappingis not needed for the solutions. This is one of the reasons that make SVM computationally attractive. More information on SVM can be found in [27].
It is evident that SVM depends on the choice of the kernel. After performing a small set of experiments with pilot runs evaluating a number of kernel choices, we decided to use aradial basiskernel,
K(x,y)=exp{||x−y||2/σ2},
where||X|| =√<x,x>= √xTx, over a linear or polynomial kernel. Our decision was
where|C|is the size of the classCthatxbelongs to, andλa tuning parameter. For our calculations we useλ= m/2, wheremis the median value of the diagonal of the kernel matrix. For the implementation of the SVM algorithm we use the publicly available Gist package [29].
Estimation of class membership probabilities
For the translation of the discriminant valuesf(x)to posterior probabilities of class mem-bership,p(y=1|x), we use the method proposed in [30]. The author proposes a sigmoid function model, where
p(y=1|x)= 1
1+exp(a·f(x)+b),
with parametersa,b. The estimation of the parametersa,bis done by solving a maximum likelihood problem
min
a,b L(a,b),
where
L(a,b)=
N
i=1
(tilog(pi)+(1−ti)log(1−pi))
and
pi=
1
1+exp(a·fi+b)
,fi=f(xi),ti =
N++1
N++2 ifyi=1 1
N−+2 ifyi= −1
,i=1,. . .,N,
whereN+,N−are the sizes of the positive and negative class respectively.
For the sigmoid model we use the model fitting algorithm proposed by [31], which is implemented in the Gist package.
Cross-validation and performance evaluation
For each selected GO-BP category a set of annotated genes consisting from the positively annotated and a subset of the negatively annotated of size equal to up to four times the size of the positively annotated is participating in the evaluation of the SVM prediction algorithm. IfI is the index set of all these genes participating in the cross-validation, a partition{I1,I2,I3,I4}is generated, where eachIjhas equal size and equal number of
pos-itively labelled genes (to the degree that this is achievable). Two of those sets are used as “training set” for the SVM, one set is used for calibration and sigmoid fitting, and the last set is used as “test” set, where probability estimate values are output from SVM and compared with the known annotations of the genes for the evaluation of the method. For each permutation(α,β,γ,δ)of{1, 2, 3, 4}, and if genegibelongs to setIα, we denote
withpβ|γ,δ(i)the probability estimate for genegifrom an SVM classifier that was trained
with training setIγ ∪Iδand calibrated with the setIβ. Keeping the test set fixed we can
have three different ways of constructing the training and calibration sets, and there-fore each gene of the test set has three different probability estimate values. For example, for genegiinI1, we havep2|3,4(i),p4|2,3(i)andp3|4,2(i). Those three values are averaged
the distinction between the probability estimate generation for each gene that involves averaging over the three possible arrangements of training and calibration sets, and the calculation of the performance measure that is done independently for each one of the four folds (test sets), using each time only the genes of the test set.
For the calculation of precision and recall and the generation of the precision-recall plots the R package ROCR [32] was used. For the precision-recall plots, the curves corresponding to the different folds were averaged vertically (i.e. precision values were averaged for the same recall value).
Results
Gene function prediction using Support Vector Machines
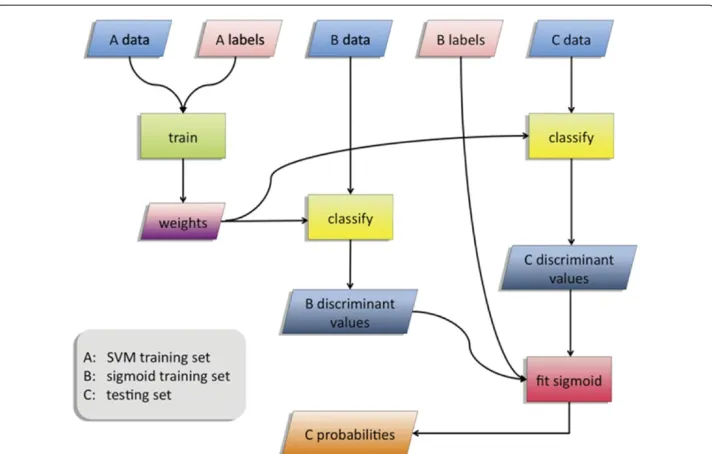
The prediction of gene functions was performed with the use of a number of SVM classi-fiers. Annotation predictions were made independently for each of 788 GO-BP categories selected based on their size (see Microarray data and annotation sources in Methods section), based on the results of an SVM classifier. Each SVM was trained with the use of a training set of data points of known labels (in this case, genes with Gene Ontology Biolog-ical Processes (GO-BP) annotation). To remedy any model fitting problem caused by the high imbalance between the positive and negative classes, for every GO-BP category and SVM classifier we limited the negative examples by randomly selecting a subset of them with a ratio of positive to negative examples being 1:4. The trained system was used for the classification of new, unlabelled data (i.e. prediction of functions for un-annotated genes). The classification was based on the discriminant value of the data point, which is output by the SVM. As the discriminant value measures the “distance” of the data point from the hyperplane that separates the two classes, traditionally points with discriminant value larger than some threshold (typically zero) are classified as positives and the rest as neg-atives. Here, we refrain from translating the discriminant values to binary classifications, but, instead, we used a previously published algorithm to estimate the posterior probabil-ity of a gene membership to each GO-BP category. The algorithm fits a sigmoid function to the discriminant values of labeled data and it uses this function to approximate pos-terior class probabilities for unlabelled data [31]. A flowchart describing the probability estimation procedure using SVM and the sigmoid fitting function is shown in Figure 1.
We validated the performance of SVM and sigmoid fitting function with the use of strat-ified cross-validation, where the initial set of known data points (positively and selected negatively annotated genes) was randomly partitioned into four equal size sets, with equal number of positively annotated genes [33]. For every possible set combination, two fourths were used as “SVM-training” set (used to train the SVM classifier), one fourth as a “sigmoid-training” set (used for fitting the sigmoid function to the discriminant val-ues) and one fourth as an overall “test” set, for which the membership probabilities were estimated. Predictions results for the latter set can then be validated, since the true labels (gene functions) are known. For more details in the cross-validation procedure used see Methods section.
For any chosen probability threshold valueptwe can calculate the corresponding pre-cisionvalue, defined as the ratio of the number of genes that have average probability estimate equal or larger thanptand belong to the class, divided by the number of genes
that have a probability estimate equal or larger thanpt (i.e. True Positives / Predicted
Figure 1 Flowchart Describing the Probability Estimation Procedure using SVM and the Sigmoid Fitting Function.First, SVM is trained using dataset A (SVM training set). Then, classification predictions (in the form of discriminant values) for dataset B (sigmoid training or tuning set) are generated. Those predictions along with the known labels of B are used for the fitting of the sigmoid function. Finally, classification results for dataset C (test set) are mapped to estimated class membership probabilities using the fitted sigmoid.
term that also have average probability estimate equal or larger than the threshold (i.e. True Positives / Total Positives). While precision gives a measure of the accuracy of the prediction, recall measures the coverage or completeness. The prediction performance of SVM for a specific GO-BP category was evaluated with the use of a measure equal to the precision value corresponding to a specific recall value (e.g. 20%, 30%, 40%). Preci-sion at 20, 30 and 40 were calculated for each fold and averaged over all four folds, and the number of categories with high performance measure values were calculated. More specifically, the method identified 39 high-precision categories reaching precision at 40 values equal or larger than 0.75. Table 1 presents these categories. Some of these cate-gories are related through ancestor-predecessor relationships and therefore have a certain amount of redundancy. (The relationship between the categories is shown in a GO graph presented in Additional file 1: Figure S1.) Taking into account these relationships as well as the size of the categories, we came up with a subset of 24 categories of minimum redundancy.
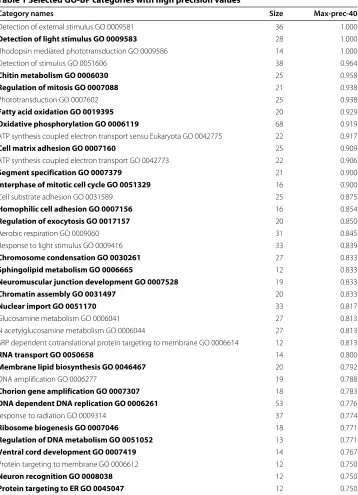
Two of the high-precision GO-BP categories,DNA-dependent DNA replication and
oxidative phosphorylation, were chosen for further analysis. Precision-recall plots were generated for both categories and presented in Figures 2A and 2B.
Table 1 Selected GO-BP categories with high precision values
Category names Size Max-prec-40
Detection of external stimulus GO 0009581 36 1.000
Detection of light stimulus GO 0009583 28 1.000
Rhodopsin mediated phototransduction GO 0009586 14 1.000
Detection of stimulus GO 0051606 38 0.964
Chitin metabolism GO 0006030 25 0.958
Regulation of mitosis GO 0007088 21 0.938
Phototransduction GO 0007602 25 0.938
Fatty acid oxidation GO 0019395 20 0.929
Oxidative phosphorylation GO 0006119 68 0.919
ATP synthesis coupled electron transport sensu Eukaryota GO 0042775 22 0.917
Cell matrix adhesion GO 0007160 25 0.909
ATP synthesis coupled electron transport GO 0042773 22 0.906
Segment specification GO 0007379 21 0.900
Interphase of mitotic cell cycle GO 0051329 16 0.900
Cell substrate adhesion GO 0031589 25 0.875
Homophilic cell adhesion GO 0007156 16 0.854
Regulation of exocytosis GO 0017157 20 0.850
Aerobic respiration GO 0009060 31 0.845
Response to light stimulus GO 0009416 33 0.839
Chromosome condensation GO 0030261 27 0.833
Sphingolipid metabolism GO 0006665 12 0.833
Neuromuscular junction development GO 0007528 19 0.833
Chromatin assembly GO 0031497 20 0.833
Nuclear import GO 0051170 33 0.817
Glucosamine metabolism GO 0006041 27 0.813
N acetylglucosamine metabolism GO 0006044 27 0.813
SRP dependent cotranslational protein targeting to membrane GO 0006614 12 0.813
RNA transport GO 0050658 14 0.800
Membrane lipid biosynthesis GO 0046467 20 0.792
DNA amplification GO 0006277 19 0.788
Chorion gene amplification GO 0007307 18 0.783
DNA dependent DNA replication GO 0006261 53 0.776
response to radiation GO 0009314 37 0.774
Ribosome biogenesis GO 0007046 18 0.771
Regulation of DNA metabolism GO 0051052 13 0.771
Ventral cord development GO 0007419 14 0.767
Protein targeting to membrane GO 0006612 12 0.750
Neuron recognition GO 0008038 12 0.750
Protein targeting to ER GO 0045047 12 0.750
Each one of these 39 categories has a fold-average precision-at-40 (i.e. that corresponds to recall value = 0.4) equal or larger than 0.75. The number of genes in the dataset annotated with a category is also shown. Bold fonts are used for the 24 GO-BP categories that show minimal redundancy with genes found in other categories.
Figure 2 Precision-recall Plots for Two of the GO- Biological Process Categories.Plots show the fold-average precision that corresponds to a recall value for (A) DNA-dependent DNA replication, and (B) oxidative phosphorylation GO categories. Vertical averaging method was used.
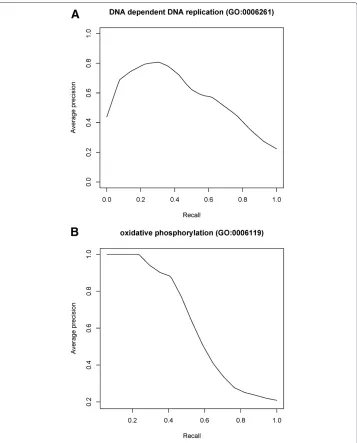
pupal stages (M00h-M48h) these genes are down-regulated and then are dramatically up-regulated in late metamorphosis (M60h) and stay high until early adulthood (Figure 3B). It should be noted that during embryogenesis and metamorphosis the organisms are not feeding or moving but during the larval and adult stages they are. Interestingly, the oxidative phorphorylation genes are up-regulated well in advance of the organisms mov-ing or feedmov-ing, suggestmov-ing that the organism is preparmov-ing itself for the next stage of the development that will require the enzyme activities to carry out this process.
Gene function predictions for un-annotated genes
Figure 3 Developmental Transcription Profiles for Two of the GO- Biological Process Categories.
The gene expression profiles of two of the GO-BP categories: (A) DNA-dependent DNA replication, and (B) oxidative phosphorylation are shown. The top portion of each of the category figures contains the expression profiles throughout development for each gene in the category in the same order as they appear in either Table 2 or 3 respectively. The bottom portion of each category represents an equal number of genes randomly selected from the expression profiles in the entire data set. Red denotes genes having
up-regulated transcription at a given time point and green down-regulated genes. The scale at the top of the figure indicates the degree of up- (in red) and down- (in green) regulation (in fold change).
Although the purpose of the sigmoid function fit method is to provide with comparable estimates, one cannot be certain that this is necessarily obtained.
We have chosen an approach that takes into account the predictive behaviour of SVM for a specific GO-BP term, when a prediction is made for an un-annotated gene, as well as it addresses the other issues mentioned above. For each gene-GO category pair a “gene precision” score is assigned to be equal to the maximum precision that can be achieved using thresholds smaller or equal to the probability estimate of the gene (output from SVM). If the gene is to be included in the “positive” predictions from SVM (and therefore to be assigned the GO-BP function), the threshold has to be such that it will give a pre-cision value for the classifier not larger than the “gene prepre-cision” score for the gene-GO category pair. This score measures how probable is for the gene to truly belong to GO-BP, given its probability estimate output from SVM, and also given the precision value of SVM for the particular category. This gene precision score is calculated separately for each one of the four folds (since for each fold probability estimates are generated for all un-annotated genes) and the four fold-specific scores are averaged.
We can then declare as gene function predictions all the gene-category pairs that have “gene precision” score equal or larger than some threshold value. More specifically, 9887 new predictions representing 1422 genes (CG numbers) were generated corresponding to a gene precision score larger than 0.75. A total of approximately 5043 different genes, or about one-third of the predicted genes in theD. melanogastergenome, are represented in the dataset. 1854 (or 37%) of these genes are un-annotated and therefore this method is providing gene function predictions for about 77% (1422/1854) of the un-annotated genes represented on the microarray and about 19% of all of the un-annotated genes in theD. melanogastergenome. A graphical representation of these results is shown in Figure 4. The complete list of the these predictions can be found in Additional file 2: Table S1.
Experimental support of predicted gene functions
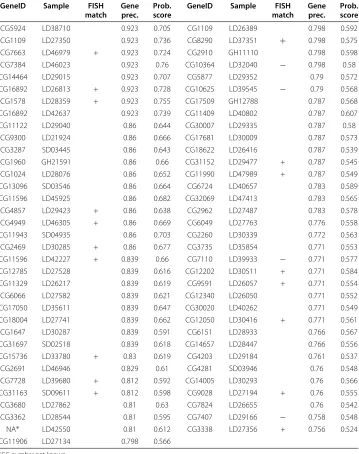
The un-annotated genes contained in two of the high-precision GO-BP categories, DNA-dependent DNA replication and oxidative phosphorylation are listed in Tables 2 and 3. For each gene, the gene precision score is indicated. The transcripts for genes involved in the same function are often co-localized within cells. Each of the genes (i.e. CG numbers) on each list was searched in aD. melanogasterFISH database [34,35] to visually examine the spatial and temporal mRNA expression for that gene during early embryogenesis.
Table 2 Gene Lists and Fluorescent In Situ Hybridization (FISH) analysis for DNA-dependent DNA replication GO-BP category
GeneID Sample FISH Gene Prob. GeneID Sample FISH Gene Prob.
match prec. score match prec. score
CG5924 LD38710 0.923 0.705 CG1109 LD26389 0.798 0.592 CG1109 LD27350 0.923 0.736 CG8290 LD37351 + 0.798 0.575 CG7663 LD46979 + 0.923 0.724 CG2910 GH11110 0.798 0.598 CG7384 LD46023 0.923 0.76 CG10364 LD32040 − 0.798 0.58 CG14464 LD29015 0.923 0.707 CG5877 LD29352 0.79 0.572 CG16892 LD26813 + 0.923 0.728 CG10625 LD39545 − 0.79 0.568 CG1578 LD28359 + 0.923 0.755 CG17509 GH12788 0.787 0.568 CG16892 LD42637 0.923 0.739 CG11409 LD40802 0.787 0.607 CG11122 LD29040 0.86 0.644 CG30007 LD29335 0.787 0.58
CG9300 LD21924 0.86 0.666 CG17681 LD30009 0.787 0.573 CG3287 SD03445 0.86 0.643 CG18622 LD26416 0.787 0.539 CG1960 GH21591 0.86 0.66 CG31152 LD29477 + 0.787 0.545 CG1024 LD28076 0.86 0.652 CG11990 LD47989 + 0.787 0.549 CG13096 SD03546 0.86 0.664 CG6724 LD40657 0.783 0.589 CG11596 LD45925 0.86 0.682 CG32069 LD47413 0.783 0.565 CG4857 LD29423 + 0.86 0.638 CG2962 LD27487 0.783 0.578 CG4949 LD46305 + 0.86 0.669 CG6049 LD27763 0.776 0.558 CG11943 SD04935 0.86 0.703 CG2260 LD30339 0.772 0.563 CG2469 LD30285 + 0.86 0.677 CG3735 LD35854 0.771 0.553 CG11596 LD42227 + 0.839 0.66 CG7110 LD39933 − 0.771 0.577 CG12785 LD27528 0.839 0.616 CG12202 LD30511 + 0.771 0.584 CG11329 LD26217 0.839 0.619 CG9591 LD26057 + 0.771 0.554 CG6066 LD27582 0.839 0.621 CG12340 LD26050 0.771 0.552 CG17050 LD35611 0.839 0.647 CG30020 LD40262 0.771 0.549 CG18004 LD27741 0.839 0.662 CG12050 LD30416 + 0.771 0.561 CG1647 LD30287 0.839 0.591 CG6151 LD28933 0.766 0.567 CG31697 SD02518 0.839 0.618 CG14657 LD28447 0.766 0.556 CG15736 LD33780 + 0.83 0.619 CG4203 LD29184 0.761 0.537
CG2691 LD46946 0.829 0.61 CG4281 SD03946 0.76 0.548
CG7728 LD39680 + 0.812 0.592 CG14005 LD30293 0.76 0.566 CG31163 SD09611 + 0.812 0.598 CG9028 LD27194 + 0.76 0.555
CG3680 LD27862 0.81 0.63 CG7824 LD26655 0.76 0.542
CG3362 LD28544 0.81 0.595 CG7407 LD29166 − 0.758 0.548 NA∗ LD42550 0.81 0.612 CG3338 LD27356 + 0.756 0.524 CG11906 LD27134 0.798 0.566
∗CG number not known
DNA-dependent DNA replication GO-BP category (along with oxidative phosphorylation) was selected for further biological validation using fluorescent in situ hybridization (FISH) analysis of earlyD. melanogasterembryos. In this table, genes that are predicted to belong to this category are shown along with information regarding their presence in the FISH database. Each of the genes (i.e. CG numbers) in the list was searched in aD. melanogasterFISH database to visually examine the spatial and temporal mRNA expression for that gene during early embryogenesis. Genes that are marked with (+) or (−) sign had images present in the database. Those that had patterns that largely matched that of known genes in the category are marked with a (+). If either their temporal or their spatial pattern did not match the known gene pattern, they are marked with (−). For each gene the “gene-precision” score and the average probability estimate output from SVM are reported.
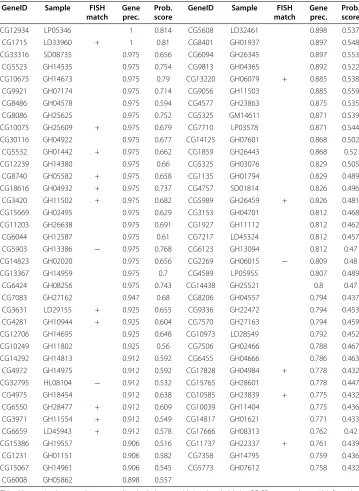
Table 3 Gene Lists and Fluorescent In Situ Hybridization (FISH) analysis for oxidative phosphorylation GO category
GeneID Sample FISH Gene Prob. GeneID Sample FISH Gene Prob.
match prec. score match prec. score
CG12934 LP05346 1 0.814 CG5608 LD32461 0.898 0.537
CG1715 LD33960 + 1 0.81 CG8401 GH01937 0.897 0.548
CG33316 SD08735 0.975 0.656 CG6094 GH26345 0.897 0.553 CG5523 GH14535 0.975 0.754 CG9813 GH04365 0.892 0.522 CG10675 GH14673 0.975 0.79 CG13220 GH06079 + 0.885 0.538 CG9921 GH07174 0.975 0.714 CG9056 GH11503 0.885 0.559 CG8486 GH04578 0.975 0.594 CG4577 GH23863 0.875 0.535 CG8086 GH25625 0.975 0.752 CG5325 GM14611 0.871 0.539 CG10075 GH25609 + 0.975 0.679 CG7710 LP03578 0.871 0.544 CG30116 GH04922 0.975 0.677 CG14125 GH07601 0.868 0.502 CG5532 GH01442 + 0.975 0.662 CG1859 GH26443 0.868 0.52 CG12239 GH14380 0.975 0.66 CG5325 GH03076 0.829 0.505
CG8740 GH05582 + 0.975 0.658 CG1135 GH01794 0.829 0.489 CG18616 GH04932 + 0.975 0.737 CG4757 SD01814 0.826 0.496 CG3420 GH11502 + 0.975 0.682 CG5989 GH26459 + 0.826 0.481 CG15669 GH02495 0.975 0.629 CG3153 GH04701 0.812 0.468 CG11203 GH26638 0.975 0.691 CG1927 GH11112 0.812 0.462 CG6044 GH12587 0.975 0.61 CG7217 LD45324 0.812 0.457 CG5903 GH13386 − 0.975 0.768 CG6123 GH13094 0.812 0.47 CG14823 GH02020 0.975 0.656 CG2269 GH06015 − 0.809 0.48 CG13367 GH14959 0.975 0.7 CG4589 LP05955 0.807 0.489
CG6424 GH08256 0.975 0.743 CG14438 GH25521 0.8 0.47
CG7083 GH27162 0.947 0.68 CG8206 GH04557 0.794 0.437 CG3631 LD29155 + 0.925 0.655 CG9336 GH22472 0.794 0.453 CG4281 GH10944 + 0.925 0.604 CG7570 GH27163 0.794 0.459 CG12706 GH14695 0.925 0.648 CG10973 LD28549 0.792 0.452 CG10249 GH11802 0.925 0.56 CG7506 GH02466 0.788 0.467 CG14292 GH14813 0.912 0.592 CG6455 GH04666 0.786 0.463 CG4972 GH14975 0.912 0.592 CG17828 GH04984 + 0.778 0.432 CG32795 HL08104 − 0.912 0.532 CG15765 GH28601 0.778 0.447 CG4975 GH18454 0.912 0.638 CG10585 GH23839 + 0.775 0.432 CG6550 GH28477 + 0.912 0.609 CG10039 GH11404 0.775 0.436 CG3971 GH11554 + 0.912 0.549 CG14817 GH01621 0.771 0.433 CG6659 LD45943 + 0.912 0.578 CG17666 GH08313 0.762 0.42 CG15386 GH19557 0.906 0.516 CG11737 GH22337 + 0.761 0.439
CG1231 GH01151 0.906 0.582 CG7358 GH14795 0.759 0.436 CG15067 GH14961 0.906 0.545 CG5773 GH07612 0.758 0.432
CG6008 GH05862 0.898 0.557
This table contains the genes that were predicted to belong to oxidative phospholylation GO-BP category along with information regarding the presence in the FISH database. Notation is similar to Table 2.
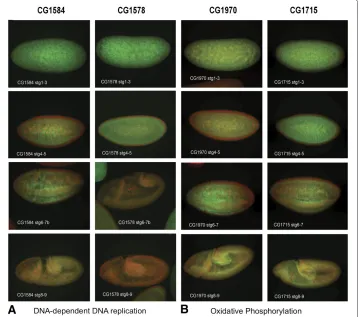
Figure 5 Fluorescent In Situ Hybridization (FISH) Images of Annotated and Un-annotated Gene mRNAs.One annotated gene and one un-annotated gene from each of the two GO-BP categories shown in Tables 2 and 3 were chosen and FISH images for those genes was retrieved from the FlyFISH database. Four different stage categories of early embryogenesis are shown. Green fluorescence represents the mRNA localization pattern for that transcript/gene and red fluorescence is showing the position of nuclei within the organism at that stage. CG1584 = Orc6, Origin recognition complex subunit 6. Its molecular function is described as DNA binding and it is involved in the biological processes: DNA replication initiation;
DNA-dependent DNA replication; chromatin silencing. CG1970- NADH dehydrogenase (ubiquinone) activity. It is involved in the biological process mitochondrial electron transport.
for gene CG1584 (Gene name = Orc6, i.e. Origin recognition complex subunit 6) has a molecular function described as DNA binding. It is involved in the following biologi-cal processes: DNA replication initiation; DNA-dependent DNA replication; chromatin silencing. The un-annotated gene, CG1578 (from Table 2), had a very similar in situ hybridization pattern (Figure 5A). For the oxidative phophorylation GO-BP category, the known gene is CG1970, annotated as having NADH dehydrogenase (ubiquinone) activity. It is involved in the biological process mitochondrial electron transport. The un-annotated gene, CG1715 (from Table 3), has an in situ hybridization pattern closely resembling the pattern seen for CG1970.
and 16 out of 19 (84%) had FISH images that were the same or very similar to the known genes belonging to the category (Table 3).
Discussion
We have applied Support Vector Machines (SVM) and a stratified cross-validation approach to analyze a large microarray experiment dataset fromD. melanogasterin order to predict possible functions for previously un-annotated genes. This approach success-fully generated a preliminary GO Biological Process annotation for a large number of these genes.
The SVM analysis, employing a sigmoid fitting function, generated annotation proba-bility values for all the genes in the dataset. Using a recall value of 40%, 39 high-precision GO-BP categories were identified and 77% of the un-annotated genes in the dataset have been assigned to one or more of these GO-BP categories. Assigning new annotations based on gene-precision scores takes into account both the overall precision of the GO-BP category, as well as the individual probability of the gene, outcome of SVM and the sigmoid function. In that way, gene predictions of high confidence can be considered even for GO-BP categories that have an overall poor precision performance.
We chose two of the high-precision GO-BP categories to validate using an independent data set (the FlyFISH database). These two categories, DNA-dependent DNA replication and oxidative phosphorylation, were selected for a number of reasons but chiefly because each contained a fairly large number of previously unannotated genes allowing for a larger number of genes that could be cross-checked in the FlyFISH database and that the GO-BP description was fairly precise allowing for the potential to examine whether the unan-notated genes are actually involved in the biological process they had been assigned to. While it could be argued that the use of FlyFISH data is perhaps too similar of a data type to be useful (i.e. is also gene transcription data), our main goal was to use data that: was from a completely independent source; had at least some data that differed in type from the original microarray data (in this case spatial data in addition to temporal data); where the raw data could be inspected independently at the gene level so that any com-puter or user assigned functional classification of the genes would not bias the validation. Given the high degree of precision that some of the unannotated genes have for belong-ing to a specific GO-BP category, especially for the oxidative phosphorylation category, we feel quite confident that a large number of these genes will be shown in the future to be directly or indirectly involved in these biological processes. Gene expression pat-tern data has been used in the past to uncover the function of a gene. In a study by Hughes and coworkers [14], a large compendium of yeast gene expression data was exam-ined for co-expression patterns using hierarchical clustering and among several findings, they discovered that a previously unannotated gene, YER044c (now ERG28), had a gene expression pattern that was highly similar to genes that were known to be involved in ergosterol biosynthesis. Further biochemical and genetic experiments supported that the gene was indeed involved in this process [14].
the GO annotation hierarchy (e.g. enzyme, metabolism) others were more detailed. Five of the more detailed GO categories reported by Arbeitman and coworkers [22] overlap with the 39 GO biological categories identified in this study including: mitochondria/electron transport; ribosome; cell cycle; cell adhesion; and phototransduction.
We attempted to compare our results with those from the study of Yan and co-workers [10], who also assigned GO terms to groups of similarly behaving genes to a dataset which in part included the data we used in our study. The authors of that study apply a differ-ent computational method (Random Forest) to a number of data sources (including gene expression data) for the prediction of GO-BP annotations. For the comparison with our study, first, predictions based on expression data only have to be extracted and, subse-quently, precision and recall measures need to be calculated using methods similar to those used in our study. There were a few issues that made the comparison between the two studies difficult. First, Yan and co-workers do not apply stratification in their 10-fold cross-validation. As a result, for some of the GO-BP categories (and the associated classifiers) there are a number of folds that contain only negative classes, and therefore classification (and calculation of precision) cannot be performed. Estimates of measures such as precision at 40 could be generated based on the remaining folds, but this prac-tice is generally not recommended as it may introduce bias [33]. Second, the number of categories that are represented in both studies (273) is much smaller than those that are represented in each study individually. If we exclude those that give folds without positively labeled representatives, we are left out with a very small number of GO-BP cat-egories for comparison. Due to these issues a strict comparison of the results from the two studies is not particularly valuable. For reference purposes we mention here that in Yan et al. study, 8 GO-BP categories gave a precision at 40 value equal or larger than 0.75 after excluding the GO terms with less than 5 folds representing both classes, while the number of selected categories dropped to 1 if we exclude those with less than 8 folds rep-resenting both classes. Also, the reported new predictions in Yan et al. involve 2062 genes at the confidence level of 0.2, 213 genes at the confidence level of 0.5 and 11 genes at the confidence level of 0.75. It should be noted, though, that the confidence level is Yan et al. study was computed differently from the gene precision score in our study and the two are not necessarily comparable.
We believe that the methods used in this study can be applied to other microarray and RNA-seq datasets. Our own experience trying this approach on other data suggests that the robustness of the results is largely dependent on both the number of array experi-ments that are in the dataset as well as on the type of experiment(s) the data represent. In this case, a developmental time course with numerous time points provided the ability to identify a large number of co-expressed genes.
Conclusions
SVM for the prediction of GO-BP annotations of un-annotated genes, providing cer-tainty estimates for those predictions, based on a method that uses the results from the cross-validation and the predictive performance of SVM for the specific GO-BP category. We believe that this is the first study that investigates the performance of SVM for GO-BP prediction forD. melanogastergenes and provides a comprehensive list of new annotation predictions that can be further researched experimentally. We believe that our study is of great value to researchers interested in computational annotation of genes, as well as to the community ofD. melanogasterresearchers.
Additional files
Additional file 1: The Parent-Child Relationship Between Ontology Biological Process Categories.
Figure showing a joined Gene Ontology graph providing an overview of the relationship between the 39 Gene Ontology Biological Process (GO-BP) categories that were identified from the output of the SVM as having a precision-at-40 value equal or larger than 0.75, as indicated in the highlighted polygonal nodes.
Additional file 2: Selected GO-BP Predictions for Previously Unannotated Genes.Table showing all new predictions with average gene-precision score equal or larger than 0.75. Detailed information on gene-precision scores and probability estimates for each one of the four folds is shown.
Abbreviations
GO-BP: Gene Ontology Biological Processes; SVM: Support Vector Machine; CG number: computer gene number.
Competing interests
The authors declare that they have no competing interests.
Authors’ contributions
NM participated in the conception and design of the study, performed the analysis of the data, participated in the creation of the figures and tables and wrote part of the manuscript. ZR pre-processed the data and participated in the creation of the figures and tables. ME participated in the conception and design of the study and revised the manuscript for critically important content. TW participated in the conception and design of the study, participated in the creation of figures and tables, wrote part of the manuscript and revised the manuscript for critically important content. All authors read and approved the final manuscript.
Acknowledgements
This work was supported by CIHR Emerging Teams Grant to M.E., J.T.W. and others. J.T.W. is also supported by an NSERC Discovery Grant. We would like to thank Sarah Gonsalves (Department of Cell and Systems Biology, University of Toronto) for helping prepare Figure 3, Eric Lècuyer and Henry Krause (Banting and Best Department of Medical Research, University of Toronto) for the use of the Fly-FISH data found in Tables 2 and 3 and Figure 5, Quaid Morris (Banting and Best Department of Medical Research, University of Toronto) for scripts to parse data from Gene Ontology, Han Yan for making available the data used in the Yan et al. study [10] and William Noble (Departments of Genome Sciences and of Computer Science and Engineering, University of Washington) for personal communication about the SVM algorithm.
Author details
1Toronto Health Economics and Technology Assessment (THETA) Collaborative, University of Toronto, Toronto, Canada. 2Canadian Drosophila Microarray Centre, University of Toronto at Mississauga, Mississauga, Canada.3Dalla Lana School of Public Health, University of Toronto, Toronto, Canada.4Department of Cell and Systems Biology, University of Toronto at Mississauga, Mississauga, Canada.
Received: 12 June 2012 Accepted: 11 February 2013 Published: 2 April 2013
References
1. Tweedie S, Ashburner M, Falls K, Leyland P, McQuilton P, Marygold S, Millburn G, Osumi-Sutherland D, Schroeder A, Seal R, Zhang H, the Fly Base Consortium:FlyBase: enhancing Drosophila Gene Ontology annotations. Nucl Acids Res2009,37:D555–D559.
2. Eisen MB, Spellman PT, Brown PO, Botstein D:Cluster analysis and display of genome-wide expression patterns.Proc Natl Acad Sci USA1998,95:14863–14868.
3. Tibshirani R, Hastie T, Eisen M, Ross D, Botstein D, Brown P:Clustering methods for the analysis of DNA microarray data.Tech. rep., Department of Statistics, Stanford University, Stanford, California; 1999. 4. Marcotte EM, Pellegrini M, Thompson MJ, Yeates TO, Eisenberg D:A combined algorithm for genome-wide
prediction of protein function.Nature1999,402:83–86.
6. Tavazoie S, Hughes JD, Campbell MJ, Cho RJ, Church GM:Systematic determination of genetic network architecture.Nat Genet1999,22:281–285.
7. Wu LF, Hughes TR, Davierwala AP, Robinson MD, Stoughton R, Altschuler S:Large-scale prediction of Saccharomyces cerevisiae gene function using overlapping transcriptional clusters.Nat Genet2002,
31:255–265.
8. Brown MP, Grundy WN, Lin D, Cristianini N, Sugnet CW, Furey TS, M Ares J, Haussler D:Knowledge-based analysis of microarray gene expression data by using support vector machines.Proc Natl Acad Sci USA2000,97:262–267. 9. Zhang W, Morris QD, Chang R, Shai O, Bakowski MA, Mitsakakis N, Mohammad N, Robinson MD, Zirngibl R,
Somogyi E, Laurin N, Eftekharpour E, Sat E, Grigull J, Pan Q, Peng WT, Krogan N, Greenblatt J, Fehlings M, van der Kooy D, Aubin J, Bruneau BG, Rossant J, Blencowe BJ, Frey BJ, Hughes TR:The functional landscape of mouse gene expression.J Biol2004,3:21.
10. Yan H, Venkatesan K, Beaver J, Klitgord N, Yildirim M, Hao T, Hill D, Cusick M, Perrimon N, Roth F, Vidal M:A genome-wide gene function prediction resource for Drosophila melanogaster.PLoS ONE2010,5:e12139. 11. Mateos A, Dopazo J, Jansen R, Tu Y, Gerstein M, Stolovitzky G:Systematic learning of gene functional classes
from DNA array expression data by using multilayer perceptrons.Genome Res2002,12:1703–1715. 12. Kustra R, Shioda R, Zhu M:A factor analysis model for functional genomics.BMC Bioinformatics2006,7:216. 13. Lan H, Carson R, Provart NJ, Bonner AJ:Combining classifiers to predict gene function in Arabidopsis thaliana
using large-scale gene expression measurements.Bioinformatics2007,8:358.
14. Hughes TR, Marton MJ, Jones AR, Roberts CJ, Stoughton R, Armour CD, Bennett HA, Coffey E, Dai H, He YD, Kidd MJ, King AM, Meyer MR, Slade D, Lum PY, Stepaniants SB, Shoemaker DD, Gachotte D, Chakraburtty K, Simon J, Bard M, Friend SH:Functional discovery via a compendium of expression profiles.Cell2000,102:109–126.
15. Zhang W, Zou S, Song J:Term-tissue specific models for prediction of gene ontology biological processes using transcriptional profiles of aging in Drosophila melanogaster.BMC Bioinformatics2008,9:129. 16. Lee I, Li Z, Marcotte EM:An improved, bias-reduced probabilistic functional gene network of baker’s yeast,
Saccharomyces cerevisiae.PLoS ONE2007,2:e988.
17. Lee I, Lehner B, Crombie C, Wong W, Fraser A, Marcotte E:A single gene network accurately predicts phenotypic effects of gene perturbation in Caenorhabditis elegans.Nat Genet2008,40:181–188.
18. Costello JC, Dalkilic MM, Beason SM, Gehlhausen JR, Patwardhan R, Middha S, Eads BD, Andrews JR:Gene networks in Drosophila melanogaster: integrating experimental data to predict gene function.Genome Biol2009,
10:R97.
19. Pena-Castillo L, Tasan M, Myers CL, Lee H, Joshi T, Zhang C, Guan Y, Leone M, Pagnani A, Kim WK, Krumpelman C, Tian W, Obozinski G, Qi Y, Mostafavi S, Lin GN, Berriz GF, Gibbons FD, Lanckriet G, Qiu J, Grant C, Barutcuoglu Z, Hill DP, Warde-Farley D, Grouios C, Ray D, Blake JA, Deng M, Jordan MI, Noble WS, Morris Q, Klein-Seetharaman J, Bar-Joseph Z, Chen T, Sun F, Troyanskaya OG, Marcotte EM, Xu D, Hughes TR, Roth F:A critical assessment of Mus musculus gene function prediction using integrated genomic evidence.Genome Biol2008,9:S2.
20. Noble WS:What is a support vector machine?Nat Biotechnol2006,24:1565–1567. 21. Vapnik V:Statistical Learning Theory. New York: Wiley-Interscience; 1998.
22. Arbeitman MN, Furlong EE, Imam F, Johnson E, Null BH, Baker BS, Krasnow MA, Scott MP, Davis RW, White KP:
Gene expression during the life cycle of Drosophila melanogaster.Science2002,297:2270–2275.
23. The Gene Ontology Consortium:Gene ontology: tool for the unification of biology.Nat Genet2000,25:25–29. [http://www.geneontology.org].
24. Stanford Microarray Database[http://smd.stanford.edu]. 25. Gene Expression Omnibus[http://www.ncbi.nlm.nih.gov/geo/].
26. FlyBase: A Database of Drosophila Genes & Genomes[http://flybase.org].
27. Burges CJC:A tutorial on support vector machines for pattern recognition.Data Min Knowl Dis1998,2:121–167. 28. Veropoulos K, Campbell C, Cristianini N:Controlling the sensitivity of support vector machines.InProceedings of
the International Joint Conference on AI. San Francisco: Morgan Kaufmann Publishers; 1999:55–60. 29. Gist: Support vector machine and kernel principal components analysis, Version 2.0.9
[http://www.bioinformatics.ubc.ca/gist]
30. Platt J:Probabilistic outputs for support vector machines and comparison to regularized likelihood methods.InAdvances in Large Margin Classifiers. Edited by Smola A, Bartlett P, Schölkopf B, Schuurmans D. Cambridge, MA: The MIT Press; 2000.
31. Lin HT, Lin CJ, Weng RC:A note on Platt’s probabilistic outputs for support vector machines.Mach Learn2007,
68:267–276.
32. Sing T, Sander O, Beerenwinkel N, Lengauer T:ROCR: visualizing classifier performance in R.Bioinformatics2005,
21:3940–3941.
33. Forman G, Scholz M:Apples-to-apples in cross-validation studies: pitfalls in classifier performance measurement.ACM SIGKDD Explorations Newsl2010,12:49–57.
34. Fly-FISH: A database of Drosophila embryo mRNA localization patterns[http://fly-fish.ccbr.utoronto.ca] 35. Lécuyer E, Yoshida H, Parthasarathy N, Alm C, Babak T, Cerovina T, Hughes TR, Tomancak P, Krause HM:Global
analysis of mRNA localization reveals a prominent role in organizing cellular architecture and function. Cell2007,131:174–187.
doi:10.1186/1756-0381-6-8
Cite this article as:Mitsakakiset al.:Prediction ofDrosophila melanogastergene function using Support Vector