M E T H O D O L O G Y
Open Access
A fast forward 3D connection algorithm
for mitochondria and synapse segmentations
from serial EM images
Weifu Li
1,2, Jing Liu
2, Chi Xiao
2, Hao Deng
3, Qiwei Xie
4,5*and Hua Han
2,6,7**Correspondence:
4Data Mining Lab, Beijing University of Technology, 100 Ping Le Yuan, 100124 Beijing, China
2Institute of Automation, Chinese Academy of Sciences, 95 Zhongguancun East Road, 100190 Beijing, China
Full list of author information is available at the end of the article
Abstract
Background: It is becoming increasingly clear that the quantification of mitochondria and synapses is of great significance to understand the function of biological nervous systems. Electron microscopy (EM), with the necessary resolution in three directions, is the only available imaging method to look closely into these issues. Therefore, estimating the number of mitochondria and synapses from the serial EM images is coming into prominence. Since previous studies have achieved preferable 2D segmentation performance, it holds great promise to obtain the 3D connection relationship from the 2D segmentation results.
Results: In this paper, we improve upon Matlab’s functionbwconncompand propose a fast forward 3D connection algorithm for mitochondria and synapse segmentations from serial EM images. To benchmark the performance of the proposed method, two EM datasets with the annotated ground truth are produced for mitochondria and synapses, respectively. Experimental results show that the proposed method can achieve the preferable connection performance that closely matches the ground truth. Moreover, it greatly reduces the computational burden and alleviates the memory requirements compared with the functionbwconncomp.
Conclusions: The proposed method can be deemed as an effective strategy to obtain the 3D connection relationship from serial mitochondria and synapse segmentations. It is helpful to accurately and quickly quantify the statistics of the numbers, volumes, surface areas, and lengths, which will greatly facilitate the data analysis of neurobiology research.
Keywords: 3D connection, EM images,Bwconncomp, Mitochondria, Synapse
Background
Recently, due to the rapid development of neuroscience, considerable attention has been paid for the statistics of the numbers, volumes, surface areas, and lengths of sub-cellular structures in the brain, allowing neuroscientists to compare these objects in healthy animals and those with degenerative brain diseases [1]. It acts as an important role in studying the sub-cellular structures and their implied behaviors of nervous systems [2]. Among these structures, mitochondria and synapses are of particular interest to neuro-science [3]. Indeed, mitochondria, known as the powerhouse of the cell, have been proven
to carry out all types of important cellular functions by producing the overwhelming majority of cellular adenosine triphosphate (ATP) [4]. Meanwhile, they also take substan-tial responsibility for the regulation of cellular life and death, as well as disease states. For example, mitochondrial dysfunction has been directly linked to the aging process, which is the largest single risk factor for Alzheimer Disease [5,6]. In addition, synapses, known as the information transmitters, permit a neuron to pass an electrical or chemical signal to another neuron in the mammalian nervous system. Mounting evidence also indicates that synaptic plasticity has a close link with learning and memory. To be specific, sen-sory experience, motor learning and aging are found to induce alterations in presynaptic axon boutons and postsynaptic dendritic spines [7,8]. Consequently, the quantification of mitochondria and synapses is of great significance to the prevention and treatment of brain diseases.
The above researches provide the motivation for looking closely into these issues in a nervous system, and image analysis techniques as an important approach are widely adopted. For image acquisition, electron microscopy (EM), with sufficiently high res-olution on the nanoscale, can provide not only the details of intra-cellular structures but also the synapses and gap junctions. In particular, focused ion beam scanning elec-tron microscopy (FIB-SEM) [9] can provide an isotropic resolution up to 5nmin three directions, and automated tape-collecting ultramicrotome scanning electron microscopy (ATUM-SEM) [10] can offer an anisotropic voxel (4nm×4nm×30nm) with a low res-olution in thezdirection. However, the FIB-SEM technique is limited to a small volume while the ATUM-SEM technique does not suffer from the limitation and can be applied to a large volume for the statistics and analysis [11]. To extract the invaluable structural information (mitochondria and synapses) from the serial EM images, substantial effort has been recently put into developing specialized algorithms for accurate segmentation of mitochondria and synapses. For some representative results, Lucchi et al. [12] clustered groups of similar voxels into regularly spaced supervoxels and incorporated mitochon-drial shape features to an automated graph partitioning scheme for segmentation. On this base, they [13] introduced context-based features and modelled mitochondrial mem-branes for improvement. Staffler et al. [14] presented a method for automated detection of synapses, which focused on classifying borders between neuronal processes as synaptic or non-synaptic. Neila et al. [3] proposed an automated approach for both mitochondria and synapses that involved anisotropy-aware regularization via conditional random field inference and surface smoothing techniques to improve the segmentation and visualiza-tion. Moreover, due to the powerful representation capability of deep neural network, Xiao et al. [15] put forward a fusion fully convolutional network for mitochondrial seg-mentation and a fully connected conditional random field to optimize the segseg-mentation results. Santurkar et al. [16] took a compositional approach to segment synapses by train-ing lighter networks to model the simpler marginal distributions of membranes, clefts and vesicles.
of ongoing research. Consequently, our aim in this paper is to develop a fast and effective 3D connection algorithm based on these segmentation results. The main contributions can be roughly grouped in two different directions.
• Methods:Since the shapes of mitochondria and synapses have great differences in EM images, we propose a new similarity indicator that takes the shape into consideration. It could accurately measure the probability that the segmentation results belong to the same 3D mitochondrion or 3D synapse. In addition, we propose a forward connection mode that can effectively handle the problems of split and merge. This connection mode can be generalized to serial detection results, but not limited to serial segmentation results.
• Data:We benchmark the performance of the proposed method against a previously unreleased corpus of manually annotated data. The corpus consists of two EM datasets acquired by the ATUM-SEM technique and the ground truth of mitochondria and synapses are manually annotated by 2-3 independent labelers, respectively. Both the EM datasets and manual annotations are released to the community providing a valuable tool for benchmarking.
The subsequent sections of this study present the detailed information about the datasets, the proposed connection algorithm, the experimental results, the meaningful discussions and conclusions.
Materials
In this paper, the biological specimens were selected from mouse cortex and the ATUM-SEM technique was adopted for image acquisition. The datasets were collected from a water bath using a custom designed tape-collection conveyor belt in the Institute of Neu-roscience, Chinese Academy of Sciences, where several slices with thicknesses of more or less 50nmwere cut automatically. Next, these sections were imaged through SEM (Zeiss Supra55) in the Institute of Automation, Chinese Academy of Sciences, where the pixel size was set at 2nmand the dwell time was set at 2μs. Since the datasets acquired by the ATUM-SEM technique were unregistered, the image registration method applied in [17] was adopted in this paper. After registration, two ATUM-SEM datasets are used to construct the corresponding databases for mitochondria and synapses, respectively.
Mitochondria dataset
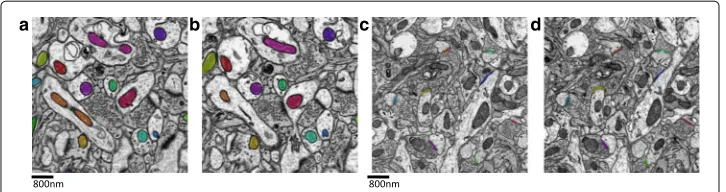
The mitochondria dataset consists of 31 slices with a resolution of 2×2×50nm3/voxel, and each slice has a size of 8416×8624 [18]. The ground truth were prepared via the hand segmentation outlining the mitochondrial membrane by two labelers with cross val-idation. A total of 473 mitochondria including the incomplete ones were annotated with the plugin TrakEm2 in software ImageJ [19]. Figure 1a-bpresent the acquired images and annotated mitochondria in the adjacent slices, where different mitochondria are represented by different colors. To accelerate the neurobiology research, we share the mitochondria dataset and the annotated ground truth publicly available in the website1.
Synapse dataset
a b c d
Fig. 1aandb: adjacent ATUM-SEM images with the mitochondria annotated by different colors;candd: adjacent ATUM-SEM images with the annotated synapses
consists of 178 slices with the resolution 2×2×50nm3/voxeland size 8576×7616 [15]. The ground truth were prepared via the hand segmentation outlining the synaptic junc-tions by three labelers with cross validation. A total of 1230 synapses were annotated by different colors. Figure1c-dpresent the acquired images and annotated synapses in the adjacent slices. Also, the synapse dataset and the annotated ground truth are provided publicly available in the website2.
It is worthwhile to emphasize that creating such two databases requires a considerable amount of human effort, and it is a considerably time-consuming process which also jus-tifies that previous endeavors on computerized segmentation are of great significance for the neurobiology research.
Methods
As mentioned above, the EM images with high resolution will inevitably produce large data even at small neural circuit. From a practical point of view, it is time consuming and memory consuming to directly measure the similarity of segmentations in the adja-cent slices. Therefore, we propose a fast coarse-to-fine connection algorithm instead. The main motivation is given by the following axiom.
Axiom 1:Lets1ands2be the segmentations, andd1andd2be the regions satisfying s1⊂d1ands2⊂d2. Then ifd1d2= ∅,s1s2= ∅.
This axiom indicates that we can use the bounding boxes containing the segmenta-tions for screening to reduce the computation cost. The proposed connection algorithm is divided into four steps: coarse screening, validation, fine connection and skip connection. The detailed procedures are summarized in the following subsections.
Coarse screening
On basis of the 2D segmentation results, we first obtain the corresponding bounding boxes by the Matlab’s functionregionprops. Assume that there arenslices and each slice haskisegmentationsi=1, 2,· · ·,n, and thepth segmentation in theith slice is denoted by matrixsipand its bounding box is denoted by coordinate vectorXpi, the coarse similarity ci
pq of segmentationssip and siq+1is measured by the Intersection-over-Union (IoU) of bounding boxesXpi andXqi+1:
cipq:=IoUXpi,Xiq+1= A
Xpi ∩Xqi+1
A
Xi p∪Xqi+1
Here,AXi p∩Xqi+1
andAXi p∪Xqi+1
denote the areas of the intersection and union
ofXpi andXqi+1, respectively. Since the intersection is empty with high probability when XipandXqi+1belong to the different 3D structures, it is clear thatcpqi , p=1,· · ·,ki, q= 1,· · ·,ki+1are almost zeros. Therefore, we can use a sparse matrixCito denote the coarse connection relation between theith slice and thei+1th slice as follows:
Ci= ⎛ ⎜ ⎜ ⎜ ⎜ ⎜ ⎝ ci
11 ci12 · · · ci1ki+1 ci21 ci22 · · · ci2k
i+1 ..
. ... . .. ... cik
i1 c i ki2 · · · c
i kiki+1
⎞ ⎟ ⎟ ⎟ ⎟ ⎟ ⎠
, i=1, 2,· · ·,n−1. (2)
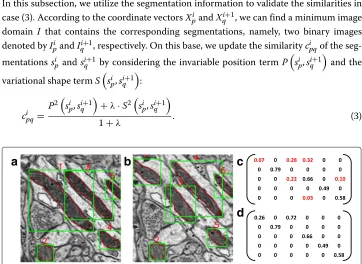
According to axiom 1, the position information provided by the bounding box is only a necessary condition, it may produce superfluous connections. As illustrated in Fig.2c, the connection matrix cannot accurately reflect the connection relationship between the segmentations in Fig.2a-b. Note that a larger similaritycipqmeans a higher probability that the segmentationssipandsiq+1belong to the same 3D structure. Two thresholds 0≤ Tl ≤Th≤1 are adopted to judge whether thesipandsiq+1are connected. Three cases are listed as below:
(1) Ifci
pq∈[Th, 1], there exists a connection between thesipandsiq+1;
(2) Ifcipq∈[ 0,Tl), there exists no connection between thesipandsiq+1. Setcipq=0; (3) Ifcipq∈[Tl,Th), there may be a connection between thesipandsiq+1, which needs to
be validated as marked in red in Fig.2c(Tl=0.01andTh=0.4are used).
Validation
In this subsection, we utilize the segmentation information to validate the similarities in case (3). According to the coordinate vectorsXipandXqi+1, we can find a minimum image domain I that contains the corresponding segmentations, namely, two binary images denoted byIi
pandIqi+1, respectively. On this base, we update the similaritycipqof the seg-mentationssipandsiq+1by considering the invariable position termPsip,siq+1and the
variational shape termS
sip,siq+1
:
cipq= P2si
p,siq+1
+λ·S2si p,siq+1
1+λ . (3)
a
b
c
d
Here,λ≥0 is a regularization parameter for balance.Psi p,siq+1
characterizes the
invari-ance of segmentationssipandsiq+1, and is defined by the IoU of the corresponding binary imagesIpi andIqi+1:
P
sip,siq+1
=IoU
Ipi,Iqi+1
. (4)
In contrast, Ssi p,siq+1
characterizes the variability of segmentations si
p and siq+1. Assume that the essential transformation h : sip −→ sqi+1 has the form h = hαhβ, hα(x) = αx(scaling), and hβ(x) = x +β (translation) [20]. Then given a set ofH transformationsH= {h1,h2,· · ·,hH},S
sip,siq+1
is defined by:
Ssip,sqi+1=maxPhksip,siq+1k=1, 2,· · ·,H. (5)
After updating all the similarities in case (3), we can obtain new connection matrices Ci,i=1, 2,· · ·,n−1. For example, the similarities marked in red in Fig.2care validated and the updated matrix is shown in Fig. 2d. It is clear that the updated matrix effec-tively eliminates the false connections. Then, another thresholdTs∈[ 0,Th)is adopted to determine the fine connection matrices:
Bi=Ci>Ts,i=1, 2,· · ·,n−1. (6)
Fine connection
For each binary connection matricesBi,i=1, 2,· · ·,n−1, the sum of thepth rowRip(p= 1, 2,· · ·,ki)implies thatspi connects withRipsegmentations in thei+1th slice, and the sum of theqth columnNi+1
q (q=1, 2,· · ·,ki+1)implies thatNqi+1segmentations in the ith slice connects withsi+1
q . Based on this fact, we propose a forward connection mode instead of the iterative bidirectional connection mode in [21]. The details are divided into three steps.
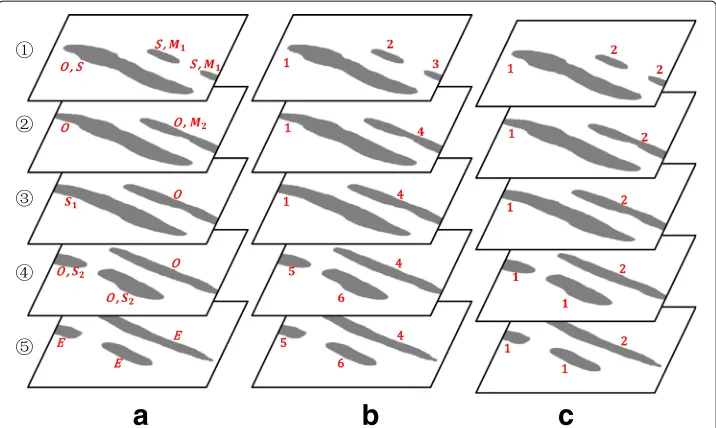
Firstly, we assign several categories to each segmentation according to theRipandNqi+1 as illustrated in Fig.3a. These categories includeOne-to-one(O),Start(S),End(E),Split1 (S1),Merge1(M1),Split2(S2) andMerge2(M2). For clarity of presentation, we provide a simplified matrix ofBiin Table1. The five general connection cases are listed as follows: (1) sinceRi1= N1i+1 =1, we assignOto the first segmentation in theith slice; (2) since Ri2 = 0, we assignEto the second segmentation in theith slice; (3) sinceN4i+1 = 0, we assignS to the fourth segmentation in thei+1th slice; (4) sinceR3i = 2 andN2i+1 = N3i+1 = 1, we assignS1to the third segmentation in theith slice andS2to the second and the third segmentations in thei+1th slice; (5) sinceRi4 = R5i = 1 andN5i+1 = 2, we assignM1to the fourth and the fifth segmentations in theith slice andM2to the fifth segmentation in thei+1th slice. Moreover,Sis assigned to each segmentation in the first slice andEis assigned to each segmentation in the final slice. It should be noted that each segmentation may have two or more categories as shown in Fig.3a.
Secondly, we assign an initial label to each segmentation according to the categories as illustrated in Fig.3b. Specifically, we first denote the segmentation sets with categoryO, with categoryS, with categoryE, with categoryS1, with categoryM1, with categoryS2 and with categoryM2in theith slice asOi,Si,Ei,S1i,M1i,S2i andMi2, respectively. Then we begin with each segmentations∈SiSi
2
a
b
c
Fig. 3A schematic diagram of the proposed connection mode.aassigning several categories to each segmentation;bassigning an initial label to each segmentation;creassigning the same label to the segmentations in case of split and merge
Thirdly, we reassign the same label to the segmentations in case of split and merge as illustrated in Fig.3c. Specifically, for each segmentations1∈M1i
Si1,i=1, 2,· · ·n−1, we first obtain the label j1of s1 and the label j2 of the connected segmentations2 ∈ M2i+1Si2+1 in the i +1 slice by Bi. Then, we reassign the label min{j1,j2} to these segmentations with labelsj1andj2.
Remark 1By this connection mode, we assign different labels to these segmentations. Whenλ = 0, Ts = Td2 = 0, the coarse-to-fine connection method has the same per-formance as the Matlab’s function bwconncomp, which judges whether the segmentation results are connected by the specified connectivity for the connected components.
Skip connection
The matricesBi,i=1, 2,· · ·,n−1, only characterize the connection relationship in the adjacent slices. However, it is usually hard to prevent wrinkle and damage from sample preparation and imaging in practice. Additionally, a minority of objects are difficult to be identified because they sometimes do not exhibit their typical characteristics on a certain slice. Therefore, the connection relationship in the skipped slices should also be considered. Based on the above considerations, we first calculate the coarse connection matrices as:
Table 1A simplified matrix ofBiwith five general connection cases
Category −− Split2 Split2 Start Merge2
One-to-one 1 0 0 0 0
End 0 0 0 0 0
Split1 0 1 1 0 0
Merge1 0 0 0 0 1
Ci2= ⎛ ⎜ ⎜ ⎜ ⎜ ⎜ ⎝
ci112 ci122 · · · ci12k
i+2 ci212 ci222 · · · ci22k
i+2 ..
. ... . .. ... cik2
i1 c i2
ki2 · · · c i2
kiki+2 ⎞ ⎟ ⎟ ⎟ ⎟ ⎟ ⎠
,i=1, 2,· · ·,n−2, (7)
where thecipq2,p= 1, 2,· · ·,ki, q = 1, 2,· · ·,ki+2is the coarse similarity ofsipandsiq+2. Then, we focus on each pair of segmentationssip∈Eiandsqi+2∈Si+2. Ifcipq2 >0, update theci2
pqby formula (3) and judge the connectivity by thresholdTs. Ifcipq2 > Ts, reassign a new label min{j1,j2}to the segmentations with labelsj1andj2, wherej1andj2are the labels ofsipandsiq+2, respectively.
The proposed method is sketched in the following Algorithm 1. By using the proposed algorithm, we divide the whole segmentations into several disjoint sets, which satisfies that the segmentations in the same set belong to the same 3D object while these in the different sets belong to different 3D objects.
Algorithm 1:A Fast Forward 3D Connection Algorithm Input: Series segmentation results in 2D.
Output: Labeled segmentations.
1 Obtain the coarse connection matricesCi,i=1, 2,· · ·n−1 andCi2,i=1, 2,· · ·n−2. 2 UpdateCiand obtain the fine connection matricesBi,i=1, 2,· · ·n−1.
3 Obtain the categories of each segmentation fromBi,i=1, 2,· · ·n−1.
4 Denote the segmentation sets with different categories in theith slice asOi,Si,Ei,Si1,M1i, Si2andM2i,i=1, 2,· · ·n.
5 Initializej=1. 6 fori=1 :ndo
7 foreach segmentation s∈SiSi2Mi2do 8 Assign a labeljtos.
9 whiles∈Oido
10 Find the connected segmentations1byBi;
11 Assign the same labeljtos1and sets=s1,i=i+1;
12 end
13 j=j+1.
14 end
15 end
16 fori=1 :n−1do
17 foreach segmentation s1∈M1iSi1do
18 Obtain the labelj1ofs1and the labelj2of the connected segmentations2byBi;
19 Reassign the label min{j1,j2}to these segmentations with labelsj1andj2;
20 end
21 end
22 fori=1 :n−2do
23 foreach pair of segmentations
spi ∈Ei,sqi+2∈Si+2do 24 ifCi2(p,q) >0then
25 Update thecipq2 by formula (3);
26 ifcipq2 >Tsthen
27 Obtain the labelj1ofsipand the labelj2ofsiq+2;
28 Reassign the label min{j1,j2}to these segmentations with labelsj1andj2;
29 end
30 end
31 end
Results
In this section, we conduct several experiments to evaluate the performance of the pro-posed algorithm on the above mentioned datasets. The connection capacity is measured by two fundamental performance indicators,split errorandmerge error[22]. Here, the split error means that a true 3D object is regarded as several 3D objects, which often occurs when large objects sometimes split into two or more connected components. In contrast, themerge errormeans that several true 3D objects are regarded as a whole 3D object and it will occur when a group of structures close to each other often merge in a single connected component [3].
Performance comparison
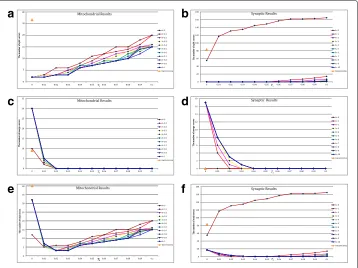
The parameters in the proposed algorithm have a huge impact on the final connection performance. For example, a largerTltends to produce split errors and a smallerThtends to produce merge errors. To guarantee a better connection performance, a relatively small thresholdTl=0.01 and a relatively large thresholdTh=0.4 are chosen for coarse screen-ing although it will take more time for verification. The choice of parameterλdepends on the size of the segmentation results. In the mitochondria experiments, since the diameter of mitochondria is commonly between 0.75 and 3μm[23], the segmentation results that belong to the same 3D mitochondrion usually have large overlap in the adjacent slices. Thenλis set from 0 to 1 with step size 0.1 to satisfy that the position term in (3) is the dominant contribution for the similarity measure. In the synapse experiments, the mean cleft width of wild-type synapses is 22±0.5nmbetween the pre- and postsynaptic neu-rons [24,25]. Due to the offsets and differences in the adjacent slices, the segmentation results that belong to the same 3D synapse usually have small or even no overlaps. Then λis set from 0 to 10 with step size 1 to satisfy that the shape term in (3) is the dominant contribution. Meanwhile, we adjust the thresholdTsfrom 0 to 0.1 with step size 0.01. The number of split errors, the number of merge errors and the number of total errors of the proposed method at varying thresholdsλandTsare illustrated in Fig.4a-b,c-dande-f, respectively, where the results of the functionbwconncompare also presented as baseline for comparison. Several useful conclusions can be drawn from Fig.4.
Firstly, the step ‘skip connection’ in the proposed method is capable of reducing the number of split errors.As mentioned in Remark 1, the functionbwconncompis a special case of the proposed method. Specifically, adding the step ‘skip connection’ to the functionbwconncomphas the same performance as the proposed method atλ = 0 and Ts=0. As shown in Fig.4a-b, the step ‘skip connection’ can greatly reduce the split errors compared with the functionbwconncomp. That is because the functionbwconncomponly finds the connected components in the adjacent slices and splits a 3D object into two connected components when the information is missing. In contrast, our approach avoids this shortcoming by the step ‘skip connection’.
Secondly, the suitable parameters λand Ts play an important role in the final
a
c
e
b
d
f
Fig. 4aandbthe number of split errors of the functionbwconncompand the proposed method at varying thresholdsλandTs;canddthe number of merge errors;eandfthe number of total errors
addition, as another thresholdTs for determining the fine connection, a largeTs tends to produce split errors while a smallTs tends to produce merge errors. Similarly, com-pared with Ts = 0 (function bwconncomp) in Fig. 4c-d, the choice Ts > 0 greatly reduces the number of merge errors. Taking these factors into consideration, the sug-gested parameters areλ ∈ (0.4, 0.6),Ts ∈ (0.02, 0.03)for the mitochondria dataset and λ∈(1, 3),Ts∈(0.03, 0.05)for the synapse dataset, respectively as shown in Fig.4e-f.
Thirdly, the proposed method achieves the near-human performance in obtaining the 3D connection relationship.Given the suggested parameters, there are only three split errors on the mitochondria dataset, and the optimal case without split error and merge error is achieved on the synapse dataset. Note that the proposed method achieves the optimal performance for a wide range of thresholds in Fig.4e-f. The robustness is demonstrated.
To have a visual presentation, we provide the specific connection results of the pro-posed method on the mitochondria dataset and the synapse dataset in Fig.5, where these segmentations that belong to the same 3D object are described by the same colors. It is clear that the proposed connection algorithm can effectively handle the problems of split and merge (Fig.5).
Running time comparison
a
b
Fig. 5aandbthe specific connection results of the proposed method
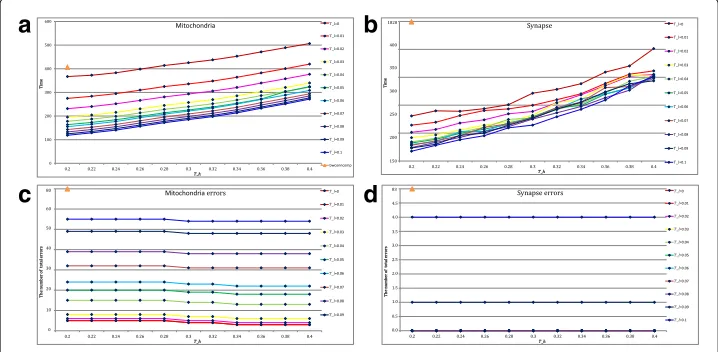
with step size 0.01 and thresholdTh from 0.2 to 0.4 with step size 0.02 are adjusted to estimate the time consumption. Figure6a-bpresent the time consumption of the function bwconncompand the proposed method at varying thresholds for comparison. Meanwhile, the corresponding connection performance is also provided for referencing in Fig.6c-d. Several useful conclusions can be drawn from Fig.6.
Firstly, the suitable parametersTh andTl reduce the time consumption as well
as keep the preferable performance.From Fig. 6, it is obvious that a largerTh and a smallerTl will take more time for computation on the both datasets. Note that the number of errors does not decrease whenTh ≥ 0.34,Tl ≤ 0.01 for the mitochondria dataset, andTh ≥0.2,Tl ≤0.07 for the synapse dataset, the suggested parameter inter-val areTh ∈ (0.34, 0.4),Tl ∈ (0, 0.01) andTh ∈ (0.2, 0.3),Tl ∈ (0, 0.07), respectively. For a detailed representation, the time consumption of the functionbwconncompand the proposed method at several suggested parameters are provided in Table2.
Secondly, the proposed method is more computationally efficient than the
func-tionbwconncomp.From Table2, we can see that the proposed method only needs an
average of 300s to obtain the connection results while the functionbwconncompneeds
a
c
b
d
Table 2The time consumption of the functionbwconncompand the proposed method at several suggested parameters
Mitochondria dataset Synapse dataset
bwconncomp 398s bwconncomp 1815s
Th=0.40,Tl=0.01 419s Th=0.26,Tl=0.01 240s
Th=0.38,Tl=0.01 400s Th=0.24,Tl=0.01 231s
Th=0.36,Tl=0.01 382s Th=0.22,Tl=0.01 219s
Th=0.34,Tl=0.01 364s Th=0.20,Tl=0.01 214s
398s on the mitochondria dataset and 1815s on the synapse dataset. It is because the size of synapse dataset is 6 times larger than that of mitochondria dataset and the function bwconncompobtains the connected components by handling with each pixel. However, the proposed method uses the thresholdsTlandThfor coarse screening and only com-putes the region of interest instead of the whole image, which reduces the computation cost.
Memory comparison
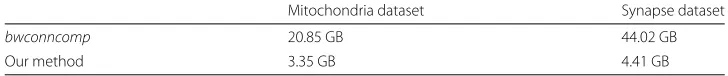
In this subsection, we present the memory requirement of the functionbwconncompand the proposed method in Table3. It can be seen that the memory requirement of the pro-posed method is less than 1/6 of the functionbwconncompon the mitochondria dataset and approximately 1/10 of the functionbwconncompon the synapse dataset, respectively. It is mainly because the input of functionbwconncompmust be the total serial segmen-tation results, i.e., the memory requirement is closely related to the data size. In contrast, the proposed method only needs to read two images repeatedly for calculating the con-nection matrices. The memory requirement is determined by these sparse concon-nection matrices, which is independent of the data size. It indicates that the proposed method does not suffer from the common problem “Out of Memory” caused by large dataset.
Information sharing
All codes are written in Matlab Version R2016b (Math Works, Inc.). The mitochon-dria experiments are performed on a personal computer with an i7-4790 MQ 3.60 GHz Intel processor, 32 GB RAM and Windows operating system. Since the error “Out of Memory” happens when the functionbwconncompis tested on the synapse dataset, the synapse experiments are performed on a public server with an i7-4820 MQ 2.00 GHz Intel processor, 512 GB RAM and Windows operating system. The codes are available online3.
Discussion
This present research is primarily motivated by the need to accurately obtain the statistics of mitochondria and synapses from serial EM images, which helps the neuroscientists to quickly quantify these objects in healthy and diseased animals. Since previous researches have achieved preferable performance on 2D segmentations [3,15,16,18,26], this paper has proposed a fast and effective method to obtain the 3D connection relation. To validate
Table 3The memory requirement of the functionbwconncompand the proposed method
Mitochondria dataset Synapse dataset
bwconncomp 20.85 GB 44.02 GB
the effectiveness of the proposed method, we produce two ATUM-SEM datasets with the annotated ground truth for mitochondria and synapses, respectively. Experimental results show the superiority of the proposed method on the connection performance, running time and memory requirement over the functionbwconncomp.
Because the proposed method only depends on the shapes and distribution of the objects, it indicates that the proposed method can also achieve a robust 3D connec-tion performance for other subcellular structures, such as the endoplasmic reticulum, Golgi apparatus, and microtubules. Because all these structures are sparsely distributed in the EM images, relatively smaller parametersTl = 0.01,Th = 0.2 can be adopted for reducing the time consumption. Meanwhile, the shapes of endoplasmic reticulum and microtubules are narrow as the synapses, and the shapes of Golgi apparatus are ellip-tical as the mitochondria. The suggested parameters can beλ = 2,Ts = 0.03 for the endoplasmic reticulum and microtubules, andλ=0.5,Ts=0.02 for the Golgi apparatus.
Despite the promising results of the proposed method, several problems still deserve further research. The most important concern is that the connection performance usually relies heavily on the segmentation results. However, previous segmentation algorithms [3, 15, 16, 18, 26] almost focus on the lower pixel-wise prediction error (pixel error). Unfortunately,pixel errorconsiders only whether or not a given pixel is correctly classi-fied as the object, without concern for the ultimate effect on the connection performance. For example, expanding, shrinking or translating the object between two slices would not cause splits or mergers, but incur a large pixel error. Further, while a gap of even a single pixel in the object between two slices would cause a merge error, it might only incur a very small pixel error [27]. Thus, further research on segmentation algorithms should take other indicators such as therand error[28],warping error[29] into consider-ation. In addition, a good connection method is expected to be more robust to different segmentation results. The generalization performance of the proposed method should be further validated on the results obtained by state-of-the-art segmentation algorithms. Future research will focus on using the 3D connection relation for optimizing the local misleading segmentation. As another concern, the effectiveness of the proposed method may owe to the characteristic that both the mitochondria and synapses are sparsely dis-tributed in EM images. More future investigations along the present line will validate the generalization performance of the proposed method on the dense neuron segmentations. In addition, since it will yield more split errors and merge errors when the number of segments is large, some normalized benchmarks like “rand index” will be added for the split-merge error analysis.
Conclusion
Endnotes
1http://95.163.198.142/MiRA/mitochondria31/
2http://95.163.198.142/MiRA/synapse178/
3https://github.com/WeifuLi/A-Fast-Forward-Connection-Algorithm
Abbreviations
ATP: Adenosine triphosphate; ATUM-SEM: Automated tape-collecting ultramicrotome scanning electron microscopy; EM: Electron microscopy; FIB-SEM: Focused ion beam scanning electron microscopy; IoU: Intersection-over-Union
Acknowledgements
The authors would like to thank Dr. Yu Kong, Yang Yang and Danqian Liu (Institute of Neuroscience, CAS) for their assistance with preparation and sectioning of the sample. Also, we would like to thank Mr. Lixin Wei and his colleagues (Institute of Automation, CAS) for the Zeiss Supra55 SEM and technical support.
Funding
The financial support of National Natural Science Foundation of China (NO. 61673381, NO. 11771130, NO. 61871177, NO. 41501392, NO. 61701497), Science and Technology Development Fund of Macau (044/2015/A2), Scientific Instrument Developing Project of Chinese Academy of Sciences (NO. YZ201671), Bureau of International Cooperation, Chinese Academy of Sciences (NO. 153D31KYSB20170059), and Special Program of Beijing Municipal Science & Technology Commission (NO. Z161100000216146) is appreciated.
Availability of data and materials
The data and source code in this paper are available online.
Author’s contributions
Conceived and designed the experiments: WL, JL, Performed the experiments: WL, CX, HD, Analyzed the data: WL, QX, HH, Contributed materials: QX, HH.
Ethics approval and consent to participate Not applicable.
Consent for publication Not applicable.
Competing interests
The authors declare that they have no competing interests.
Publisher’s Note
Springer Nature remains neutral with regard to jurisdictional claims in published maps and institutional affiliations.
Author details
1Faculty of Mathematics and Statistics, Hubei University, 368 Youyi Road, 430062 Wuhan, China.2Institute of Automation, Chinese Academy of Sciences, 95 Zhongguancun East Road, 100190 Beijing, China.3Faculty of Information Technology, Macau University of Science and Technology, Avenida Wai Long,Taipa, Macau, China.4Data Mining Lab, Beijing University of Technology, 100 Ping Le Yuan, 100124 Beijing, China.5Research Base of Beijing Modern Manufacturing Development, 100 Ping Le Yuan, 100124 Beijing, China.6Center for Excellence in Brain Science and Intelligence Technology Shanghai Institutes for Biological Sciences, Chinese Academy of Sciences, 320 Yue Yang Road, 200031 Shanghai, China.7School of Future Technology, University of Chinese Academy of Sciences, 19 Yuquan Road, 100190 Beijing, China.
Received: 27 July 2018 Accepted: 26 September 2018
References
1. Yang Y, Liu D, Huang W, Deng J, Sun Y, Zuo Y, Poo MM. Selective synaptic remodeling of amygdalocortical connections associated with fear memory. Nat Neurosci. 2016;19(10):1348–55.
2. Liu T, Jones C, Seyedhosseini M, Tasdizen T. A modular hierarchical approach to 3d electron microscopy image segmentation. J Neurosci Methods. 2014;226(8):88–102.
3. Márquez NP, Baumela L, González-Soriano J, Rodríguez JR, Defelipe J, Merchán-Pérez A. A fast method for the segmentation of synaptic junctions and mitochondria in serial electron microscopic images of the brain. Neuroinformatics. 2016;14(2):1–16.
4. Mcbride HM, Neuspiel M, Wasiak S. Mitochondria: More than just a powerhouse. Curr Biol. 2006;16(14):551–60. 5. Roychaudhuri R, Yang M, Hoshi MM, Teplow DB. Amyloidβ-protein assembly and alzheimer disease. J Biol Chem.
2009;284(8):4749–53.
6. Floudas CS, Um N, Kamboh MI, Barmada MM, Visweswaran S. Identifying genetic interactions associated with late-onset alzheimer’s disease. BioData Min. 2014;7(1):35.
7. Hofer SB, Mrsicflogel TD, Bonhoeffer T, Hubener M. Experience leaves a lasting structural trace in cortical circuits. Nature. 2009;457(7227):313–7.
9. Knott G, Marchman H, Wall D, Lich B. Serial section scanning electron microscopy of adult brain tissue using focused ion beam milling. J Neurosci. 2008;28(12):2959–64.
10. Hayworth KJ, Kasthuri N, Schalek R. Automating the collection of ultrathin serial sections for large volume tem reconstructions. Microsc Microanal. 2006;12:86–7.
11. Briggman KL, Bock DD. Volume electron microscopy for neuronal circuit reconstruction. Curr Opin Neurobiol. 2012;22(1):154–61.
12. Lucchi A, Smith K, Achanta R, Knott G, Fua P. Supervoxel-based segmentation of mitochondria in em image stacks with learned shape features. IEEE Trans Med Imaging. 2012;31(2):474–86.
13. Lucchi A, Becker C, Neila PM, Fua P. Exploiting enclosing membranes and contextual cues for mitochondria segmentation. In: Medical Image Computing and Computer Assisted Intervention. Cambridge: Springer; 2014. p. 65–72.
14. Staffler B, Berning M, Boergens KM, Gour A, Smagt PVD, Helmstaedter M. Synem, automated synapse detection for connectomics. Elife. 2017;6:26414.
15. Xiao C, Li W, Chen X, Han H, Q X. An effective fully deep convolutional neural network for mitochondria segmentation based on atum-sem. In: SPIE Medical Imaging. Orlando: SPIE; 2018. p. 105740.
16. Santurkar S, Budden D, Matveev A, Berlin H, Saribekyan H, Meirovitch Y, Shavit N. Toward streaming synapse detection with compositional convnets. arXiv preprint arXiv:1702.07386. 2017.
17. Li X, Ji G, Chen X, Ding W, Sun L, Xu W, Han H, Sun F. Large scale three-dimensional reconstruction of an entire caenorhabditis elegans larva using autocuts-sem. J Struct Biol. 2017;20(2):87–96.
18. Li W, Deng H, Rao Q, Xie Q, Chen X, Han H. An automated pipeline for mitochondrial segmentation on atum-sem stacks. J Bioinforma Comput Biol. 2017;15(3):1750015.
19. Schmid B, Schindelin J, Cardona A, Longair M, Heisenberg M. A high-level 3d visualization api for java and imagej. BMC Bioinforma. 2010;11:1–7.
20. Li H, Wei Y, Li L, Chen CLP. Hierarchical feature extraction with local neural response for image recognition. IEEE Trans Cybern. 2013;43(2):412–24.
21. Hu J, Xiao C, Shen L, Xie Q, Chen X, Han H. Automatical detecting and connecting the mitochondria from the serial em images. In: IEEE International Conference on Mechatronics and Automation. Takamatsu: IEEE; 2017. p. 1632–7. 22. Berning M, Boergens KM, Helmstaedter M. Segem: Efficient image analysis for high-resolution connectomics.
Neuron. 2015;87(6):1193–206.
23. Wiemerslage L, Lee D. Quantification of mitochondrial morphology in neurites of dopaminergic neurons using multiple parameters. J Neurosci Methods. 2016;262:56–65.
24. Kandel ER, Schwartz JH, Jessell TM. Principles of neural science, 4th edn. McGraw-Hill. xli. 2000;50(6):823–39. 25. Arce KPD, Schrod N, Metzbower SWR, Allgeyer E, Kong GKW, Tang A, Krupp AJ, Stein V, Liu X, Bewersdorf J.
Topographic mapping of the synaptic cleft into adhesive nanodomains. Neuron. 2015;88(6):1165–72. 26. Xiao C, Li W, Deng H, Chen X, Yang Y, Xie Q, Han H. Effective automated pipeline for 3d reconstruction of
synapses based on deep learning. BMC Bioinforma. 2018;19(1):263–80.
27. Argandacarreras I, Turaga SC, Berger DR, Ciresan D, Giusti A, Gambardella LM, Schmidhuber J, Laptev D, Dwivedi S, Buhmann JM. Crowdsourcing the creation of image segmentation algorithms for connectomics. Front Neuroanat. 2015;9:142.
28. Unnikrishnan R, Pantofaru C, Hebert M. Toward objective evaluation of image segmentation algorithms. IEEE Trans Pattern Anal Mach Intell. 2007;29(6):929–44.