Asian Journal of Pharmaceutical Research and Development
(An International Peer-Reviewed Journal of Pharmaceutical Research and Development)www.ajprd.com
ISSN 2320-4850
Research Article
DEVELOPMENT AND VALIDATION OF STABILITY
INDICATING RP-HPLC ASSAY METHOD FOR
SIMULTANEOUS ESTIMATION OF RABEPRAZOLE SODIUM
AND ACECLOFENAC IN CAPSULE DOSAGE FORM
S. D. Harugade, M. A. Nagras*
Department of Pharmaceutical Chemistry, Sinhgad College of Pharmacy, Vadgaon (Bk.), Pune - Maharashtra,
India
Received: 22June 2013, Revised and Accepted: 2 July 2013
ABSTRACT
A simple, rapid, and precise Reverse Phase HPLC method has been developed for determination of Rabeprazole Sodium (RBP sodium) and Aceclofenac (ACE) in combined Dosage form. The RP-HPLC method carried out on Hypersil BDS C18 (150 mm x 4.6 mm, 5µm) as stationary phase by using mobile phase consisting of 0.02M Phosphate buffer (pH 6with orthophosphoric acid) : acetonitrile (67:33). Mobile phase was maintained at a flow rate 1.0 ml/min. The UV detector was operated at 280nm. Retention time was found to be 4.3min for RBP Sodium and 5.9 min for Aceclofenac. The specificity studies shows that the analyte peaks were well resolved from the intermediates. Developed method was found to be linear over the range of 100-300µg/ml and 10-30µg/ml for Aceclofenac and Rabeprazole Sodium respectively; the correlation coefficient was found to be 0.9995 and 0.9995 for Aceclofenac and Rabeprazole Sodium. The precision study showed that the percentage relative standard deviation was within the range of acceptable limits, and the mean recovery was found to be 100.45 % and 99.63 % for Aceclofenac and Rabeprazole Sodium respectively. Statistical analysis proves that the method is reproducible & selective for the estimation of said drug, as the method could effectively separate the drug from its degradation product.
Key words: RP-HPLC, Rabeprazole Sodium, UV detector, Aceclofenac
INTRODUCTION
abeprazole sodium is a Proton Pump Inhibitor having the chemical name of
2-[4-methoxypropoxy3methyl-
2-pyridinyl]- methyl] sulfinyl]-1- H-
benzimidazole Sodium[1].The chemical
structure given in Fig. No.1. The use of Rabeprazole sodium is Proton Pump Inhibitor [3,4,5]. Another active component of the combination is Aceclofenac,
*Corresponding Address: M.A. Nagras
Department of Pharmaceutical Chemistry, Sinhgad College of Pharmacy, Vadgaon (Bk.),
Pune -411041, Maharashtra, India Email: [email protected]
with anti-inflammatory activity having the chemical name {[2-(2', 6'-dichlorophenyl) amino] phenyl acetoxyacetic acid}[2] .The chemical structure is given in Fig. 2. Such a combination is used an antacid and pain relief. Literature survey revealed that various analytical methods have been published for determination of Rabeprazole sodium such as
UV[6,7],HPLC[8,9,10,11] and for
determination of Aceclofenac in bulk & tablet dosage form single or in combination by
HPLC[12,13,14,15] and UV[16] method are
found. So far, no stability indicating RP-HPLC
assay method has been reported for
proposed necessary to a new rapid and stability-indicating method for simultaneous determination of aceclofenac& Rabeprazole sodium in its capsule dosage form and to validate the Proposed method as per ICH guidelines[17].
EXPERIMENTAL PROCEDURE
Reagents & Materials
The active pharmaceutical ingredients
Aceclofenac and Rabeprazole sodium were supplied by Elder Pharma Pvt. Ltd. and Capsule (Label claim: 20µg/capsule of
Rabeprazole sodium& 200µg/capsule of
Aceclofenac, Product name: Altraday capsule & Manufacturer: Ranbaxy Healthcare) were procured from the market. HPLC grade Acetonitrile, ,Methanol were obtained from Merck specialties Pvt. Ltd,). HPLC system of Waters-alliance instrument equipped with Empower software, inbuilt solvent degasser system, quaternary pump and photodiode array detector with variable injector and auto sampler was used. Column used was Hypersil C18 (150 x 4.6 mm, 5µm) G.L. Science Inc. Japan.
CHROMATOGRAPHIC CONDITIONS
Chromatographic separation was achieved at ambient temperature on a reversed phase column using mobile phase consisting of mixture of dipotassium hydrogen phoshphate buffer pH 6.0 (6.9672g dipotassium hydrogen phoshphate buffer in 2 lit. purified water) & Acetonitrile in the ratio of 67:33’ the pH of mobile phase was adjusted to 6.0 ± 0.1 with Ortho phosphoric acid at a flow rate maintained at 1 ml/min. and detection was carried out at 280nm.Diluent-(methanol (80) : water (20) : diethyl amine (0.1) .The injection volume was 20 µl for assay and degradation level.
PREPARATION OF STANDARD SOLUTIONS
Preparation of standard stock solution
Weighed of 200.0 mg of Aceclofenac was dissolved in diluent (methanol (80): water (20): diethyl amine (0.1) and volume was made up to 100.0 ml with same solvent. A 5.0
ml of resultant solution was diluted to 50.0 ml with mobile phase to give a solution of
aceclofenac (Concentration 200 µg/ml).
Similarly 20.0 mg of RBP Sodium was dissolved in diluent (methanol (80): water (20) : diethyl amine (0.1) and diluted to 100.0 ml. A 5.0 ml of resultant solution was diluted to 50.0 ml with diluents (Concentration 20
µg/ml).
Working standard preparation
An accurately weighed quantity of ACF (200.0 mg) and RBP Sodium (20.0 mg) were transferred to 100.0 ml volumetric flask and dissolved in about 50.0 ml diluent and the volume was made up to the mark with diluent (methanol (80) : water (20) : diethyl amine (0.1).
Working mixed standard solution
From the above solution 5.0 ml was further diluted to 50.0 ml by diluent (methanol (80) : water (20) : diethyl amine (0.1) to get
concentration of 200 µg/ml and 20 µg/ml for
ACF and RBP Sodium respectively.
ANALYSIS OF MARKETED FORMULATION
Twenty capsules were weighed and the pellets were removed and crushed to obtain fine powder. An accurately weighed quantity of pellet powder equivalent to 200 mg ACF and 20 mg RBP Sodium was transferred into 100.0 ml volumetric flasks, 60 ml of diluent was added and ultrasonicated for 10 minutes and diluted up to the mark with same solvent the solution was mixed and filtered through 0.45 µ membrane filter. The filtrate was further
diluted with diluent to obtain final
Amount of drug estimated in mg/tablet and percent label claim was calculated using
following formula:
Where, PA Spl - Peak area of sample,
PA Std - Peak area of standard, df - Dilution factor. Percent label claim was calculated using formula:
Fig. 1: chemical structure of RBP Sodium
Content of drug in sample
Percent label claim = --- x 100
Label claim
Content of drug PA Spl Weight of std. (mg) df Avg. Weight of
in sample = --- x --- x --- x capsule (mg) (mg/cap.) PA Std df Weight of capsule
Fig. 2: chemical structure of Aceclofenac
Table 9: Assay results for analysis of marketed formulation
FORCED DEGRADATION STUDIES
Acid Hydrolysis
The 450 mg of sample was taken in each of three 100 ml volumetric flasks. Then 50 ml of diluents was added them. Samples were allowed completely mix into the diluent. 1 ml each of 0.01 M HCl, 0.1 M HCl, 1 M HCl were added in first, second and third
volumetric flask simultaneously. The
volumetric flasks were kept aside for 1 hr.
After 1 hr 0.01 M NaOH, 0.1 M NaOH, 1 M NaOH were added in simultaneous manner into the volumetric flasks for neutralization of sample solution. Then volume made up to the mark with diluent. After that 5ml of the above solutions were diluted upto 50 ml. So as to obtain the working standard of 200 µg/ml (ACE) & 20 µg/ml (RBP Sodium) and subjected to HPLC analysis[11].
Base hydrolysis
The 450 mg of sample was taken in each of three 100 ml volumetric flasks. Then 50 ml of diluents was added them. Samples were allowed completely mix into the diluent. 1 ml each of 0.01 M NaOH, 0.1 M NaOH, 1 M NaOH were added in first, second and third
volumetric flask simultaneously. The
volumetric flasks were kept aside for 1 hr. After 1 hr to that solutions 0.01 M HCl, 0.1 M HCl, 1 M HCl were added in simultaneous manner into the volumetric flasks for neutralization of sample solution. Then volume made up to the mark with diluent. After that 5ml of the above solutions were diluted upto 50 ml. So as to obtain the working standard of 200 µg/ml (ACE) & 20 µg/ml (RBP Sodium) and subjected to HPLC analysis.
Component Label claim (mg)
Retention
Time Average Area S.D. % R.S.D. % Assay
Aceclofenac 200 5.6 5968580 35378 0.6 100.99
Rabeprazole sodium
Peroxide degradation (H2O2 30 % w/v)
The 450 mg of sample was taken into the 100 ml volumetric flask. Then added 50 ml of diluent and mixed well. Then 1 ml H2O2 was added into the volumetric flask. After that volumetric flask was kept aside for 1 hr. Further volume made up to 100 ml of volumetric flask. Then 5ml of the above solution was diluted upto 50ml So as to obtain the working standard of 200 µg/ml (ACE) & 20 µg/ml (RBP Sodium) and subjected to HPLC analysis.
UV light degradation (UV chamber)
The 450 mg sample was kept UV chamber for 24 hr. After this was transfer to volumetric flask. Allowed dissolved with the diluents. Then volume was made upto 100 ml of volumetric flask. From that solution 5 ml of were taken into 50 ml of volumetric flask and volume was made upto 50 ml of diluent. So as to obtain the working standard of 200 µg/ml (ACE) & 20 µg/ml (RBP Sodium) and subjected to HPLC analysis.
Thermal degradation
The 450 mg of sample was kept in c at 105 ᵒ
C in hot air oven for 24 hr. Then 450 mg were taken from this sample into the 100 ml of volumetric flask. Diluent was added to dissolve the sample completely into diluent. Volume was made upto 100 ml . Then 5 ml of this solution was taken into 50 ml of volumetric flask volume was made upto 50 ml
with diluent. So as to obtain the working standard of 200 µg/ml (ACE) & 20 µg/ml (RBP Sodium) and subjected to HPLC analysis.
RESULTS AND DISCUSSION
HPLC method development and optimization
Optimization of the chromatographic conditions in order to develop stability indicating assay method for the simultaneous estimation of Aceclofenac (ACE) & Rabeprazole sodium (RBP) was found to be a challenging task because of their combination ratio of approximately 200;20. Wavelength of detection selected to be 280 nm from overlaid spectrum of ACE & RBP. Diluents is selected upon solubility of both drugs -(methanol (80) : water
(20) : diethyl amine (0.1) . Two
chromatographic columns were tried such as Hypersil BDS-C18 (150 x 4.6 mm, 5µm), Hypersil BDS-C18 (250 x 4.6 mm, 5µm), and different mobile phases (containing buffers like Dipotassium hydrogen phosphate, ) like
Buffers (pH 6-7): Acetonitrile,
Acetonitrile:Water, Methanol:Water, in
different composition by isocratic elution. The chromatographic separation was achieved using C18 (150 x 4.6 mm, 5µm) column with
isocratic elution having mobile phase
composition containing 0.02 M buffer pH 6.0 & Acetonitrile in the ratio of 67:33 gave good peak shape, resolution and theoretical plates
with less than 2% tailing factor.
Fig.3: Typical chromatogram of Rabeprazole sodium & Aceclofenac sample solution
Forced degradation study:
The sample solution containing Rabeprazole sodium &Aceclofenac subjected to acidic stress condition using 0.1 M HCL showed 20.61% degradation of Rabeprazole (fig.No.4) . The sample solution subjected to degradation by basic condtion using 1M NAOH for 1hr showed 48 .79% degradation of both drugs
(fig.No.5). When subjected to degradation by using 30% H2O2 for 1hr in which
Aceclofenac shows 1.77% degradation
(fig.No.6). Similarly the sample solution on thermal degradation showed degradation of 0.60% (fig.No.7). And on photolytic degradation by exposure to UV radiation showed 0.59% degradation (fig.No.8).
Fig. 5: Base Hydrolysis for 1 hr in 1M NaOH
Fig. 6: Oxidation for 1hr minutes in 30% H2O2
Fig.8: Photolytic degradation by exposure to UV radiations for 12 hours
Fig. 9: Linearity plot for Rabeprazole Sodium Fig. 10: Linearity plot for Aceclofenac
VALIDATION OF THE METHOD
The method was validated with respect to following parameters.
linearity
Linearity of the proposed method was carried out over the range of 50 % to 150 % of samples assay concentration (200 µg/ml and 20 µg/ml for Aceclofenac and Rabeprazole Sodium, respectively) and the linearity plots
were recorded in fig 9 & 10. Table No1 shows the result for the linearity of the proposed method. The calibration curve was prepared by the plot of concentration against the peak area counts. The slope, intercept and regression coefficient are as shown in Table 1. The results indicated that the method is linear in
the concentration range of 100-300µg/ml for
Aceclofenac and 10-30 µg/ml for Rabeprazole
Table 1: The linearity levels for Aceclofenac and Rabeprazole Sodium.
Sr. No ACF Conc.
µg/ml
ACF Area RBP Sodium Conc. µg/ml
RBP Sodium Area
1 100 2985909 10 339981
2 150 4340942 15 497396
3 200 5948976 20 684496
4 250 7402087 25 853195
5 300 8915780 30 1030413
Slope 29842 34733
Intercept 49616 13569
Correlation Coefficient
0.9995 0.9995
Precision
System precision (Repeatability)
The system precision was checked by using standard chemical substance to ensure that the analytical system is working properly. The
retention time, number of theoretical plates,
tailing factor and area of six determinations of standard preparation were measured and %
RSD was calculated. It is observed from the
data tabulated in Table 2, that the Rt and area response are consistent as evidenced by the values of RSD. Hence, it can be concluded that the system precision parameter meets the requirement of method validation.
Table 2: The results of the system precision
ACF RBP Sodium
Inj. No.
Area Rt (Min) Theoretical Plate/meter
Tailing Factor
Area Rt (Min)
Theoreticl Plate/metr
Tailing Factor
1 6258130 5.63 2945 1.84 739101 4.30 4384.78 1.42
2 6178566 5.62 2955 1.81 722927 4.30 4390.1 1.45
3 6185420 5.61 2940 1.79 730662 4.30 4381.46 1.4
4 6194966 5.61 2945 1.8 741408 4.30 4385.25 1.41
5 6168152 5.62 2953 1.82 734665 4.30 4389.65 1.46
6 6204780 5.63 2954 1.83 741461 4.30 4386.12 1.44
Mean 6198335 5.6 - - 735037 4.3 - -
RSD 0.51 0.16 - - 0.98 0.04 - -
Method precision (Reproducibility)
To perform this parameter of validation study homogenous sample of a single batch was analyzed six times. This indicates whether a
tabulated in Table 3 shows that method is precise as the % RSD for assay value were found to be 0.54 % and 0.52 % for
Aceclofenac and Rabeprazole Sodium
respectively.
Table 3: The results of the method precision.
ACF RBP Sodium
Set No. % Assay % Assay
1 100.43 99.45
2 100.66 99.26
3 101.41 99.53
4 101.53 99.45
5 100.98 99.18
6 100.13 100.62
Mean 100.85 99.58
RSD 0.54 0.52
Intermediate Precision (Ruggedness)
The procedure followed for assay method in method precision was repeated on two different days, by two different analysts, using two different columns and using two different HPLC systems. The Intermediate precision of the proposed method and % RSD for inter-day condition were found to be 0.54 % and 0.62% for Aceclofenac and 0.52 % and 0.57 % for
Rabeprazole Sodium in standard preparation in case of analyst-I and analyst-II, respectively, which illustrated the reproducibility of the method. The results for comparison of method precision and intermediate precision are shown in Table 4. The acceptance criterion was 2.0 % and the outcomes of the experiments were within the acceptable limits. The method was seen to be rugged and this shows that it complies with the regulatory requirements
. Table 4: Comparison of method precision and intermediate precision
Parameters ACF RBP Sodium ACF RBP Sodium
Analyst Analyst 01 Analyst02
Day 05/07/12 07/07/12
Instrument HPLC 01 HPLC 02
Column Hypersil BDS C18 003 Hypersil BDS C18 005 Mean Peak Area 5646748 628351 5686528 635382
% Assay 100.85 99.58 100.45 99.96
% RSD 0.54 0.52 0.62 0.57
Robustness of the method
The robustness of the method was evaluated
by varying method parameters suchas percent
organic content, pH, ionic strength,
temperature, etc., and determining the effect
on the results of the method. From the results (Table 5), it can be concluded that, the method is robust.
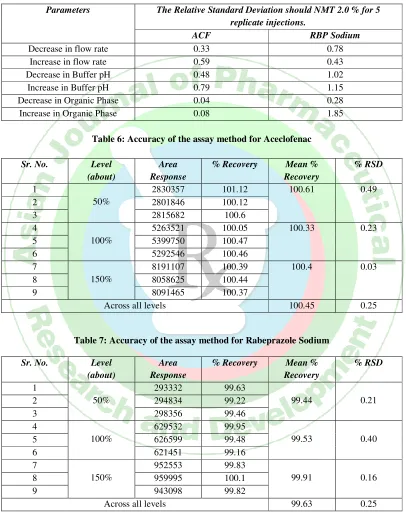
Accuracy
The accuracy of the method was performed by
recovery studies. The retention time of
99.44, 99.53 and 99.91 %; with mean % recovery was found to be 99.63 % for Rabeprazole Sodium. The %RSD was less in all the three spiked levels. The higher percentage mean recovery indicated that the
proposed method was accurate and reliable. The results of recovery experiments of the method are depicted in the Table 6 and Table 7. The chromatogram for 50, 100 and 150 % spiking[16,17].
Table 5: Robustness & Ruggedness results
Parameters The Relative Standard Deviation should NMT 2.0 % for 5 replicate injections.
ACF RBP Sodium
Decrease in flow rate 0.33 0.78
Increase in flow rate 0.59 0.43
Decrease in Buffer pH 0.48 1.02
Increase in Buffer pH 0.79 1.15
Decrease in Organic Phase 0.04 0.28
Increase in Organic Phase 0.08 1.85
Table 6: Accuracy of the assay method for Aceclofenac
Sr. No. Level (about)
Area Response
% Recovery Mean % Recovery
% RSD
1
50%
2830357 101.12 100.61 0.49
2 2801846 100.12
3 2815682 100.6
4
100%
5263521 100.05 100.33 0.23
5 5399750 100.47
6 5292546 100.46
7
150%
8191107 100.39 100.4 0.03
8 8058625 100.44
9 8091465 100.37
Across all levels 100.45 0.25
Table 7: Accuracy of the assay method for Rabeprazole Sodium
Sr. No. Level (about)
Area Response
% Recovery Mean % Recovery
% RSD
1
50%
293332 99.63
99.44 0.21
2 294834 99.22
3 298356 99.46
4
100%
629532 99.95
99.53 0.40
5 626599 99.48
6 621451 99.16
7
150%
952553 99.83
99.91 0.16
8 959995 100.1
9 943098 99.82
Across all levels 99.63 0.25
System suitability
The overall system was evaluated for the system suitability of the proposed method. The 10 % asymmetry of Aceclofenac and Rabeprazole Sodium was less than 2.5 which
Table.8: Summary of system suitability studies of Assay method by HPLC.
System Suitability Parameter Observation Acceptance Criteria
ACF RBP Sodium
Tailing factor 1.85 1.42 NMT 2.0
Peak asymmetry (10%) 2.43 1.64 NMT 2.5
Theoretical plates (N) 2943.40 4384.78 NLT 2000
% RSD of 6 injections 0.59 0.98 NMT 2.0
CONCLUSION
A simple, economical, precise and accurate RP-HPLC method for the estimation of Rabeprazole sodium & Aceclofenac has been developed. This method was validated as per ICH guidelines. Results suggest that the developed method can be used for routine
quality control studies for assay of
Rabeprazole sodium & Aceclofenac in bulk and capsule dosage form.
ACKNOWLEDGEMENT
The authors would like to convey regards to Elder Pharma Pvt. Ltd.,Nerul, Navi Mumbai, for providing the gift sample of the pure drug and Principal, Sinhgad college of Pharmacy, Vadgaon (Bk.), Pune for providing the necessary facilities for carrying out the research work.
REFERENCES
1. USP36- NF 31, United states pharmacopeial convention, inc. 12601, twarkway, Rockville, official May 1- July 31, 2000; 1923
2. USP36- NF 31, United states pharmacopeial convention, inc. 12601, twarkway, Rockville, official May 1- July 31, 2000; 2149
3. Williams MP. Review article: the pharmacology of Rabeprazole; Alimentary Pharmacology & Therapeutics. 2001;13:3 – 10
4. Jones MP, Shah D, EbertCC. Effects of Rabeprazole Sodium on Gastric Emptying, Electrogastrography, and Fullness; Digestive Diseases and Sciences; 2004;48:69 - 73
5. Anastacio M. Hoyumpa MA, Alanis HT, Humphries TJ. Rabeprazole: Pharmacokinetics in patients with stable compensated cirrhosis; Clinical Therapeutics. 21;1999:691-701
6. Dobaria NB, Vadia NH, Rajput SJ. Simultaneous Spectrophotometric Estimation of Rabeprazole Sodium and Domperidone Maleate in their combined pharmaceutical dosage form. International Journal of ChemTech Research. 2009;1:1162-1166
7. Sabnis SS, Dhavale ND, Jadhav VY, Tambe SR, Gandhi SV. Spectrophotometric Simultaneous
Determination of Rabeprazole Sodium and
Domperidone in Combined Tablet Dosage Form. Eurasian Journal of Analytical Chemistry. 2008;3:236 - 244
8. Patel BH, Suhagia BN, Patel MM, Patel JR. Determination of Pantoprazole, Rabeprazole, Esomeprazole, Domperidone and Itopride in Pharmaceutical Products by Reversed Phase Liquid Chromatography Using Single Mobile Phase. Chromatographia. 2007;65:743 – 748
9. Cassia V, Garcia CV, Paim CS, New Liquid Chromatographic Method for Determination of Rabeprazole Sodium in Coated Tablets. Journal of AOAC International. 2004;87:842-846
10. Chaudhary B, Goyal A, Khokra SL, Kaushik D. Simultaneous Estimation of Diclofenac Sodium and
Rabeprazole by High Performance Liquid
Chromatographic Method in Combined Dosage Forms. International Journal of pharmaceutical Sciences and Drug Research. 2009;43-45
11. Sahu D, Agrawal Y, Sabarwal N, Jain A, Gupta AK. Simultaneous Estimation of Aceclofenac & Rabeprazole Sodium In Solid Dosage Form. Asian Journal of Biochemical and Pharmaceutical Research. 2011;1(3):567-573
12. Sahu D, Yogesh P, Sabarwal N, Jain A & Gupta A K. Simultaneous Estimation of Aceclofenac & Rabeprazole Sodium in Solid Dosage Form. Asian Journal of Biochemical and Pharmaceutical Research, 2011;1(3):231-256.
13. Omkar DS, Manisha P, Yeole PG. A Validated
Reversed Phase-High Performance Liquid
Chromatographic (RP-HPLC) Method for
Simultaneous Estimation of Aceclofenac Drug Substance and Its Related Traces Impurities in The Solid Dosage Form. International Journal of ChemTech Research. 2005; 3:547-554.
14. Gandhi SP, Dewani MG, Borole TC, Damle MC. Devlopment And Validation of Stability Indicating HPLC Method For Determination of Diacerine And Aceclofenac As Bulk Drug And in Tablet Dosage Form. International Journal of Research in Pharmacy and Chemistry. 201;1(4):223-228. 15. Yadav AH, Kothapalli LP, Barhate AN, Pawar HI,
International Journal of Pharma Research and Development, 2009;1(1):789-795.
16. Chitlange SS, Pawbake GR, Mulla AI, Wankhede SB. Simultaneous Spectrophotometric Estimation
of Diacerein and Aceclofenac in tablet dosage form. Der Pharma Chemica, 2010:2(1):335-341. 17. ICH, Q2 (R1) Validation of Analytical Procedures: